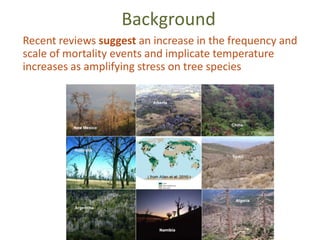
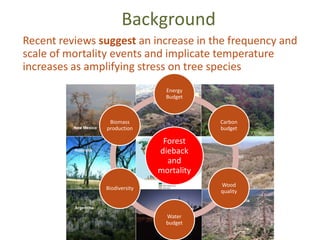
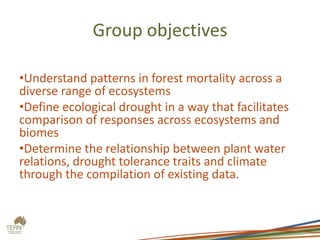
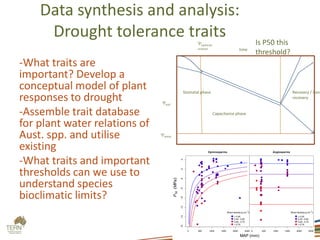
Drought impacts on ecosystems
Dead wood group – Forest mortality and Australian
terrestrial carbon stores
Patrick Mitchell – CSIRO Ecosystem Sciences
Background
Recent reviews suggest an increase in the frequency and
scale of mortality events and implicate temperature
increases as amplifying stress on tree species
Background
Recent reviews suggest an increase in the frequency and
scale of mortality events and implicate temperature
increases as amplifying stress on tree species
Forest
dieback
and
mortality
Energy
Budget
Carbon
budget
Wood
quality
Water
budget
Biodiversity
Biomass
production
Group objectives
•Understand patterns in forest mortality across a
diverse range of ecosystems
•Define ecological drought in a way that facilitates
comparison of responses across ecosystems and
biomes
•Determine the relationship between plant water
relations, drought tolerance traits and climate
through the compilation of existing data.
Dead wood collective -who are we?
Group comprised:
-Physiologists: water
relations, hydraulics, C
dynamics
-Ecologists: invasives,
recruitment and
restoration
-Modellers: process-
based, carbon
accounting/dynamics
-Industry reps: forest C
accounting
Forest mortality database: if a tree falls
in woods...
-Living database based on
lit survey of known tree
die-off events associated
with drought
-Provides data on basic
attributes of site and
event
-Data tends to be biased,
incomplete and patchy
-Develop a mortality
niche (Mitchell et al. Ecol.
and Evol. 2014)
Data synthesis: towards an ecologically
relevant definition of drought
-Apply a risk-based framework to define drought
impacts on ecosystems
-Assess exposure using a probabilistic approach
-Quantify key features of ecosystem resistance
and resilience to drought
Data synthesis:
- Involves a broad
assessment of drought to
include processes such as
recruitment, productivity
and canopy
collapse/mortality
- Develop approach to
merge exposure and
sensitivity to predict species
and ecosystem responses
- Example: Using ecological
transformations we can
estimate droughts that may
exceed these physiological
thresholds
Probability of occurrence
i) Recruitment failure – 18 %
ii) Cessation of productivity – 8 %
iii) Canopy collapse – 2 %
Data synthesis and analysis:
Drought tolerance traits
-What traits are
important? Develop a
conceptual model of plant
responses to drought
-Assemble trait database
for plant water relations of
Aust. spp. and utilise
existing
-What traits and important
thresholds can we use to
understand species
bioclimatic limits?
Recovery / non-
recovery
time
leaf
lethal
hydraulic
isolation
Capacitance phase
Stomatal phase
Is P50 this
threshold?
0 500 1000 1500 2000 2500
-16-14-12-10-8-6-4-2
Gymnosperms
MAP (mm)
P50MPa
Wooddensitygcm
3

< 0.45
0.45 - 0.60
0.60 - 0.75
> 0.75
Angiosperms
MAP (mm)
P50MPa
Wooddensitygcm
3

< 0.45
0.45 - 0.60
0.60 - 0.75
> 0.75
0 500 1000 1500 2000 2500
MAP (mm)
P50MPa
What we learned from our working
group
-Event database: key outcome was establishing
approaches to characterise event-based data and
how to use them
-Data synthesis: this component produced some
novel and testable frameworks and approaches to
broaden our understanding of drought and forests
-Trait database: take a step back and see how the
system behaves and see if we are asking the right
questions and using the right trait data

Drought-induced mortality. Pat Mitchell, ACEAS Grand 2014

  • 1.
    Drought impacts onecosystems Dead wood group – Forest mortality and Australian terrestrial carbon stores Patrick Mitchell – CSIRO Ecosystem Sciences
  • 2.
    Background Recent reviews suggestan increase in the frequency and scale of mortality events and implicate temperature increases as amplifying stress on tree species
  • 3.
    Background Recent reviews suggestan increase in the frequency and scale of mortality events and implicate temperature increases as amplifying stress on tree species Forest dieback and mortality Energy Budget Carbon budget Wood quality Water budget Biodiversity Biomass production
  • 4.
    Group objectives •Understand patternsin forest mortality across a diverse range of ecosystems •Define ecological drought in a way that facilitates comparison of responses across ecosystems and biomes •Determine the relationship between plant water relations, drought tolerance traits and climate through the compilation of existing data.
  • 5.
    Dead wood collective-who are we? Group comprised: -Physiologists: water relations, hydraulics, C dynamics -Ecologists: invasives, recruitment and restoration -Modellers: process- based, carbon accounting/dynamics -Industry reps: forest C accounting
  • 6.
    Forest mortality database:if a tree falls in woods... -Living database based on lit survey of known tree die-off events associated with drought -Provides data on basic attributes of site and event -Data tends to be biased, incomplete and patchy -Develop a mortality niche (Mitchell et al. Ecol. and Evol. 2014)
  • 7.
    Data synthesis: towardsan ecologically relevant definition of drought -Apply a risk-based framework to define drought impacts on ecosystems -Assess exposure using a probabilistic approach -Quantify key features of ecosystem resistance and resilience to drought
  • 8.
    Data synthesis: - Involvesa broad assessment of drought to include processes such as recruitment, productivity and canopy collapse/mortality - Develop approach to merge exposure and sensitivity to predict species and ecosystem responses - Example: Using ecological transformations we can estimate droughts that may exceed these physiological thresholds Probability of occurrence i) Recruitment failure – 18 % ii) Cessation of productivity – 8 % iii) Canopy collapse – 2 %
  • 9.
    Data synthesis andanalysis: Drought tolerance traits -What traits are important? Develop a conceptual model of plant responses to drought -Assemble trait database for plant water relations of Aust. spp. and utilise existing -What traits and important thresholds can we use to understand species bioclimatic limits? Recovery / non- recovery time leaf lethal hydraulic isolation Capacitance phase Stomatal phase Is P50 this threshold? 0 500 1000 1500 2000 2500 -16-14-12-10-8-6-4-2 Gymnosperms MAP (mm) P50MPa Wooddensitygcm 3  < 0.45 0.45 - 0.60 0.60 - 0.75 > 0.75 Angiosperms MAP (mm) P50MPa Wooddensitygcm 3  < 0.45 0.45 - 0.60 0.60 - 0.75 > 0.75 0 500 1000 1500 2000 2500 MAP (mm) P50MPa
  • 10.
    What we learnedfrom our working group -Event database: key outcome was establishing approaches to characterise event-based data and how to use them -Data synthesis: this component produced some novel and testable frameworks and approaches to broaden our understanding of drought and forests -Trait database: take a step back and see how the system behaves and see if we are asking the right questions and using the right trait data