This document summarizes the work of the RIPCORD-ISEREST project, which aims to improve road safety in Europe through research on road infrastructure measures. Workpackage 2 focused on accident prediction models (APMs) and road safety impact assessments (RIAs) as tools to help practitioners manage road safety. The document reports that APMs relate crash statistics to explanatory variables like traffic volume and road length. Pilot studies found these two factors are most important for APMs of road sections and intersections. RIAs assess the safety impact of plans like road works or safety schemes. The document provides recommendations for using APMs to identify unsafe roads and for conducting RIAs at various levels from single projects to national networks.
This document discusses road safety issues in India. Some key points:
- One death occurs on Indian roads every four minutes, with over 137,000 deaths in 2013. Common causes of accidents include speeding, drunk driving, and overloading of vehicles.
- The top cities for road deaths are Delhi, Chennai, Jaipur, Bengaluru, and Mumbai. Accident rates have been increasing over the past decade. Specific engineering issues like median barriers and road construction also contribute to accidents.
This document discusses road safety and road safety engineering. It notes that over 1.3 million deaths occur each year from traffic accidents, with 90% occurring in low and middle income countries. Road safety engineering aims to modify the physical road environment to reduce risks for all users. It involves road design, traffic engineering, analysis, and applying techniques like proper super elevation, pavement structure, traffic signs and signals, and designing intersections and interchanges. The goal is to counteract forces that could cause vehicles to overturn or skid and help ensure safe travel.
This document provides an introduction to road safety fundamentals. It discusses how road safety is an important public health issue, as motor vehicle crashes kill over 1 million people worldwide each year. In the U.S., around 37,000 people are killed in crashes annually. The document defines key road safety terms and metrics used to measure safety such as crash frequency, rates, outcomes, and surrogate safety measures. It also distinguishes between nominal and substantive safety. The goal is to minimize crashes and resulting deaths and injuries through a comprehensive approach involving many stakeholders from different disciplines.
1.Safety Evaluation of a Highway using IRAP 1 (2).pdfpushraj5
This document summarizes an IRAP assessment of a 2.2km to 4.2km section of NH314 in Bankura district, West Bengal. The assessment found mixed star ratings of 1-5 for different road users, with most sections rated 2 stars for pedestrians and motorcyclists. Countermeasures proposed to improve safety included adding delineation, improving skid resistance, school zone signs, a separated path for bicyclists and pedestrians, and a median barrier. When modeled, these countermeasures increased the star ratings along one selected section to over 3 stars, improving safety for all road users.
The content of presentation slides describe the concept of road safety auditing and its application starting from the planning of the road project until opening the road.
This document discusses road safety as a global problem and provides statistics and information about road accidents in various countries and Malaysia specifically. Some key points:
- An estimated 1.2 million people are killed in road accidents worldwide annually, with 20-50 million injured. Developing countries see 20-200 deaths per 10,000 vehicles while developed countries see 2-5 deaths.
- In Malaysia, the average number of deaths from road accidents is around 6,000 per year. Human error is the main cause, with things like close following, dangerous cornering, overtaking and speeding being significant factors.
- Various strategies are used in Malaysia to reduce accidents and fatalities, including targeting high-risk locations,
Chapter -I Introduction of Road Safety by Dr.Makendran Cmakendran1
This document discusses road safety and accident analysis in Ethiopia. It defines key terms related to transportation engineering and road safety. It discusses factors that influence road safety such as human behavior, vehicle design, and roadway design. It identifies common causes of accidents in Ethiopia such as speeding, failure to yield to pedestrians, and lack of enforcement. The objectives of road safety engineering are outlined as well as methods to achieve those objectives like road safety audits.
This document discusses various highway safety measures adopted by civil engineers. It begins by defining highways and highway safety. It then discusses why road accidents are occurring and why safety measures are important. The rest of the document outlines specific safety measures like rumble strips, designing safe roadsides and junctions, traffic calming designs, innovative interchange designs, use of traffic signs, and roundabouts. The overall goal is to reduce accidents and improve safety for all road users.
Its a presentation on road safety. Cover the topics of road language i.e. lane, line, double line, sign boards, signals, safety tips, pre/post cautionary measures, topic of motorcyclist and pedestrians as well.
The document discusses the key components and process of conducting a Traffic Impact Assessment (TIA) for a development project. A TIA is needed to analyze the traffic effects of a development on surrounding transport facilities. The summary includes:
1) A TIA involves analyzing existing traffic conditions, trip generation from the development, trip distribution patterns, modal split, and impacts on road network capacity, safety, and public transport facilities.
2) The analysis includes traffic surveys, calculating trip generation based on development size and land use, distributing trips based on gravity models, and assigning trips based on modal split ratios.
3) The TIA report outlines impacts and makes proposals to mitigate problems identified, such as exceeding road network capacity
This document provides guidance on conducting risk assessments through a 5-step process: 1) identify hazards, 2) identify those affected, 3) evaluate risks and controls, 4) record findings, and 5) review regularly. It outlines how to recognize hazards, consider who may be harmed and how, determine existing and needed controls, and document the process. Key steps include walking work areas to find hazards, asking employees for input, and comparing controls to good practices. The goal of risk assessment is to prevent harm through reasonable precautions.
accident report for cars
form for accident report
blue report for accident
accident reports for nc
the best study method
effective study methods
causes of accidents
factors affecting accidents
how accident data are collected
Strategies to reduce road traffic fatalitiesJeewantha Dias
This document outlines strategies to reduce road traffic fatalities in Sri Lanka. It discusses causes of fatal accidents such as speeding, overtaking, drunken driving, and negligence of pedestrians. Preventive measures are categorized into vehicle-related, driver-related, pedestrian-related, and road safety-related. Vehicle-related measures include promoting air bags, seat belts, proper vehicle maintenance, and safety equipment for motorcycles. Driver-related measures involve enforcing speed limits, seat belt laws, medical fitness checks, and driver education. Pedestrian-related strategies focus on educating pedestrians on safe crossing. Road safety measures center on signage, infrastructure improvements, and traffic enforcement. Responsible government organizations coordinate policies and programs related to
This document contains information about Ravindra Yadav, a first year mechanical engineering student. It discusses traffic engineering, factors affecting traffic such as road users, vehicles, roadways and environment. It covers traffic characteristics, studies, operation, planning, design, management and administration. Specific topics discussed include road user characteristics, vehicular characteristics, density, capacity, time headway and space headway. The document also discusses traffic regulation through devices like licenses, vehicle registration, transport authorities, speed limits and control devices. It describes different types of traffic signs used for regulation, warning and providing information.
It is related to Road Safety Engineering, I choose a location and did the Accident analysis and the survey for the location and I have suggested some Mitigation measures for the improvement of the area.
Road safety audit presentation with special application to pedestrian issuesnickfortey
The document describes the process and benefits of road safety audits (RSAs). RSAs involve an independent team examining a road segment or intersection to identify potential safety issues. The 8-step process includes identifying the project, selecting an audit team, conducting field reviews under various conditions, analyzing findings, presenting results, and incorporating improvements. RSAs help reduce crashes and injuries by considering human factors and identifying hazards before or after a road is built.
This document discusses different types of traffic signs and signals used to regulate traffic and ensure safety. It describes warning signs that indicate potential hazards, priority signs that establish right-of-way, and prohibitory/restrictive signs banning certain maneuvers. It also covers mandatory signs that require specific traffic behavior, service signs providing information to drivers, and directional signs indicating locations and destinations. Proper use and placement of traffic signs and signals can help reduce accidents by clearly conveying important safety and navigation information to road users.
Traffic Congestion PowerPoint Presentation with ImagesRoad Safety
Traffic Congestion PowerPoint Presentation with photos, how to reduce traffic congestion, costs of traffic congestion, road accidents and traffic congestion, loss of time due to congestion, pollution, health , diseases, photos, images
This document discusses traffic signal coordination, which aims to manage streets and signal systems more efficiently through techniques that improve safety, economic vitality, and quality of life. Effective signal coordination reduces congestion and vehicle emissions while saving time. Key factors in coordination include cycle length, green splits, phase sequence, and offsets between intersections. The concept of bandwidth, or the amount of green time for progression, is also explained. While coordination provides benefits, some exceptions exist like busy intersections in less congested areas. New concepts in actuated signal coordination involve background cycle lengths, yield points, sync phases, and force off points.
Fermilab observes Illinois traffic safety rules and has identified five factors contributing to most on-site vehicle accidents: improper backing, hazardous weather, distracted driving, speeding, and improper road sharing. Fermilab employs corrective actions for violations which are detailed in its ES&H Manual. The document provides tips for safe driving practices including proper backing techniques, winter driving preparedness, avoiding distractions, maintaining safe speeds, and sharing the road courteously with bicycles and motorcycles.
This document discusses traffic flow, issues that can impact it like improper signage or one-way streets, and things that can help like traffic lights, pedestrian walkways, and dedicated lanes. It instructs engineers to watch a video on traffic flow in India to observe problems and then discuss and draw solutions, such as infrastructure changes, that could help fix traffic flow issues.
Accident study and analysis, objective, causes of accidents, and analysis of accident (collection of data and preparing reports and record) , types of accidents, and statistical analysis of accidents.
ITS 2018 Denmark Publication: Advancing active safety and testing methodologi...Ilona Anna Cieslik
This document discusses the PROSPECT project which aims to improve active safety systems for protecting vulnerable road users (VRUs) like pedestrians and cyclists. The project seeks to (1) expand the scope of urban scenarios addressed, (2) improve overall autonomous emergency braking and steering system performance, and (3) propose extensive validation methodologies for testing. Accident analysis identified the most common accident scenarios involving VRUs. Naturalistic observations provided additional behavior data. Three demonstration vehicles will test sensor and control concepts in realistic scenarios using novel dummy specimens. The vehicles aim to address limitations of current systems like sensor field-of-view and reaction times. Extensive testing methodologies beyond current practices are proposed.
Manuscript next generation advanced driver assistance systems towards the pro...Ilona Anna Cieslik
This document summarizes a research project called PROSPECT that aims to improve active safety systems for protecting vulnerable road users like cyclists and pedestrians. The project will develop and test new sensor and control technologies on three vehicle demonstrators. Key findings from accident analyses were used to identify the most common accident scenarios and develop test cases to evaluate the demonstrator vehicles. Naturalistic observations of vehicle-cyclist and vehicle-pedestrian interactions were also conducted. The demonstrator vehicles will feature expanded sensor fields of view, improved detection and classification of vulnerable road users, and controls that can automatically steer or brake to avoid collisions. The goal is to enhance safety and address limitations of current systems through innovative sensing and reaction capabilities.
Paper No.19-0277-O
Improving the Effectiveness of Active Safety Systems to Significantly Reduce Accidents with Vulnerable Road Users - The Project Prospect (Proactive Safety for Pedestrians and Cyclists)
ILONA CIEŚLIK
IDIADA Automotive Technology, Spain
JORDANKA KOVACEVA
Chalmers University of Technology, Sweden
MARIE-PIERRE BRUYAS
Institut Français des Sciences et Technologies des Transports, de l’Aménagement et des Réseaux (IFSTTAR), France
DAVID R. LARGE
University of Nottingham, United Kingdom
MARTIN KUNERT
Robert Bosch GmbH, Germany
SEBASTIAN KREBS
Daimler AG, Germany MAXIM ARBITMANN
Continental Teves AG & Co.OHG, Germany
TRA 2018 Vienna Publication: Advancing active safety towards the protection o...Ilona Anna Cieslik
1. The document describes the PROSPECT project, which aims to improve active safety systems for protecting vulnerable road users (VRUs) like pedestrians and cyclists.
2. The project is developing three vehicle demonstrators and a driving simulator to test new sensor concepts and VRU detection/prediction technologies. One demonstrator focuses on stereo cameras and high-resolution radars, another on sensor fusion for earlier VRU detection, and a third expands radar coverage for complex urban scenarios.
3. The project is addressing key barriers of current active braking systems like limited sensor field of view, inaccurate path prediction, unreliable intent recognition, and slow reaction times. New sensors and algorithms will provide expanded coverage, improved classification
This document summarizes a paper about Shell Exploration and Production's approach to improving global road safety. It discusses developing concise minimum road safety standards, implementing a 10-year plan with a goal of zero road fatalities, and focusing on driver attitude/behavior, innovation/research, industry collaboration, and monitoring implementation. The full paper provides more details on Shell's integrated, long-term approach to continuously improve road safety management and performance.
Quantifying modelingon risk of travel demand and measure to sustaining road s...eSAT Journals
Abstract In these days urbanization of road transportation facilities are more complexity to developing in the form of to improve road safety. With the increased usage of Vehicles has enhanced the need for developing the infrastructure where these motor vehicles can move safely. By developing safe roads which connect destinations and cities is a key foundation to infrastructural development in a safe connectivity of road transportation. Mainly in this study can approach the road safety by using principal component analysis(PCA) by using MAT LAB and geographical information system (GIS) Arc-GIS software to develop base maps and accident causing zones identify in the study area. In this study an attempt has been made to study the existing road network for Ongole, Pernamitta village road (Kurnool road state highway) area and propose the necessary improvements to be done. And this model presented in this paper discussing with a multi set of variables under the one dimensionality set to identifying and deriving the new data set for risk identify zones with raking by this analysis of principal component analysis. The safety audit is defined as the place or location which causes number of accidents. It may be curve or faulty infrastructure. Such accidents are taken as input from Ongole taluka Police Station at Ongole for further study. These accidents are registered from First Information Report (FIR) informed by people. The study areas taken into consideration are Ongole to Pernamitta village Road (Ongole to Kurnool UN divided two way line state highway). The aim of this study is to minimize the accidents and find out the risk identify zones on the particular road network. Key words: road safety,faulty infrastructure, PCA analysis, Arc-GIS,FIR and urbanization.
This document discusses traffic parameters such as volume count, spot speed study, and saturation flow that are important inputs for transportation planning and operations. It describes how traffic volume is measured in passenger car units per hour to account for different vehicle types. Spot speed indicates the instantaneous speed of vehicles at a point, while density represents the number of vehicles per unit length of road. The document presents the methodology for analyzing these parameters under heterogeneous traffic conditions and concludes that improvements are needed for road widening, public transportation, and parking management to address congestion issues in India.
The aim of this study is to explore the impact of different technical solutions for Cooperative Intelligent Transport Systems (C-ITS) communication solutions on EU road safety over time. Three different communication solutions are assessed independently and consist of:
- Cellular vehicle-to-everything (C-V2X) communication based on the evolved LTE technology as defined by 3GPP (a global cellular specifications body), divided into two solutions:
o LTE-PC5: Communication solution that uses direct-mode communication between vehicles, road users and infrastructure operating in ITS bands (e.g. ITS 5.9 GHz)
independent of cellular network; o LTE-Uu (cellular): Network-based communications interface (Uu) operating in the
traditional mobile broadband licensed spectrum;
- 802.11p1 a Wi-Fi technology that supports Vehicle-to-vehicle (V2V) and Vehicle-to-Infrastructure (V2I) communications based on IEEE 802.11p and uses direct-mode communication operating in the ITS band of 5.9 GHz.
Road Safety Audit of Chamarajanagar to Haradanahalli District Forest - NH 948IRJET Journal
This document summarizes a road safety audit conducted on NH 948 from Chamarajanagar to Haradanahalli District Forest in India. The study aimed to identify accident blackspots along the 18.2 km stretch and provide recommendations. Accident data from 2017-2019 was collected and the stretch was divided into 5 sections. The section from Somawarapete to Haradanahalli junction had the highest accident rate based on an accident point weightage analysis. Common issues found along the road included lack of signs, markings, and maintenance. The audit identified hazards to improve safety and reduce accidents according to Indian Road Congress guidelines. Conducting road safety audits is an effective way to analyze accidents and recommend
The document provides guidelines for conducting Accident Investigation and Prevention (AIP) studies, which analyze accident data and investigate accident locations to identify countermeasures. It outlines the AIP process, including developing an annual plan to rank potential project sites and mass action treatments. Procedures cover setting up investigation teams, collecting and analyzing accident and road data, identifying countermeasure options, and reporting findings to develop a prioritized program of treatments aimed at reducing accidents.
Edge computing for CAVs and VRU protection Carl Jackson
A trial was conducted using edge computing deployed at road intersections to identify risks to vulnerable road users (VRUs) like pedestrians and cyclists. Four use cases were tested involving warning drivers of changing road conditions, reduced speed limits, impending intersection collisions, and detecting VRUs at risk of collision. The trials found that edge computing enabled detecting threats and issuing warnings within 1-2 seconds, significantly faster than cloud-based systems, potentially saving lives. The partners plan to further expand these types of trials to improve safety for VRUs.
TRAFFIC FORECAST FOR INTELLECTUAL TRANSPORTATION SYSTEM USING MACHINE LEARNINGIRJET Journal
1. The document discusses using machine learning techniques like random forests and support vector machines to predict traffic patterns using large datasets from intelligent transportation systems.
2. It proposes predicting traffic using an SVM algorithm with Euclidean distance metrics on traffic data derived from online sources, aiming to improve accuracy and reduce errors compared to existing systems.
3. The system would take in historical vehicle movement data to be trained via machine learning, allowing it to process large amounts of real-time sensor data and better predict traffic conditions, which could help minimize congestion and carbon emissions from transportation.
Sensor Based Detection & Classification of Actionable & Non-Actionable Condit...IRJET Journal
This document describes a proposed system to detect and classify the conditions of roadways using sensors in smartphones. The system aims to differentiate between actionable obstacles that require maintenance from non-actionable bumps or obstacles. It collects data from smartphone sensors like accelerometers and GPS under precise conditions while the phone is in a moving vehicle. This data is then analyzed using classification algorithms and thresholds to identify anomalous bumps or potholes that require repair. The locations and details of potential issues are stored on a server and displayed to users through a mobile app to help maintain road quality and provide route guidance. The system is intended to leverage daily smartphone use to engage people in contributing to improvements in their local transportation infrastructure.
IRJET-Road Traffic Accident Analysis and Prediction Model: A Case Study of Va...IRJET Journal
This document discusses road traffic accidents in Vadodara City, India. It analyzes accident data from 2010-2016 collected from local police stations. Key findings include:
- Accident severity, the number of people killed per 100 accidents, increased over this period.
- The highest numbers of accidents occurred in March-April and involved two and four-wheelers.
- Factors contributing to accidents included lack of median barriers, footpaths, traffic signals and signs.
- The study aims to identify causes of accidents, develop an accident prediction model, and propose safety improvements to reduce accidents.
IRJET- Algorithms for the Prediction of Traffic AccidentsIRJET Journal
This document discusses algorithms for predicting traffic accidents using association rules. It first provides background on studying factors that influence traffic accidents and using data mining approaches like association rules. It then reviews related literature applying decision trees and other algorithms to injury severity prediction. The document proposes a method to calculate minimum support and automatically extract strong association rules from accident data to predict patterns and promote applications in intelligent transportation systems.
ROAD SAFETY BY DETECTING DROWSINESS AND ACCIDENT USING MACHINE LEARNINGIRJET Journal
This document describes a proposed system to detect road accidents and driver drowsiness using machine learning. The system has two modules: 1) A driver drowsiness detection system that monitors the driver's face using a camera and detects drowsiness by analyzing eye blinking and facial expressions. 2) An accident detection system that monitors the road using a dash camera and uses a CNN model to analyze video frames and detect accidents. If an accident is detected, emergency services will be alerted by SMS with the location. The goal is to reduce highway accidents by alerting drowsy drivers and reducing emergency response times.
Analyzing the role of Highway & their Maintenance A case studyIRJET Journal
This document analyzes the role of highways and their maintenance through a case study. It begins by examining the importance of highways in facilitating transportation and economic growth. It then explores factors that influence highway performance like traffic and weather. The document also investigates key maintenance activities and challenges in highway upkeep like funding. It emphasizes the significance of effective maintenance for ensuring highway safety and longevity. The analysis provides insights for transportation stakeholders involved in managing highway infrastructure.
IRJET- Vehicle Control with Advanced Tyre MonitoringIRJET Journal
The document proposes a system to monitor vehicle tyres in real-time using sensors to measure parameters like speed, pressure, slip angle, and vertical load in order to estimate the lateral friction coefficient and provide alerts if thresholds are exceeded to help prevent accidents. It reviews related literature on tyre monitoring and describes the proposed methodology using an Arduino microcontroller to process sensor data and display outputs on an LCD or activate an alarm. The goal is to develop a low-cost reliable solution to increase safety by monitoring tyre conditions and friction in real-time.
A survey paper on Optimal Solution on Vehicular Adhoc Network for Congestion ...IRJET Journal
This document summarizes a survey paper on optimal solutions for congestion control in vehicular ad hoc networks (VANETs). It discusses how increasing numbers of connected vehicles can lead to more network congestion, higher error rates, and increased risks of accidents. The paper reviews existing approaches for congestion detection and control in VANETs, including algorithms that detect congested areas based on vehicle speed and density. It also discusses routing protocols and how distributed methods can enable vehicles to quantify congestion levels without relying on infrastructure. The document concludes that an effective congestion control solution in VANETs requires integrating both congestion detection and traffic management functionalities.
The Building Blocks of QuestDB, a Time Series Databasejavier ramirez
Talk Delivered at Valencia Codes Meetup 2024-06.
Traditionally, databases have treated timestamps just as another data type. However, when performing real-time analytics, timestamps should be first class citizens and we need rich time semantics to get the most out of our data. We also need to deal with ever growing datasets while keeping performant, which is as fun as it sounds.
It is no wonder time-series databases are now more popular than ever before. Join me in this session to learn about the internal architecture and building blocks of QuestDB, an open source time-series database designed for speed. We will also review a history of some of the changes we have gone over the past two years to deal with late and unordered data, non-blocking writes, read-replicas, or faster batch ingestion.
Analysis insight about a Flyball dog competition team's performanceroli9797
Insight of my analysis about a Flyball dog competition team's last year performance. Find more: https://github.com/rolandnagy-ds/flyball_race_analysis/tree/main
End-to-end pipeline agility - Berlin Buzzwords 2024Lars Albertsson
We describe how we achieve high change agility in data engineering by eliminating the fear of breaking downstream data pipelines through end-to-end pipeline testing, and by using schema metaprogramming to safely eliminate boilerplate involved in changes that affect whole pipelines.
A quick poll on agility in changing pipelines from end to end indicated a huge span in capabilities. For the question "How long time does it take for all downstream pipelines to be adapted to an upstream change," the median response was 6 months, but some respondents could do it in less than a day. When quantitative data engineering differences between the best and worst are measured, the span is often 100x-1000x, sometimes even more.
A long time ago, we suffered at Spotify from fear of changing pipelines due to not knowing what the impact might be downstream. We made plans for a technical solution to test pipelines end-to-end to mitigate that fear, but the effort failed for cultural reasons. We eventually solved this challenge, but in a different context. In this presentation we will describe how we test full pipelines effectively by manipulating workflow orchestration, which enables us to make changes in pipelines without fear of breaking downstream.
Making schema changes that affect many jobs also involves a lot of toil and boilerplate. Using schema-on-read mitigates some of it, but has drawbacks since it makes it more difficult to detect errors early. We will describe how we have rejected this tradeoff by applying schema metaprogramming, eliminating boilerplate but keeping the protection of static typing, thereby further improving agility to quickly modify data pipelines without fear.
Beyond the Basics of A/B Tests: Highly Innovative Experimentation Tactics You...Aggregage
This webinar will explore cutting-edge, less familiar but powerful experimentation methodologies which address well-known limitations of standard A/B Testing. Designed for data and product leaders, this session aims to inspire the embrace of innovative approaches and provide insights into the frontiers of experimentation!
Predictably Improve Your B2B Tech Company's Performance by Leveraging DataKiwi Creative
Harness the power of AI-backed reports, benchmarking and data analysis to predict trends and detect anomalies in your marketing efforts.
Peter Caputa, CEO at Databox, reveals how you can discover the strategies and tools to increase your growth rate (and margins!).
From metrics to track to data habits to pick up, enhance your reporting for powerful insights to improve your B2B tech company's marketing.
- - -
This is the webinar recording from the June 2024 HubSpot User Group (HUG) for B2B Technology USA.
Watch the video recording at https://youtu.be/5vjwGfPN9lw
Sign up for future HUG events at https://events.hubspot.com/b2b-technology-usa/
Learn SQL from basic queries to Advance queriesmanishkhaire30
Dive into the world of data analysis with our comprehensive guide on mastering SQL! This presentation offers a practical approach to learning SQL, focusing on real-world applications and hands-on practice. Whether you're a beginner or looking to sharpen your skills, this guide provides the tools you need to extract, analyze, and interpret data effectively.
Key Highlights:
Foundations of SQL: Understand the basics of SQL, including data retrieval, filtering, and aggregation.
Advanced Queries: Learn to craft complex queries to uncover deep insights from your data.
Data Trends and Patterns: Discover how to identify and interpret trends and patterns in your datasets.
Practical Examples: Follow step-by-step examples to apply SQL techniques in real-world scenarios.
Actionable Insights: Gain the skills to derive actionable insights that drive informed decision-making.
Join us on this journey to enhance your data analysis capabilities and unlock the full potential of SQL. Perfect for data enthusiasts, analysts, and anyone eager to harness the power of data!
#DataAnalysis #SQL #LearningSQL #DataInsights #DataScience #Analytics
Global Situational Awareness of A.I. and where its headedvikram sood
You can see the future first in San Francisco.
Over the past year, the talk of the town has shifted from $10 billion compute clusters to $100 billion clusters to trillion-dollar clusters. Every six months another zero is added to the boardroom plans. Behind the scenes, there’s a fierce scramble to secure every power contract still available for the rest of the decade, every voltage transformer that can possibly be procured. American big business is gearing up to pour trillions of dollars into a long-unseen mobilization of American industrial might. By the end of the decade, American electricity production will have grown tens of percent; from the shale fields of Pennsylvania to the solar farms of Nevada, hundreds of millions of GPUs will hum.
The AGI race has begun. We are building machines that can think and reason. By 2025/26, these machines will outpace college graduates. By the end of the decade, they will be smarter than you or I; we will have superintelligence, in the true sense of the word. Along the way, national security forces not seen in half a century will be un-leashed, and before long, The Project will be on. If we’re lucky, we’ll be in an all-out race with the CCP; if we’re unlucky, an all-out war.
Everyone is now talking about AI, but few have the faintest glimmer of what is about to hit them. Nvidia analysts still think 2024 might be close to the peak. Mainstream pundits are stuck on the wilful blindness of “it’s just predicting the next word”. They see only hype and business-as-usual; at most they entertain another internet-scale technological change.
Before long, the world will wake up. But right now, there are perhaps a few hundred people, most of them in San Francisco and the AI labs, that have situational awareness. Through whatever peculiar forces of fate, I have found myself amongst them. A few years ago, these people were derided as crazy—but they trusted the trendlines, which allowed them to correctly predict the AI advances of the past few years. Whether these people are also right about the next few years remains to be seen. But these are very smart people—the smartest people I have ever met—and they are the ones building this technology. Perhaps they will be an odd footnote in history, or perhaps they will go down in history like Szilard and Oppenheimer and Teller. If they are seeing the future even close to correctly, we are in for a wild ride.
Let me tell you what we see.
STATATHON: Unleashing the Power of Statistics in a 48-Hour Knowledge Extravag...sameer shah
"Join us for STATATHON, a dynamic 2-day event dedicated to exploring statistical knowledge and its real-world applications. From theory to practice, participants engage in intensive learning sessions, workshops, and challenges, fostering a deeper understanding of statistical methodologies and their significance in various fields."
STATATHON: Unleashing the Power of Statistics in a 48-Hour Knowledge Extravag...
Accident prediction models
1. SIXTH FRAMEWORK PROGRAMME
PRIORITY 1.6. Sustainable Development, Global Change
and Ecosystem
1.6.2: Sustainable Surface Transport
506184
Accident Prediction Models and Road Safety Impact
Assessment: recommendations for using these tools
Workpackage Title Road Safety Impact Assessment
Workpackage No. WP2 Deliverable No. D2
Authors (per company, if more than
one company provide it together)
Rob Eenink, Martine Reurings (SWOV), Rune
Elvik (TOI), João Cardoso, Sofia Wichert
(LNEC), Christian Stefan (KfV)
Status Final
File Name: RIPCORD-ISEREST-Deliverable-D2.doc
Project start date and duration 01 January 2005, 36 Months
2. Deliverable D2 Public Contract N. 506184
14.02.2008 - 2 - SWOV
List of abbreviations
AADT Average Annual Daily Traffic
ACC amount of accidents
AMF Accident modification factor
APM Accident Prediction Model
DST Decision support tool
GIS Geographic information system
PHGV Percentage of Heavy Goods Vehicles
RIA Road safety Impact Assessment
RIPCORD-ISEREST Road infrastructure safety protection – core-research and
development for road safety in Europe; Increasing safety
and reliability of secondary roads for a sustainable surface
transport
RRSE Regional road safety explorer
SEROES Secondary roads expert system
3. Deliverable D2 Public Contract N. 506184
14.02.2008 - 3 - SWOV
Table of Contents
List of abbreviations ................................................................................................ 2
Executive Summary ................................................................................................. 4
1. Introduction........................................................................................................... 5
1.1 Ripcord-Iserest ...............................................................................................................5
1.2 Workpackage 2: Accident Prediction Models and Road safety Impact Assessment......5
2. Accident Prediction Models and Road safety Impact Assessments................ 7
2.1 Introduction.....................................................................................................................7
2.2 Accident Prediction Models ............................................................................................7
2.2.1 Results of the state-of-the-art study.........................................................................7
2.2.2 Results of the pilots..................................................................................................8
2.2.2 Comparison of state-of-the-art and pilot studies ....................................................10
2.3 Road safety Impact Assessment ..................................................................................10
2.3.1 Results of the state-of-the-art study.......................................................................10
2.3.2 Results of the pilots................................................................................................11
3. Accident Prediction Models: User needs and recommendations .................. 14
3.1 Safety level of existing roads........................................................................................14
3.2 Explanatory variables ...................................................................................................14
3.3 Recommendations........................................................................................................15
4. Road safety Impact Assessment: User needs and recommendations .......... 16
4.1 Network safety policy....................................................................................................16
4.2 Impact of safety plans...................................................................................................16
4.3 Recommendations........................................................................................................17
Conclusions............................................................................................................ 18
References .............................................................................................................. 20
4. Deliverable D2 Public Contract N. 506184
14.02.2008 - 4 - SWOV
Executive Summary
In 2001 the European Commission defined the ambitious objective in their Road
Safety Policy to halve the number of fatalities in EU15 from over 40,000 to 20,000 in
2010. Road infrastructure related safety measures offer a large potential that could
be exploited for a significant reduction of road accidents and their consequences.
Considering that most casualties occur on single carriageway rural roads, RIPCORD-
ISEREST is focussed on road infrastructure measures for this type of roads. The
objective of this project is to collect and to evaluate these approaches in order to
make them accessible throughout Europe and to develop tools, which could be used
to improve traffic safety.
In order to manage road safety, practitioners such as policy makers and road
authorities need to have a good insight in the safety level of their roads, the variables
that explain these levels and the expected effects of their road safety plans. In work
package 2 (WP 2) of RipCord-Iserest two instruments have been researched, both
intended to provide this insight: Accident Prediction Models (APM) and Road safety
Impact Assessments (RIA). An Accident Prediction Model is a mathematical formula
describing the relation between the safety level of existing roads (i.e. crashes,
victims, injured, fatalities etc.) and variables that explain this level (road length, width,
traffic volume etc.). A Road safety Impact Assessment is a methodology to assess
the impact of plans on safety. This can be major road works, a new bridge etc. that
may or may not be intended to raise the safety level. A RIA can also concern a wider
scheme i.e. be intended to make plans for the upgrading the safety level of a total
network or area. This report gives recommendations for the way in which these
instruments can be used by practitioners. It is based on two earlier published reports
regarding the state-of-the art on APMs and RIAs, and the results of pilot studies. Both
are available at the RipCord-Iserest website (www.ripcord-iserest.com; see section
References).
Traffic volumes (vehicles per day) and road lengths (km) are the most important
explanatory variables in an APM, both for road sections and intersections. The
parameters of the model, however, can vary considerably between road types and
countries. The reason is that road characteristics can differ considerably and so can
road user behaviour, vehicle types etc. It is therefore recommended to make APMs
per country and road type and use these to compare the safety level of a road
against the value of the APM for the road type and traffic volume under
consideration. APMs can thus also play an important role in identifying black spots.
For a RIA on single (major) road works several methods are available. It is best to
use as much scientific evidence as possible, using handbooks, cost-benefit analyses
and taking into account network effects. For RIAs on wider schemes or even national
levels specific recommendations are given on methodology. In general a RIA is best
used in comparing policy options and setting ambitious but realistic road safety
targets. Absolute numbers that are predicted are usually not very reliable and in
general highly dependant on high quality databases that are usually not available.
5. Deliverable D2 Public Contract N. 506184
14.02.2008 - 5 - SWOV
1. Introduction
1.1 Ripcord-Iserest
In 2001 the European Commission defined the ambitious objective in their Road
Safety Policy to halve the number of fatalities in EU15 from over 40,000 to 20,000 in
2010.
To reach the objective the improvement or implementation of a great variety of safety
measures is still urgent. Beside ongoing development processes in the field of car
safety (e.g. Human-Machine-Interface, driver assistance) there is also the need to
exhaust the reduction potentials of road infrastructure safety measures.
Road infrastructure related safety measures offer a large potential that could be
exploited for a significant reduction of road accidents and their consequences.
Considering that most casualties occur on single carriageway rural roads, RIPCORD-
ISEREST is focussed on road infrastructure measures for this type of roads.
Researchers and practitioners in the member states of the European Union have
made great efforts to improve traffic safety. Many of these approaches have already
led to a significant reduction in fatalities.
The objective of this project is to collect and to evaluate these approaches in order to
make them accessible throughout Europe and to develop tools, which could be used
to improve traffic safety.
With these tools RIPCORD-ISEREST intends to give scientific support to
practitioners concerned with road design and traffic safety in Europe.
1.2 Workpackage 2: Accident Prediction Models and Road safety
Impact Assessment
In order to manage road safety, practitioners such as policy makers and road
authorities need to have a good insight in the safety level of their roads, the variables
that explain these levels and the expected effects of their road safety plans. In work
package 2 (WP 2) of RipCord-Iserest two instruments have been researched, both
intended to provide this insight: Accident Prediction Models (APM) and Road safety
Impact Assessments (RIA). This report gives recommendations for the way in which
these instruments can be used by practitioners. It is based on two earlier published
reports regarding the state-of-the art on APMs and RIAs, and the results of pilot
studies. Both are available at the RipCord-Iserest website (www.ripcord-iserest.com;
see references)
An Accident Prediction Model is a mathematical formula describing the relation
between the safety level of existing roads (i.e. crashes, victims, injured, fatalities etc.)
and variables that explain this level (road length, width, traffic volume etc.). A Road
safety Impact Assessment is a methodology to assess the impact of plans on safety.
This can be major road works, a new bridge etc. that may or may not be intended to
6. Deliverable D2 Public Contract N. 506184
14.02.2008 - 6 - SWOV
raise the safety level. A RIA can also concern a wider scheme i.e. be intended to
make plans for the upgrading the safety level of a total network or area. The first type
of RIA is not researched in detail in WP2, the second type is, and is also dealt with in
WP 11 as a decision support system (DST, [11]) that is demonstrated in WP12 along
with the Best practise Safety Information Expert System SEROES (WP 9 [12]). In
chapter 2 more information on APMs and RIAs is given.
All partners in WP2 are very experienced regarding the road safety situation in their
countries, that is in Austria, Portugal, Norway and the Netherlands. This is also the
case for other RipCord-Iserest partners in their countries; therefore a good insight in
the needs of practitioners is at hand within the consortium. The ideas on user needs
have also been discussed with practitioners at the 1st
Ripcord-Iserest Conference in
September 2006. User needs are the topic of chapter 3.
In chapter 4 the features of APMs and RIAs are held against the user needs to see
what possibilities there are to meet these needs. Recommendations are given on the
use of both instruments by practitioners.
7. Deliverable D2 Public Contract N. 506184
14.02.2008 - 7 - SWOV
2. Accident Prediction Models and Road safety
Impact Assessments
2.1 Introduction
In this chapter APMs and RIAs are dealt with in more detail. WP2 started with a
state-of-the-art study on both instruments, the results of which can be found in 2.2.1
and 2.3.1. Consequently a choice was made for pilot studies in all participating
countries that had to be based on availability of data and –related to that- interest of
road authorities. For APMs this resulted in a good coverage of road categories,
motorways (Portugal, Austria) and distributor (rural and urban) roads (Netherlands
and, partially, Portugal). For RIAs a pilot in Norway was performed on national road
safety plans. On a smaller scale an instrument that was originally developed in the
Netherlands is tested in WP11. Unfortunately, the sort of RIA that is used in single
projects (bridge, major road works, new road etc.) is not tested in a pilot study.
However, this type of RIA is well-known in most countries albeit in different forms.
Therefore, a discussion on pros and cons of different approaches is considered
valuable.
2.2 Accident Prediction Models
2.2.1 Results of the state-of-the-art study
The basic form of nearly all modern accident prediction models is this:
E(λ) = .MIMA
∑ ii x
eQQ
γββ
α
The estimated expected number of accidents, E(λ), is a function of traffic volume, Q,
and a set of risk factors, xi (i = 1, 2, 3, …, n). The effect of traffic volume on accidents
is modelled in terms of an elasticity, that is a power, β, to which traffic volume is
raised. For intersections volumes for the major and minor road are included. The
effects of various risk factors that influence the probability of accidents, given
exposure, is generally modelled as an exponential function, that is as e (the base of
natural logarithms) raised to a sum of the product of coefficients, γi, and values of the
variables, xi, denoting risk factors.
The volume and risk factors are the explanatory variables of the model and, ideally
speaking, the choice of explanatory variables to be included in an accident prediction
model ought to be based on theory. However, the usual basis for choosing
explanatory variables appears to be simply data availability. They should include
variables that:
• have been found in previous studies to exert a major influence on the number
of accidents;
• can be measured in a valid and reliable way;
• are not very highly correlated with other explanatory variables included.
8. Deliverable D2 Public Contract N. 506184
14.02.2008 - 8 - SWOV
Rural road sections
Not surprisingly, the Annual Average Daily Traffic (AADT) and section length are
used as explanatory variables in almost all models. Also the minor access density,
the carriageway width and the shoulder width are used in various models.
Rural intersections
As expected, the AADT on the major and minor roads are used as explanatory
variables in all models. Also, the presence of left and right-turn lanes on the major
roads are used in several models.
Urban road sections
Any accident prediction model should preferably include next to the AADT and section
length, the public street access (and driveway) density as explanatory variables.
Urban intersections
In most papers separate models were developed for intersections with three arms
and intersections with four arms and/or for different types of control (STOP,
signalised, major/minor priority, roundabouts). This is desirable, because it was found
that separate models for different intersection types give a better description of the
data than one model for all intersections together, which includes the intersection
type as an explanatory discrete variable.
2.2.2 Results of the pilots
For motorways in Austria and Portugal and for urban and rural roads in the
Netherlands four, APMs were found. To compare them they are given as expected
values of accidents per km road in 5 years and restricted to max. 3 decimals:
Austria Motorways PHGV
LengthAADTACC 99.0104.2 89.005.14
××××= −
Portugal Motorways 93.092.04
107.6 LengthAADTACC ×××= −
Netherlands Urban 0.132.0
55.0 LengthAADTACC ××=
Netherlands Rural 96.050.0
047.0 LengthAADTACC ××=
Where ACC = accidents (units)
AADT = Average Annual Daily Traffic (vehicles per day)
Length = lengths of the section considered (km)
PHGV = percentage of heavy goods vehicles
At first glance Portuguese motorways seem to have a much greater risk than
Austrian motorways because of the much higher intercept (6.7× 4
10−
and 2.4× 4
10−
).
The best way to compare them is in a plot of ACC density (ACC per km) against
AADT:
9. Deliverable D2 Public Contract N. 506184
14.02.2008 - 9 - SWOV
0
2
4
6
8
10
12
14
16
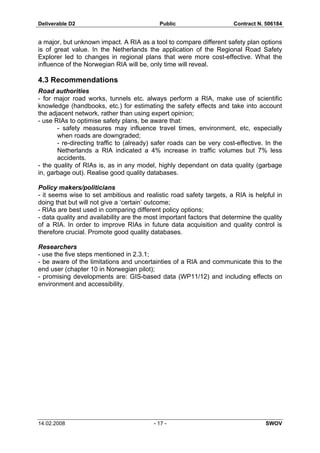
0 5000 10000 15000 20000 25000 30000 35000 40000
AADT
Accidentsperkilometreinfiveyears
Netherlands Urban
Netherlands Rural
Austria Motorways
Portugal Motorways
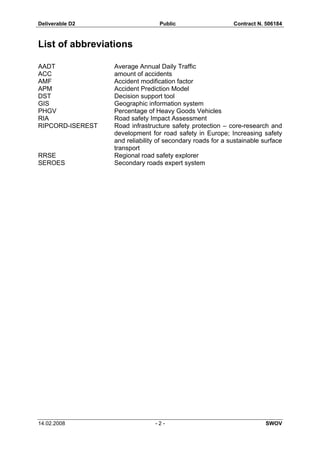
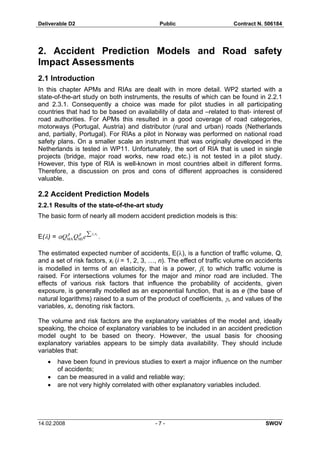
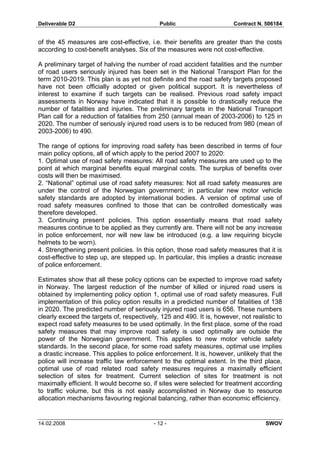
Note that the range of AADT is different for different APMs.
For a typical AADT of 15000, segment length of 5 km and PHGV of 10% the
outcomes are for Austria ACC= 22.1 (4.4 accidents per km) and for Portugal
ACC = 20.8 (4.2 accidents per km). These are quite comparable. With regards to the
direction of change it is understandable that a longer road segment is safer per km
because you expect more homogeneity in traffic flow. In the Austrian model,
however, it seems surprisingly that risk (ACC/(AADT.km)) increases when the AADT
increases. In most literature the opposite is reported as indeed is the case in the
Portuguese model. In the Austrian model, however, an extra explanatory variable, the
percentage of heavy goods vehicles, is included, and this may explain these effects.
A brief comparison to the Dutch situation (see [7]) shows that in the Netherlands the
accident density is comparable to the Austrian and Portuguese level, but at
approximately the double AADT, indicating that risk is much lower at high traffic
volumes on motorways.
The AADT for urban (3000 – 40000) and rural roads (3000 – 25000) in the vicinity of
The Hague seems to be rather comparable to motorways in Austria and Portugal.
The city of The Hague has almost 500000 inhabitants and some of the urban roads
have 2 or 3 lanes per direction. The influence of segment length is low and for urban
segments negligible. For an AADT of 15000 the accident density (ACC/km) in 5 years
is for urban roads: 11.9 and for rural roads 5.4. At low volumes (AADT of 3000) the
accident densities are: Austria 0.8, Portugal 0.9, Netherlands urban 7.1 and
Netherlands rural 2.4. The corresponding risks (ACC/(AADT.km)) are therefore much
higher for rural and especially urban roads. This is what you would expect, not
because traffic in itself is much safer at high volumes at rural and especially urban
roads, but because road design is adjusted to (expected) high or low volumes. Of
course, one would like to know the effects of different road elements but the data do
not allow incorporating many explanatory variables, such as road design elements.
10. Deliverable D2 Public Contract N. 506184
14.02.2008 - 10 - SWOV
2.2.2 Comparison of state-of-the-art and pilot studies
In all pilots the general form of APM that was found in the state-of-the-art study was
used. Unfortunately not enough good quality data were available for applying many
explanatory variables and this was an important reason why not all quality criteria
could be met and not all preferred variables could be incorporated in the APMs.
Nevertheless, the analyses are considered to be of good quality, albeit this being a
judgement by the researchers and their international colleagues themselves.
The literature study showed that the APM outcomes were rather different in different
regions or countries. In our case, the APMs for the same category of roads
(motorways) in Austria and Portugal are rather comparable. This could of course be a
coincidence, but might also be the result of using comparable ways of working.
2.3 Road safety Impact Assessment
2.3.1 Results of the state-of-the-art study
A first type of RIA is used for (major) road works, a new bridge, tunnel, etc. This is
performed in many countries and in many ways. This is not a topic dealt with much
detail in the (scientific) literature, the information in WP2 is gathered from RipCord-
Iserest partners and a study from BASt (Höhnscheid, 2003).
Four ways of assessing the impact can be identified:
1. Expert opinion
This is a qualitative assessment by experts who can, for instance score each relevant
safety aspect negative, neutral or positive. This is easy to apply and will guarantee an
outcome but its validity and reliability are questionable.
2. Handbooks
The effects of road safety measures are estimated using (inter)national handbooks.
In general these are science based but have large confidence intervals, that means
that the expected effects depend highly on the specific situation.
3. Including (local) network
Next to the expected effects from method 2., effects on the adjacent network are
considered. Usually this is done by modelling (changes in) traffic volumes and
applying (local, national) risk factors per road type. The effects on the adjacent
network can be quite relevant and therefore this is a better but more costly method.
4. Cost benefit analysis
This can be part of methods 1-3 or done in a more vigorous way by taking into
account the effects on the environment, accessibility, spatial planning, etc. This could
be disadvantageous when applied to road safety measures that have an adverse
effect on environment or accessibility.
The second type of RIA is used on a network or area level. This is more common in
the (scientific) literature, though not as well represented as APMs. In general five
steps can be identified:
1. Baseline situation
11. Deliverable D2 Public Contract N. 506184
14.02.2008 - 11 - SWOV
This describes the current situation (year 0), with respect to traffic volumes and
accidents per road type (and from this: risk factors per road type)
2. Future situation without measures
In most plans the function of roads will be changed, for instance by introducing 30
km/h-zones in residential area’s, upgrading or downgrading distributor roads etc. This
will result in re-directing traffic. This step also includes traffic growth.
3. Applying road safety measures
Per road type and road user group the effects of measures are assessed.
4. Cost-Benefit Analysis
This step consists of a monetary valuation of (safety) impacts which is related to the
costs of the measures.
5. Optimisation
In this stage the plans (road function, measures) are changed in order to reach the
optimal safety effect or the best cost/benefit ratio.
On a national level sufficient data may be available to use this method (see 2.3.2 for
Norway), but on a local or regional level this is unlikely. Therefore a combination of
additional data acquisition, modelling and assessments is required, although that can
be quite costly, though probably negligible when compared to the costs of the safety
plans and the benefit of applying the method. In the Netherlands the Regional Road
Safety Explorer (RRSE) was used by 19 regions because a substantial subsidy was
foreseen. This resulted in plans that would have delivered the required improvements
for the available budgets, according to the RIA in the RRSE. These plans were
optimised with the aid of the RRSE, that is, initially they were different. The
instrument was modified by Mobycon and is used in WP11 Decision Support Tool,
and WP12 Demonstration of RipCord-Iserest. More information can be found in D11
and D12 of RipCord-Iserest.
2.3.2 Results of the pilots
A road safety impact assessment for Norway, designed to assess the prospects for
improving road safety, was made. The study is to a large extent based on work done
as part of the development of the National Transport Plan for the 2010-2019 planning
term.
A broad survey of potentially effective road safety measures has been performed. A
total of 139 road safety measures were surveyed; 45 of these were included in a
formal impact assessment, which also included cost-benefit analyses. The other 94
road safety measures were for various reasons not included in the impact
assessment. Reasons for exclusion include: (1) Effects of the measure are unknown
or too poorly known to support a formal impact assessment; (2) The measure does
not improve road safety; (3) The measure has been fully implemented in Norway; (4)
The measure overlaps another measure; to prevent double counting, only one
measure was included; (5) The measure is analytically intractable.
For the 45 road safety measures included in the impact assessment, use of these
measures during the period until 2020 was considered. Analyses indicate that 39 out
12. Deliverable D2 Public Contract N. 506184
14.02.2008 - 12 - SWOV
of the 45 measures are cost-effective, i.e. their benefits are greater than the costs
according to cost-benefit analyses. Six of the measures were not cost-effective.
A preliminary target of halving the number of road accident fatalities and the number
of road users seriously injured has been set in the National Transport Plan for the
term 2010-2019. This plan is as yet not definite and the road safety targets proposed
have not been officially adopted or given political support. It is nevertheless of
interest to examine if such targets can be realised. Previous road safety impact
assessments in Norway have indicated that it is possible to drastically reduce the
number of fatalities and injuries. The preliminary targets in the National Transport
Plan call for a reduction of fatalities from 250 (annual mean of 2003-2006) to 125 in
2020. The number of seriously injured road users is to be reduced from 980 (mean of
2003-2006) to 490.
The range of options for improving road safety has been described in terms of four
main policy options, all of which apply to the period 2007 to 2020:
1. Optimal use of road safety measures: All road safety measures are used up to the
point at which marginal benefits equal marginal costs. The surplus of benefits over
costs will then be maximised.
2. “National” optimal use of road safety measures: Not all road safety measures are
under the control of the Norwegian government; in particular new motor vehicle
safety standards are adopted by international bodies. A version of optimal use of
road safety measures confined to those that can be controlled domestically was
therefore developed.
3. Continuing present policies. This option essentially means that road safety
measures continue to be applied as they currently are. There will not be any increase
in police enforcement, nor will new law be introduced (e.g. a law requiring bicycle
helmets to be worn).
4. Strengthening present policies. In this option, those road safety measures that it is
cost-effective to step up, are stepped up. In particular, this implies a drastic increase
of police enforcement.
Estimates show that all these policy options can be expected to improve road safety
in Norway. The largest reduction of the number of killed or injured road users is
obtained by implementing policy option 1, optimal use of road safety measures. Full
implementation of this policy option results in a predicted number of fatalities of 138
in 2020. The predicted number of seriously injured road users is 656. These numbers
clearly exceed the targets of, respectively, 125 and 490. It is, however, not realistic to
expect road safety measures to be used optimally. In the first place, some of the road
safety measures that may improve road safety is used optimally are outside the
power of the Norwegian government. This applies to new motor vehicle safety
standards. In the second place, for some road safety measures, optimal use implies
a drastic increase. This applies to police enforcement. It is, however, unlikely that the
police will increase traffic law enforcement to the optimal extent. In the third place,
optimal use of road related road safety measures requires a maximally efficient
selection of sites for treatment. Current selection of sites for treatment is not
maximally efficient. It would become so, if sites were selected for treatment according
to traffic volume, but this is not easily accomplished in Norway due to resource
allocation mechanisms favouring regional balancing, rather than economic efficiency.
13. Deliverable D2 Public Contract N. 506184
14.02.2008 - 13 - SWOV
A more realistic policy is therefore that road safety measures continue to be used
along roughly the same lines as they are today. Such a policy will not bring about
large improvements in road safety in Norway. A conservative estimate for the number
of road accident fatalities in 2020 is about 200. A corresponding estimate for
seriously injured road users is about 850. While both these numbers are lower than
the current numbers, they are a long way from realising the targets set for 2020 (125
road users killed, 490 seriously injured).
It should be stressed that the estimates presented in this report are highly uncertain.
It would therefore not be surprising if actual development turns out to be different
from the one estimated.
14. Deliverable D2 Public Contract N. 506184
14.02.2008 - 14 - SWOV
3. Accident Prediction Models: User needs and
recommendations
3.1 Safety level of existing roads
It is safe to say that practitioners (road authorities, policy makers, their consultants)
are interested in improving road safety and taking measures that will decrease the
number of accidents on (their) roads. Therefore they want to know what the expected
numbers of accidents will be in the future. It is also likely that they are interested in
measures that can prevent large numbers of accidents at low costs.
With an APM one estimates the expected number of accidents on a road (type) as a
function of traffic volume and a set of risk factors. The work in WP2 has given the
following insights:
- developing an APM is not an easy task, probably not suited for road authorities with
the possible exception of the national level;
- a good and detailed APM requires much data of good quality and detail that is
usually not available;
- as a result only a few explanatory variables (risk factors) are included;
- APM can be quite different for the same road type in different countries.
It is recommended that on a national level basic APMs are developed for several
road types, depending on the national situation. Basic means that no risk factors are
included, only the traffic volume is used. In general the accident numbers will be
higher at increasing volumes, but the accident rate will drop. If there are more
differences in design within the considered road type, then this effect of decreasing
accident rate is stronger (see 2.2.2).
These APMs could be used to benchmark one’s roads. If the expected amount of
accidents is significantly lower than what is measured in reality, it is likely that there
are some flaws in road design. This approach is important in selecting cost effective
measures that have apparently been applied on other roads of the same type. It will
not necessarily lead to high numbers of prevented accidents because one may select
roads with low traffic volumes and, subsequently, low accident numbers, although
(much) higher than is usual for this road type. This can easily be overcome by only
considering roads with a medium to high traffic volume.
3.2 Explanatory variables
Knowing that a road as a high accident rate is one thing, knowing what the reason is
for this and being able to tackle it, is another. To this end explanatory variables or
accident modification factors (AMF) should be added. This requires many, good
quality data that are usually not available. There are few good examples of APMs
including explanatory variables or AMF’s. If, however they are (or would be)
available, they may give a pretty good hint as to where the safety problem lies.
Though not explicitly researched in WP2 a few recommendations can be given. If
there are high numbers of accidents, analyses that are commonly used for Black
Spot Management (see WP6) are possible. This may lead to the identification of
specific types of accidents or certain accident patterns that could be tackled by
15. Deliverable D2 Public Contract N. 506184
14.02.2008 - 15 - SWOV
measures that have proven to be effective in preventing these accident types.
Another method is comparing the road design to the requirements of current national
or international standards that are available for this road type.
3.3 Recommendations
Road authorities
- command or give assignments to research organisations to develop basic APMs for
relevant road types;
- implement road databases including at least data on traffic volumes, roadside
treatment, median treatment, intersection types;
- select road (types) based on amount of accidents (or traffic volume) and accident
risk, using APMs.
Policy makers/Politicians
- allow road authorities to select sites for treatment according to the criteria
mentioned above.
Researchers
- make basic APMs for 3-5 road types and preferably also intersections on these road
types, using the methods recommended in the state-of-the-art report, that is:
- basic form: E(λ) = .MIMA
ββ
α QQ
- use Generalised Linear Modelling.
- assume a Negative Binomial distribution.
In general: take account of the recommendations in chapter 2 of the state-of-the-art
report, and follow the criteria proposed for assessing the quality of fitted APMs.
- if the data allow it: expand the basic APM with AMF’s and or add explanatory
variables.
16. Deliverable D2 Public Contract N. 506184
14.02.2008 - 16 - SWOV
4. Road safety Impact Assessment: User needs and
recommendations
4.1 Network safety policy
Road safety policy is, by definition, up to politicians, aided by policy makers and road
authorities. In many countries road safety targets are set for a period of 5, 10 or 20
years. With regards to what a RIA could possibly do, some user needs or questions
seem relevant:
- are these targets ambitious?
- are they realistic?
- are there more (cost-)effective options?
- what is the impact on other issues, such as environment or accessibility?
- do social dilemma’s exist?
Road safety is only partly determined by (inter)national, regional or local road safety
policy. RIAs show that it is hard to tell which part can be influenced and what
external, or autonomous developments will be. Next to this chance plays a vital role,
if for instance, the amount of road fatalities drops from 1000 in one year to 970 in
another, this is no reason to assume that policy has anything to do with it. The same
is true, of course, if it would have gone up to 1030. One should always take an
average of a few years (3-5) and look at long(er) term trends. If such a trend would
point at a drop of 10% in road fatalities in 10 years, then setting a target of 5% is not
very ambitious, and a target of 50% is probably too ambitious. A RIA can give more
insight in what is realistic. The Norwegian pilot gives a good example of this. The
preliminary national target for 2020 is a maximum of 125, and the RIA indicates that
200 is a realistic target.
An important element of a RIA is the set of expected costs and benefits of (road
safety) measures that could or will be realised in the period under consideration. This
enables the user to optimise plans given a certain (road safety) budget. A RIA does
not (normally) incorporate relevant aspects such as public acceptance of measures,
social dilemma’s, and effects on other relevant policy issues like the environment or
travel times, though especially these last issues are dealt with in state-of-the-art
RIAs.
With regards to the RIA on major road works, tunnel etc. the situation is less difficult.
The user simply wants to know what the effects are (on safety) and the best way to
tackle this is using handbooks or literature for local effect estimates, and using
models and risk factors (APMs if available) for effects on the adjacent road network.
A cost-effectiveness analysis may be advisable if other policy issues are at stake as
well.
4.2 Impact of safety plans
As stated above, the actual road safety situation is not the exclusive outcome of road
safety policy. In the Norwegian pilot an attempt has been made to explain past trends
by developments in safety issues that are known to have a major influence. This was
unsuccessful, partly because safety measures are implemented gradually, 1000
roundabouts are not built overnight, partly because measures or developments have
17. Deliverable D2 Public Contract N. 506184
14.02.2008 - 17 - SWOV
a major, but unknown impact. A RIA as a tool to compare different safety plan options
is of great value. In the Netherlands the application of the Regional Road Safety
Explorer led to changes in regional plans that were more cost-effective. What the
influence of the Norwegian RIA will be, only time will reveal.
4.3 Recommendations
Road authorities
- for major road works, tunnels etc. always perform a RIA, make use of scientific
knowledge (handbooks, etc.) for estimating the safety effects and take into account
the adjacent network, rather than using expert opinion;
- use RIAs to optimise safety plans, be aware that:
- safety measures may influence travel times, environment, etc, especially
when roads are downgraded;
- re-directing traffic to (already) safer roads can be very cost-effective. In the
Netherlands a RIA indicated a 4% increase in traffic volumes but 7% less
accidents.
- the quality of RIAs is, as in any model, highly dependant on data quality (garbage
in, garbage out). Realise good quality databases.
Policy makers/politicians
- it seems wise to set ambitious and realistic road safety targets, a RIA is helpful in
doing that but will not give a ‘certain’ outcome;
- RIAs are best used in comparing different policy options;
- data quality and availability are the most important factors that determine the quality
of a RIA. In order to improve RIAs in future data acquisition and quality control is
therefore crucial. Promote good quality databases.
Researchers
- use the five steps mentioned in 2.3.1;
- be aware of the limitations and uncertainties of a RIA and communicate this to the
end user (chapter 10 in Norwegian pilot);
- promising developments are: GIS-based data (WP11/12) and including effects on
environment and accessibility.
18. Deliverable D2 Public Contract N. 506184
14.02.2008 - 18 - SWOV
Conclusions
The basic form of nearly all modern accident prediction models is this:
E(λ) = .MIMA
∑ ii x
eQQ
γββ
α
The estimated expected number of accidents, E(λ), is a function of traffic volume, Q,
and a set of risk factors, xi (i = 1, 2, 3, …, n). The effect of traffic volume on accidents
is modelled in terms of an elasticity, that is a power, β, to which traffic volume is
raised. For intersections volumes for the major and minor road are included. The
effects of various risk factors that influence the probability of accidents, given
exposure, is generally modelled as an exponential function, that is as e (the base of
natural logarithms) raised to a sum of the product of coefficients, γi, and values of the
variables, xi, denoting risk factors.
The volume and risk factors are the explanatory variables of the model and, ideally
speaking, the choice of explanatory variables to be included in an accident prediction
model ought to be based on theory. However, the usual basis for choosing
explanatory variables appears to be simply data availability. They should include
variables that:
• have been found in previous studies to exert a major influence on the number
of accidents;
• can be measured in a valid and reliable way;
• are not very highly correlated with other explanatory variables included.
The work in WP2 has given the following insights:
• developing an APM is not an easy task, probably not suited for road
authorities with the possible exception of the national level;
• a good and detailed APM requires much data of good quality and detail that is
usually not available;
• as a result only a few explanatory variables (risk factors) are included;
• APM can be quite different for the same road type in different countries.
It is recommended that on a national level basic APMs are developed for several
road types, depending on the national situation. Basic means that no risk factors are
included, only the traffic volume is used. In general the accident numbers will be
higher at increasing volumes, but the accident rate will drop. If there are more
differences in design within the considered road type, then this effect of decreasing
accident rate is stronger.
These APMs could be used to benchmark one’s roads. If the expected amount of
accidents is significantly lower than what is measured in reality, it is likely that there
are some flaws in road design. This approach is important in selecting cost effective
measures that have apparently been applied on other roads of the same type. It will
not necessarily lead to high numbers of prevented accidents because one may select
roads with low traffic volumes and, subsequently, low accident numbers, although
(much) higher than is usual for this road type. This can easily be overcome by only
considering roads with a medium to high traffic volume.
19. Deliverable D2 Public Contract N. 506184
14.02.2008 - 19 - SWOV
A first type of RIA is used for (major) road works, a new bridge, tunnel, etc. This is
performed in many countries and in many ways. This is not a topic dealt with much
detail in the (scientific) literature. Four ways of assessing the impact can be identified:
1. Expert opinion
2. Handbooks
3. Including (local) network
4. Cost benefit analysis
It is best to use as much scientific evidence as possible, using handbooks, cost-
benefit analyses and taking into account network effects.
The second type of RIA is used on a network or area level. This is more common in
the (scientific) literature, though not as well represented as APMs. In general five
steps can be identified:
1. Baseline situation
2. Future situation without measures
3. Applying road safety measures
4. Cost-Benefit Analysis
5. Optimisation
On a national level sufficient data may be available to use this method, but on a local
or regional level this is unlikely. Therefore a combination of additional data
acquisition, modelling and assessments is required, although that can be quite costly,
though probably negligible when compared to the costs of the safety plans and the
benefit of applying the method. In general a RIA is best used in comparing policy
options and setting ambitious but realistic road safety targets. Absolute numbers that
are predicted are usually not very reliable and in general highly dependant on high
quality databases that are usually not available.
20. Deliverable D2 Public Contract N. 506184
14.02.2008 - 20 - SWOV
References
[1] Commision of the European Communities Proposal for a Directive of the
European Parliament and of the Council on Road Infrastructure Safety Management
[SEC (2006) 1231/1232], Brussels 5 October 2006 COM(2006) 569 final
[2] Höhnscheid, K.-J. (2003). Road safety impact assessment. Bergisch Gladbach,
Bundesanstalt für Strassenwesen. [internal report]
[3] Reurings M., Janssen T., Eenink R., Elvik R., Cardoso J., Stefan C. Accident
Prediction Models and Road safety Impact Assessment: a state-of-the-art. RI-SWOV-
WP23-R1-V2-State-of-the-art.
[4] Stefan C. Predictive model of injury accidents on Austrian motorways. KfV. Vienna
July 2006
[5] Wichert S., Cardoso J. Accident Prediction Models for Portuguese Motorways.
LNEC, Lisbon July 2006
[6] Reurings M. Modelling the number of road accidentss using generalised linear
models. SWOV, Leidschendam July 2006
[7] Commandeur J., Bijleveld F., Braimaister L., Janssen T. De analyse van
ongeval-, weg-, en verkeerskenmerken van de Nederlandse rijkswegen. SWOV (R-
2002-19), Leidschendam, 2002
[8] RiPCORD-iSEREST ANNEX1-“Description of work” BASt, Bergisch Gladbach
January 20th
2004
[9] Wichert S., Cardoso J., Accident Prediction Models for Portuguese Single
Carriageway Roads. LNEC, Lisbon May 2007
[10] Eenink R., Reurings M. (SWOV), Elvik R. (TOI), Cardoso J., Wichert S. (LNEC),
Stefan C. (KfV), Accident Prediction Models and Roads safety Impact Assessment:
Result of the pilot studies. RI-SWOV-WP2-R4-V2-Results
[11] D11 RipCord-Iserest, www.ripcord-iserest.com (to be published soon)
[12] Mallschützke K. (INECO), Gatti G. (POLIBA), van der Leur M. (Mobycon), Best
Practise Safety Information Expert System, RI-INEC-WP9-D9-F-SEROES