Download to read offline

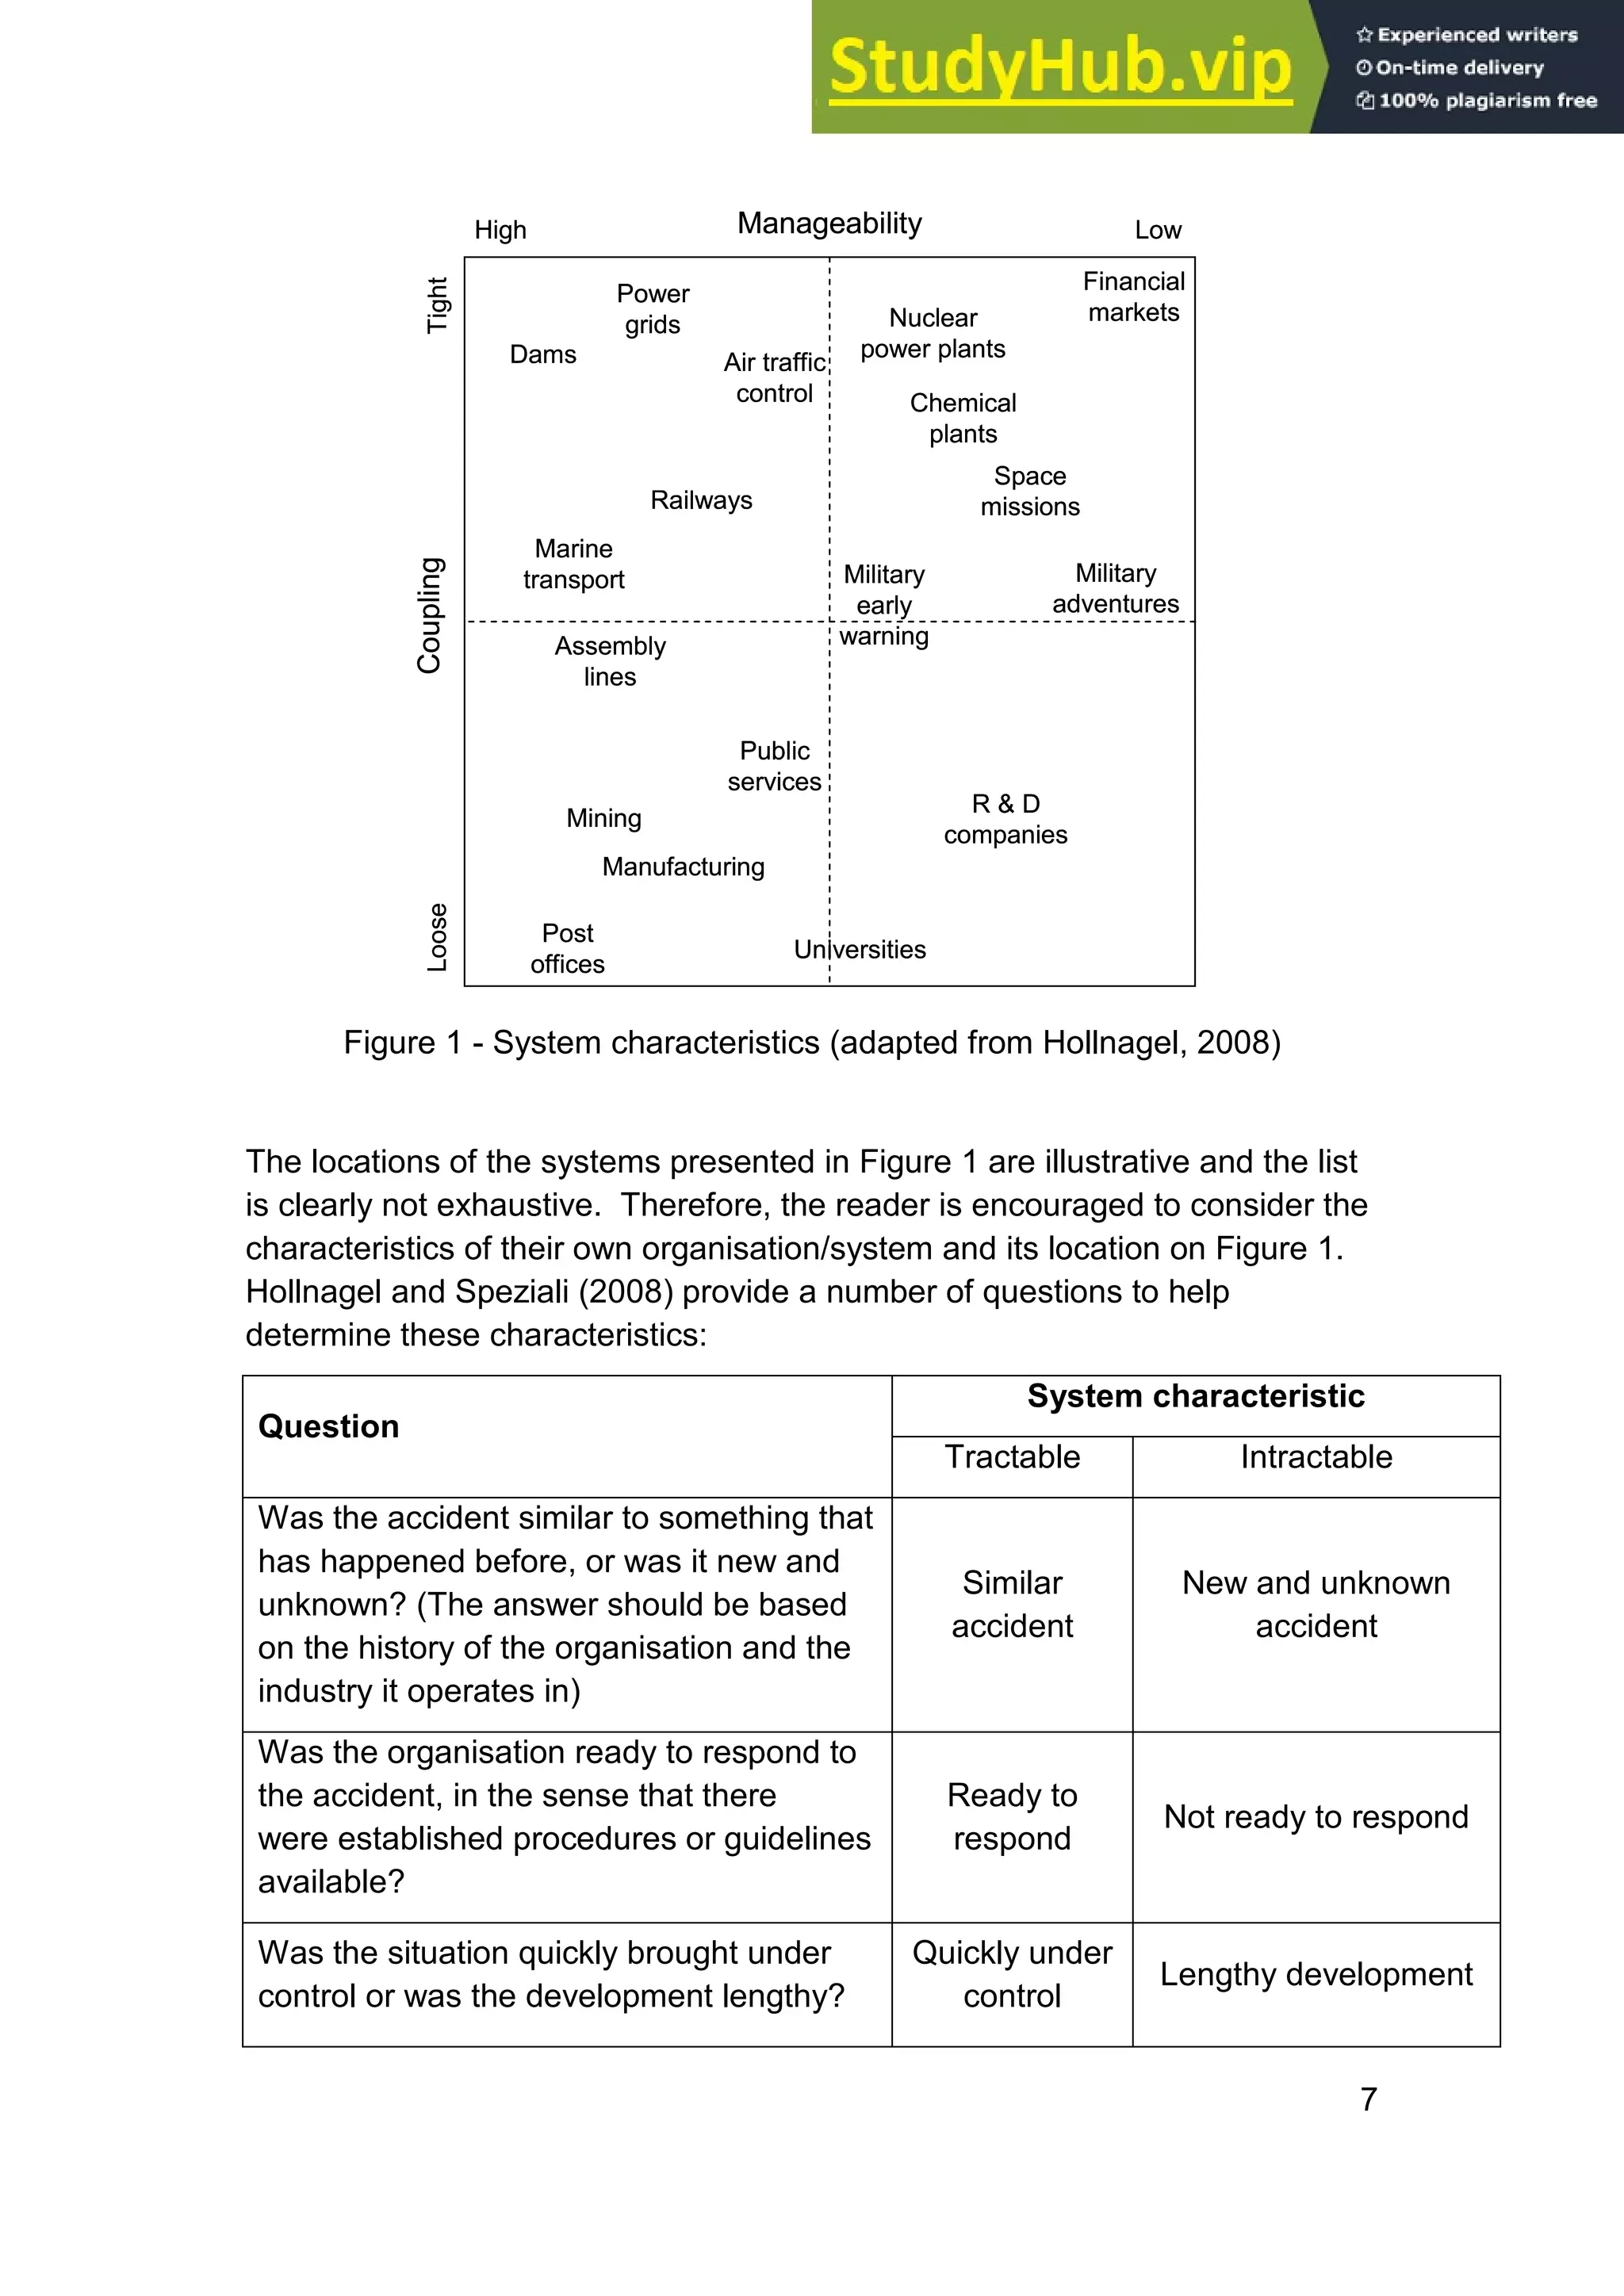
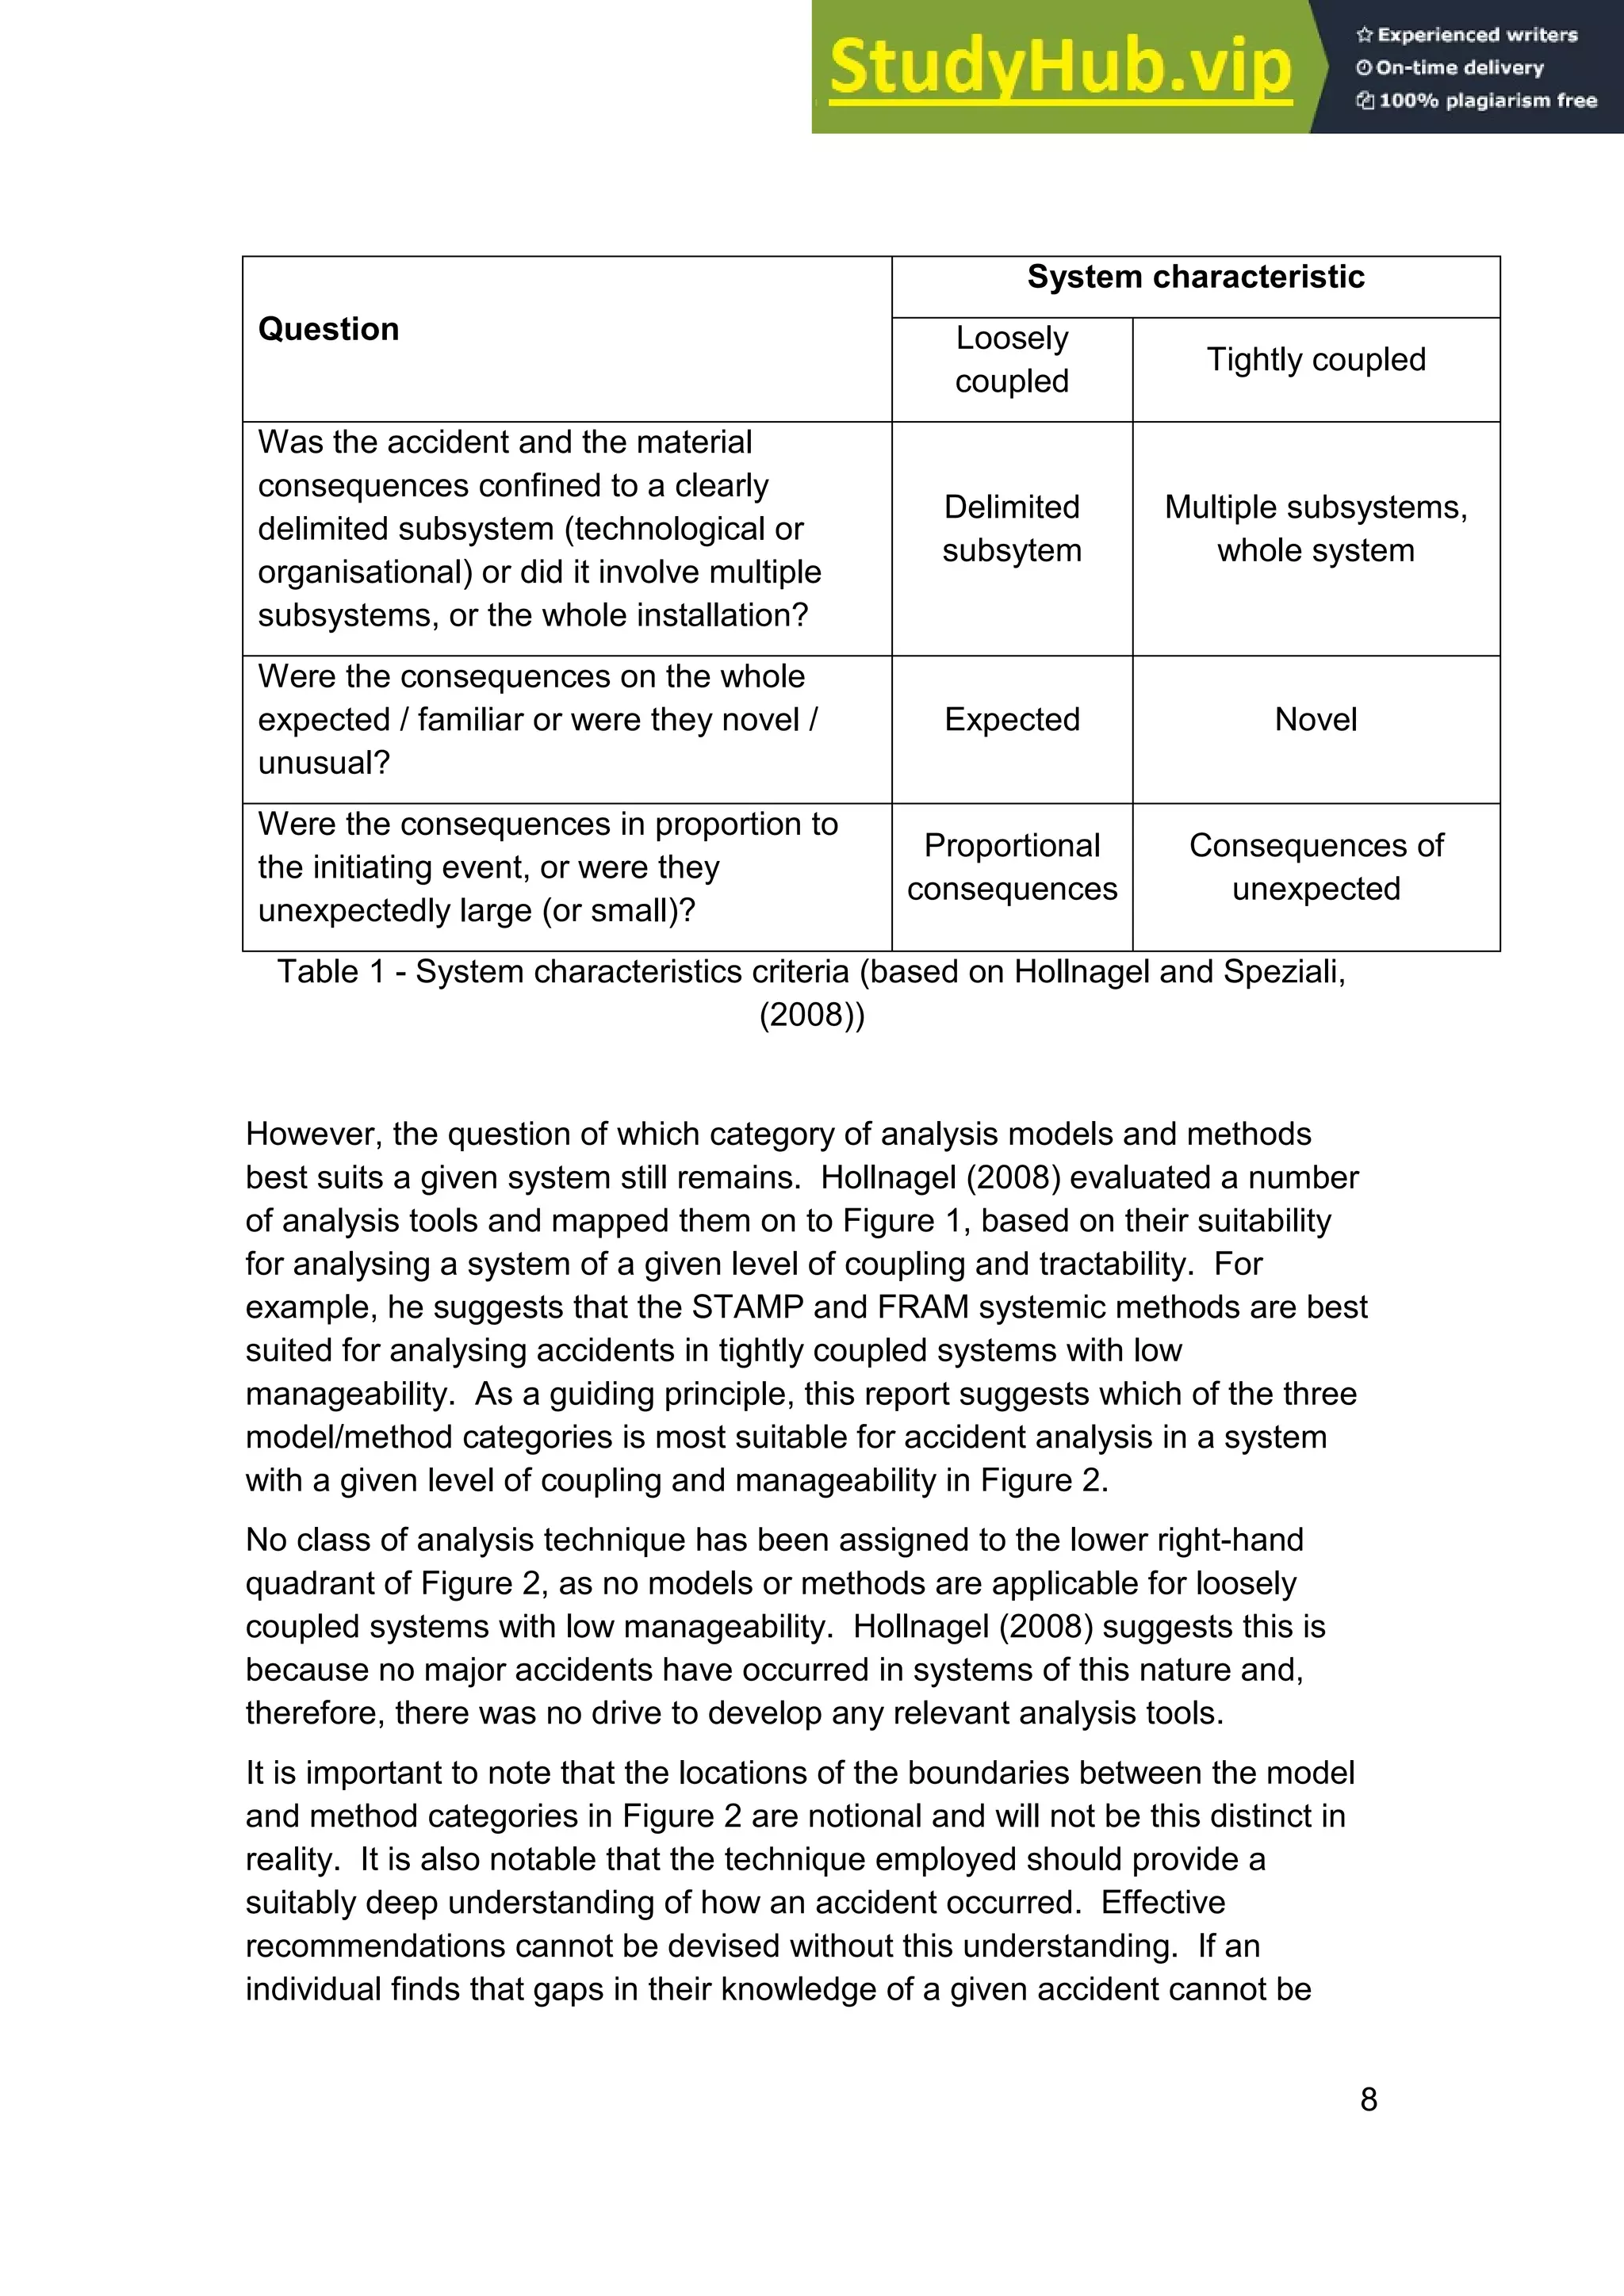
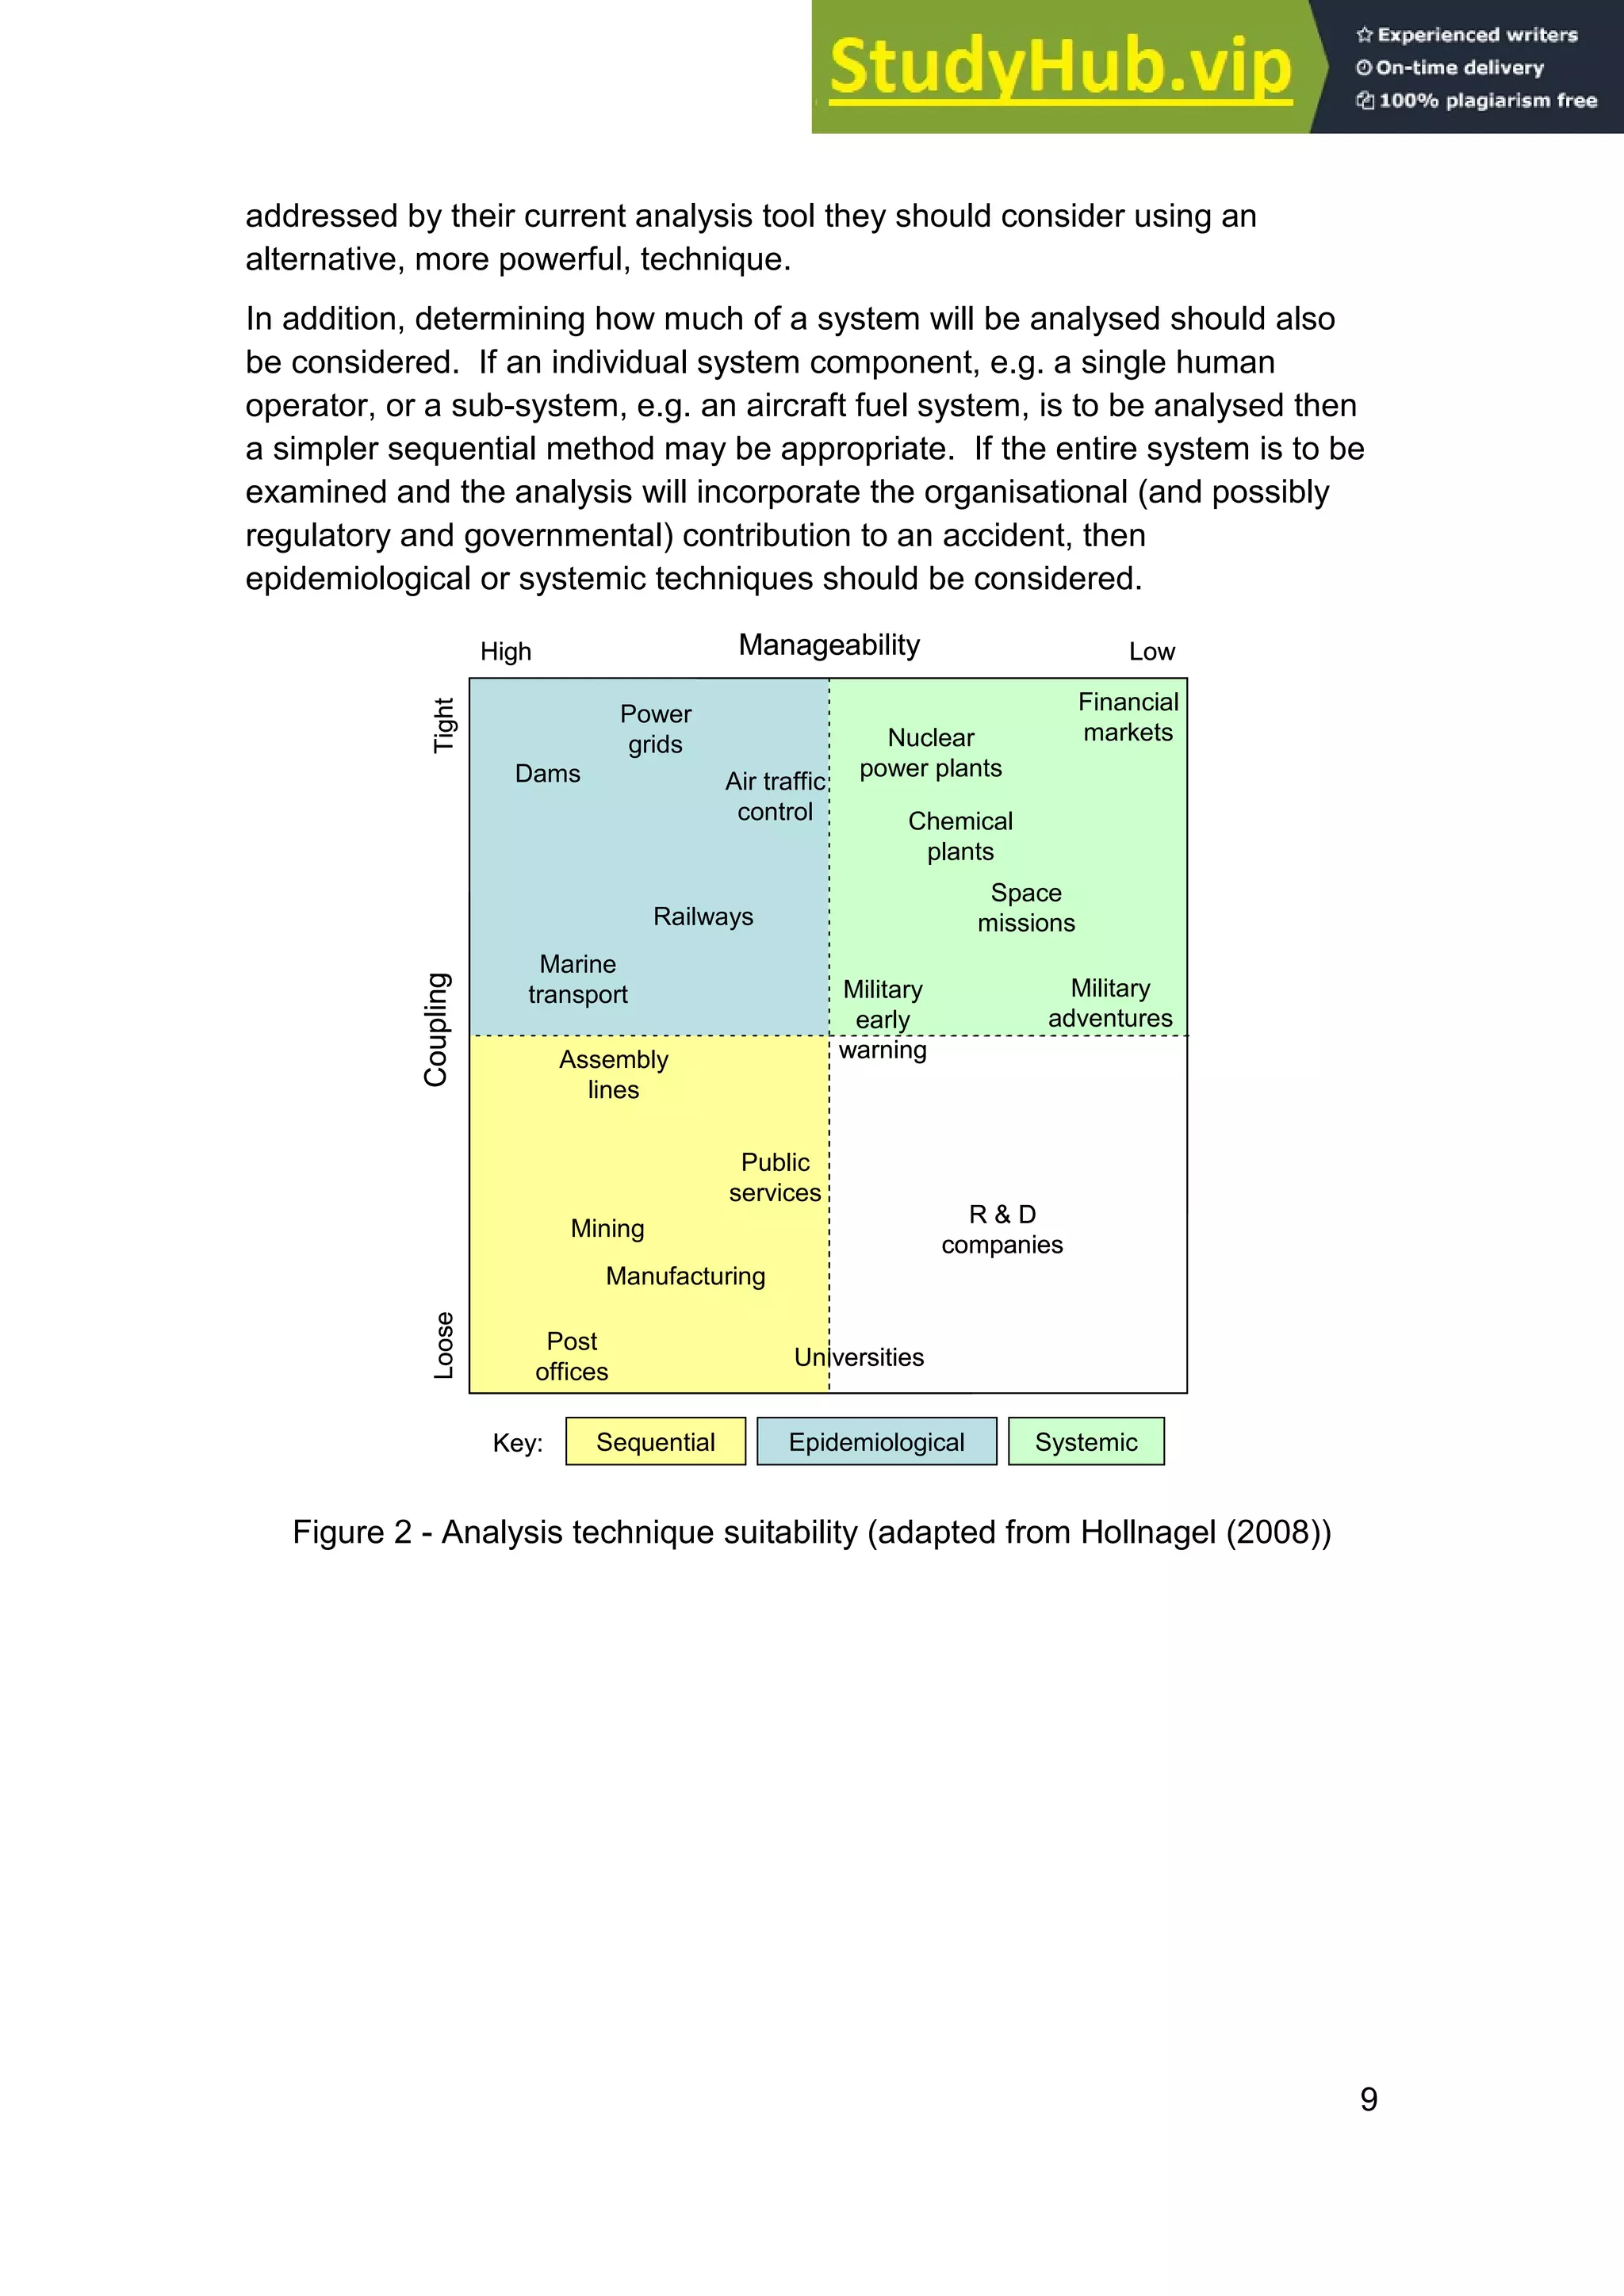
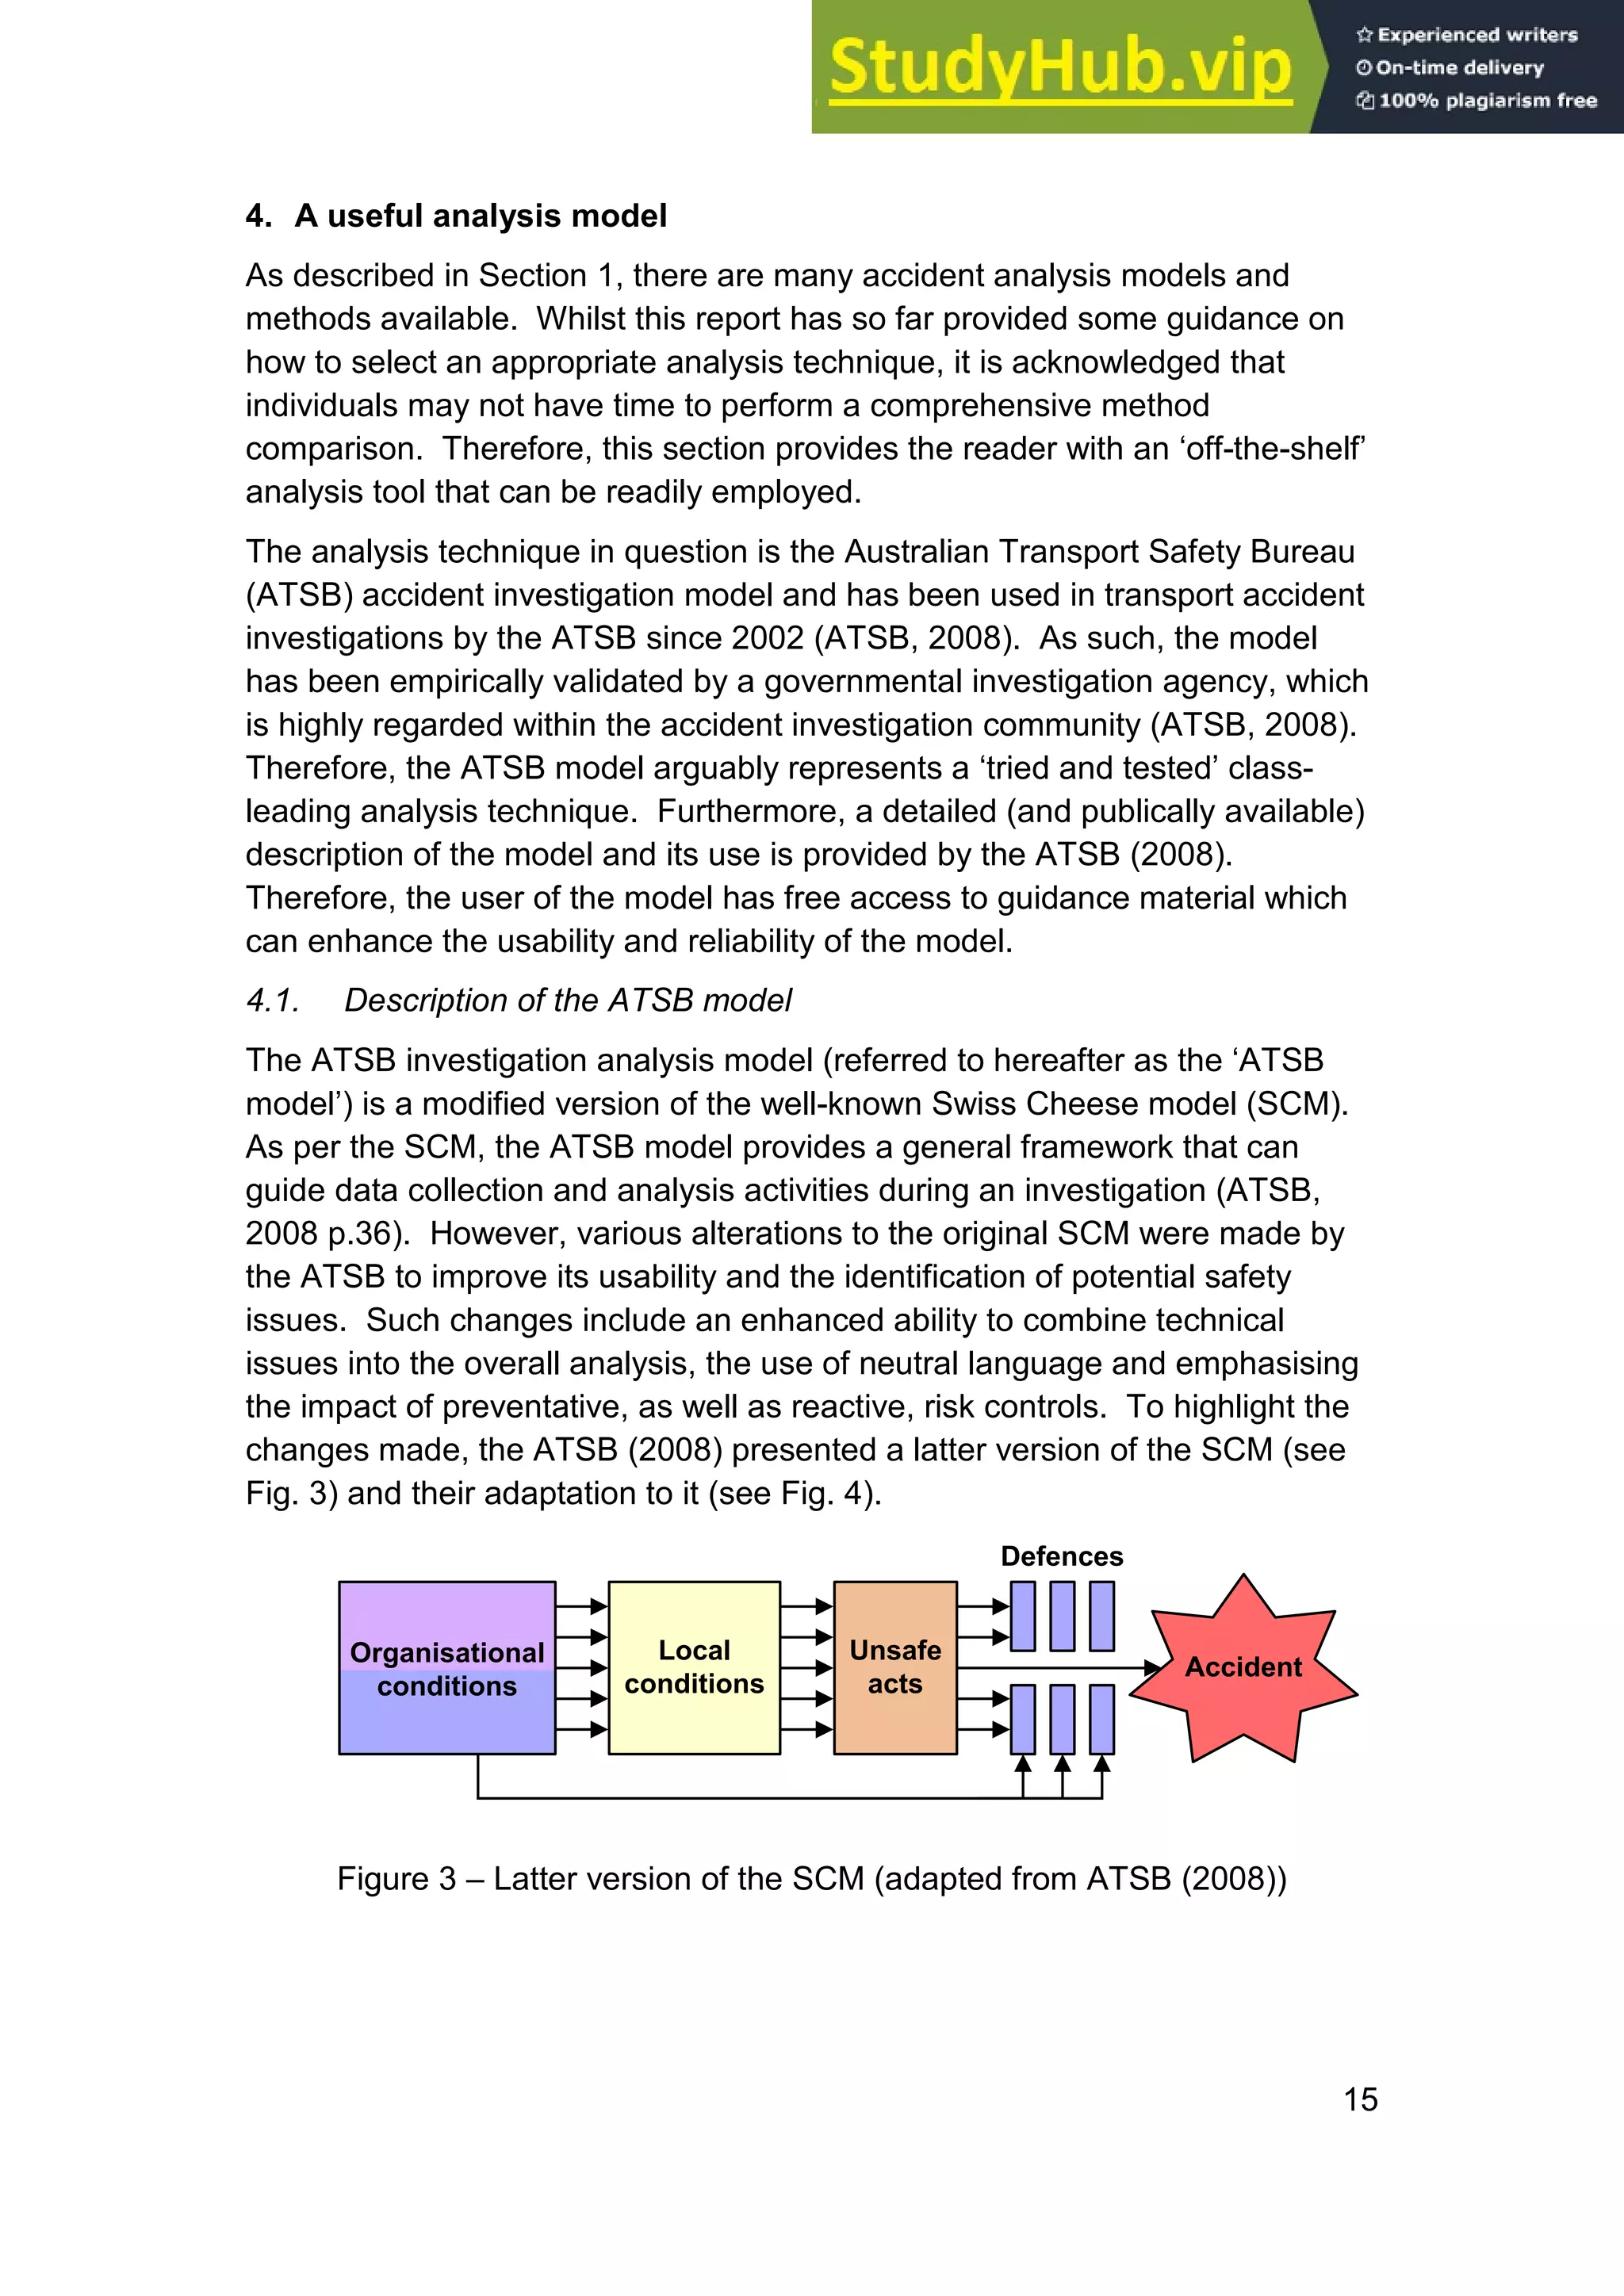
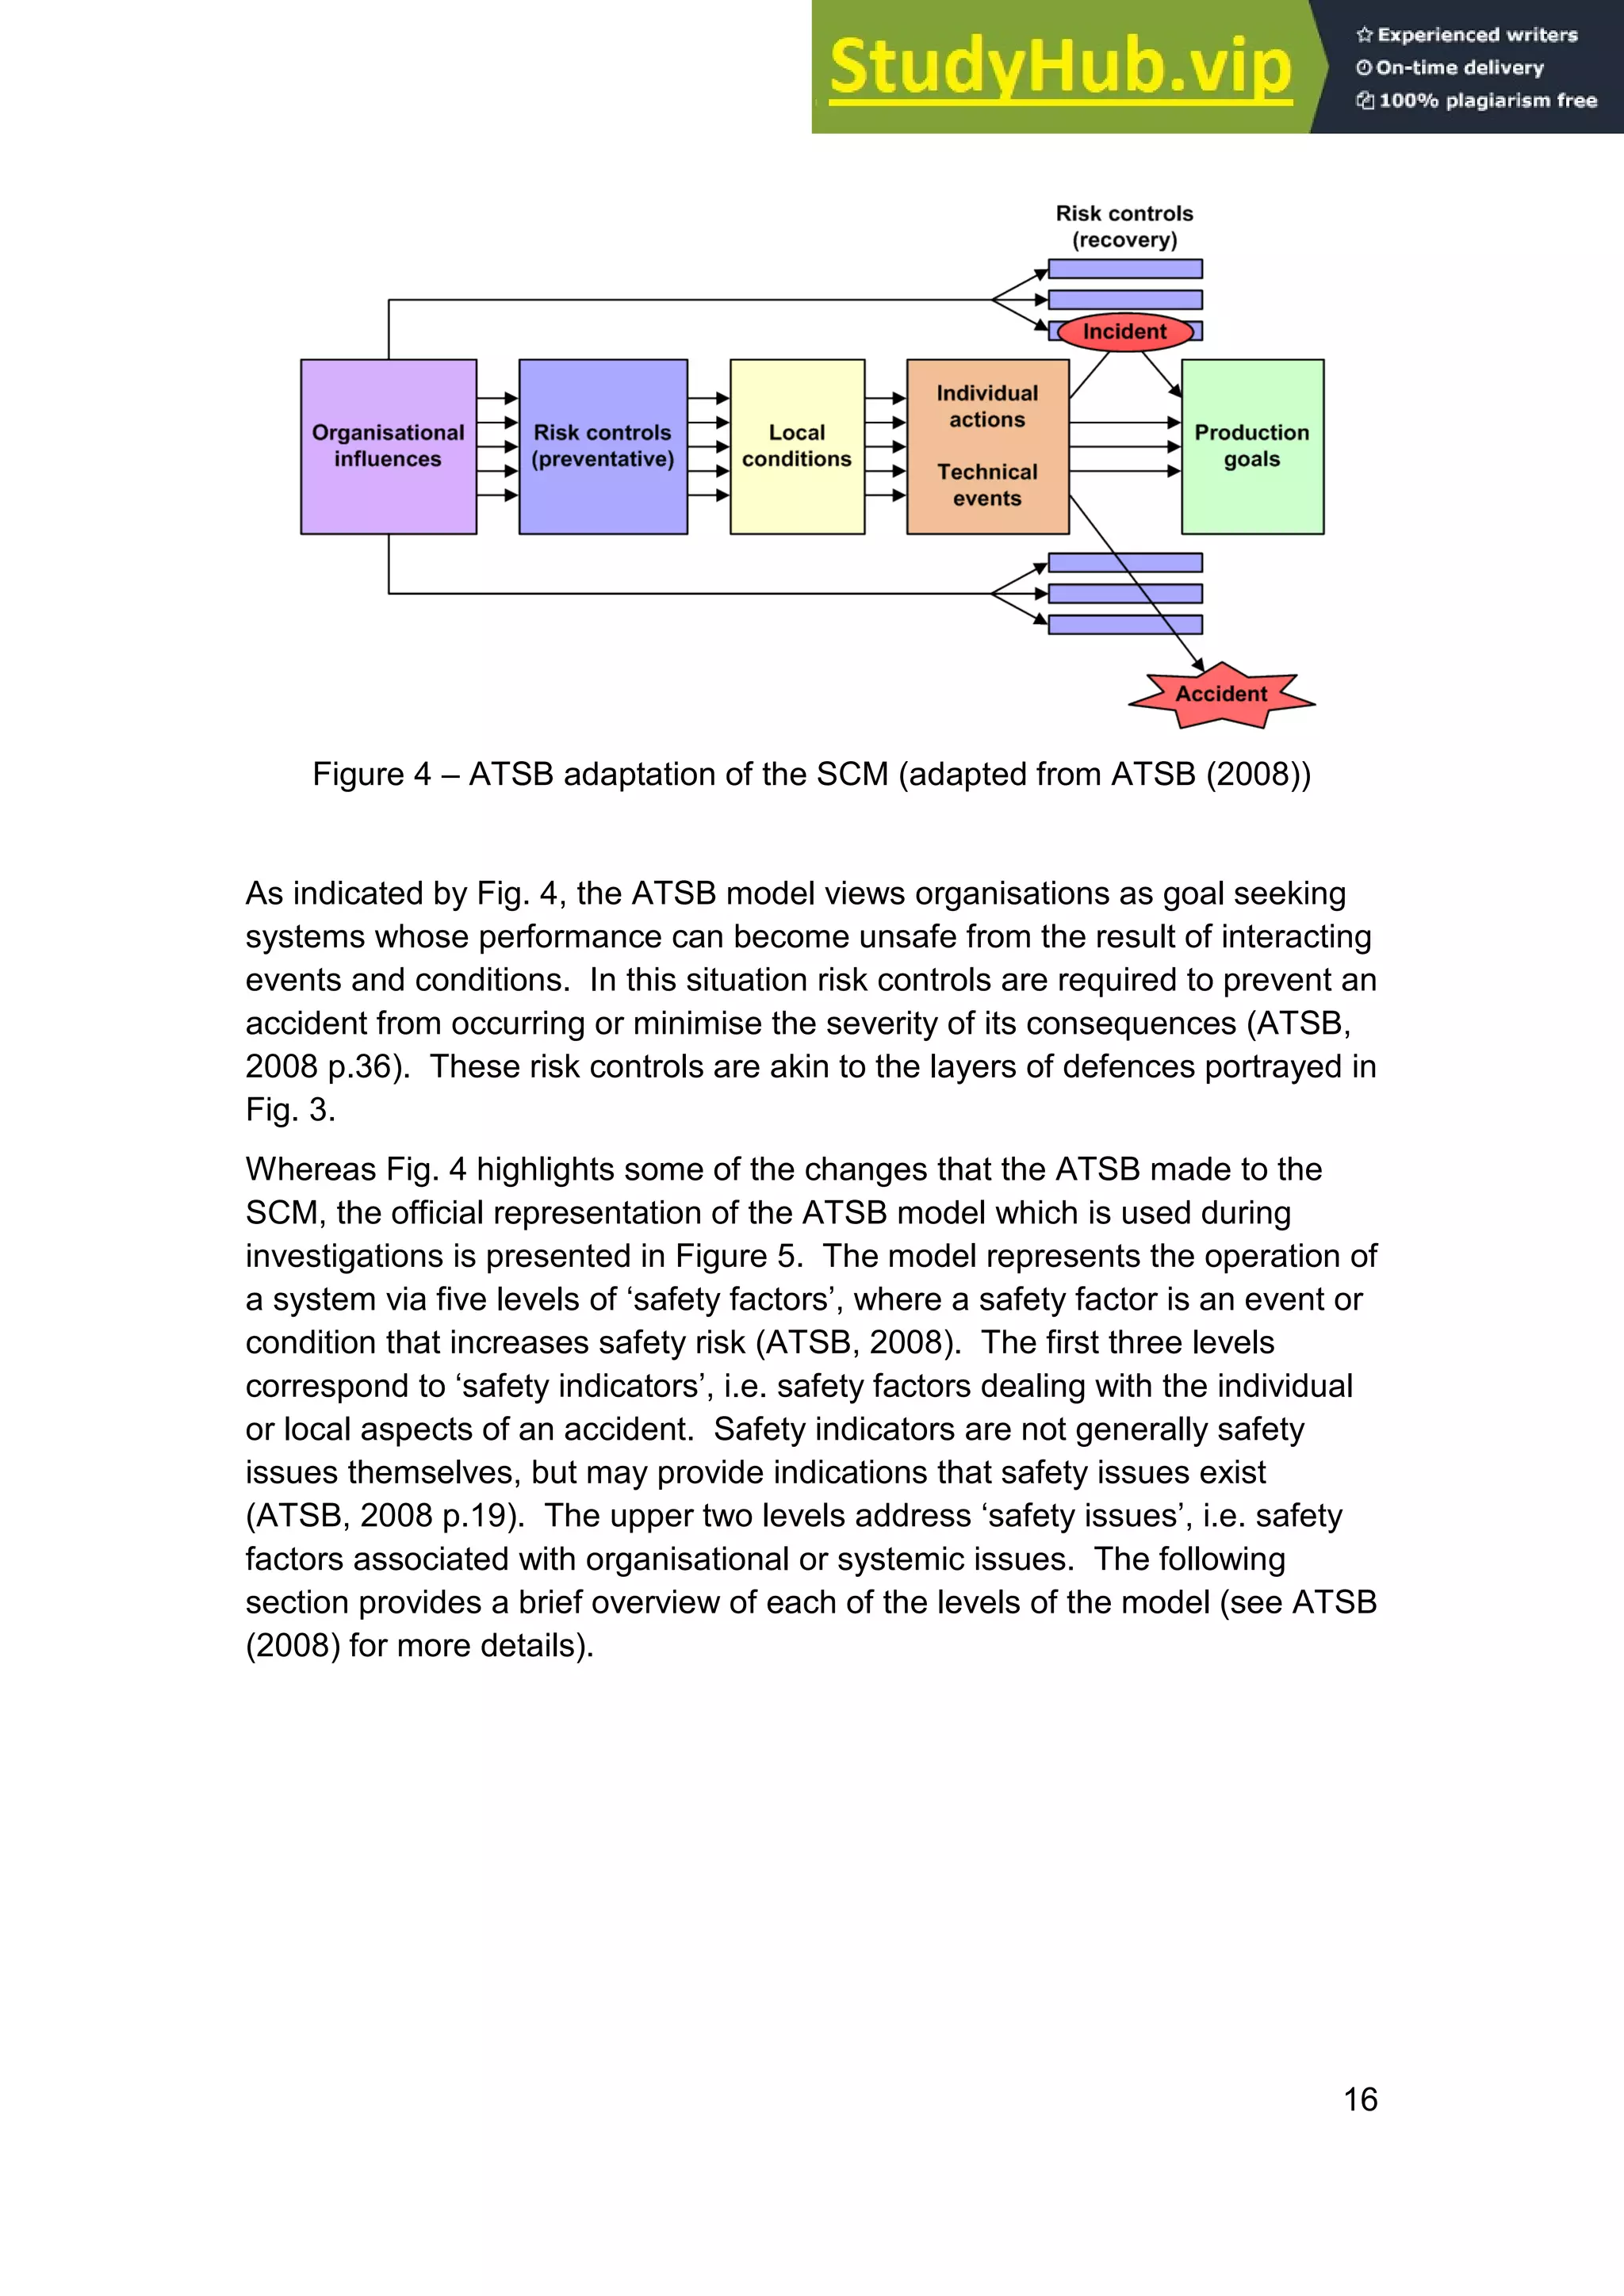
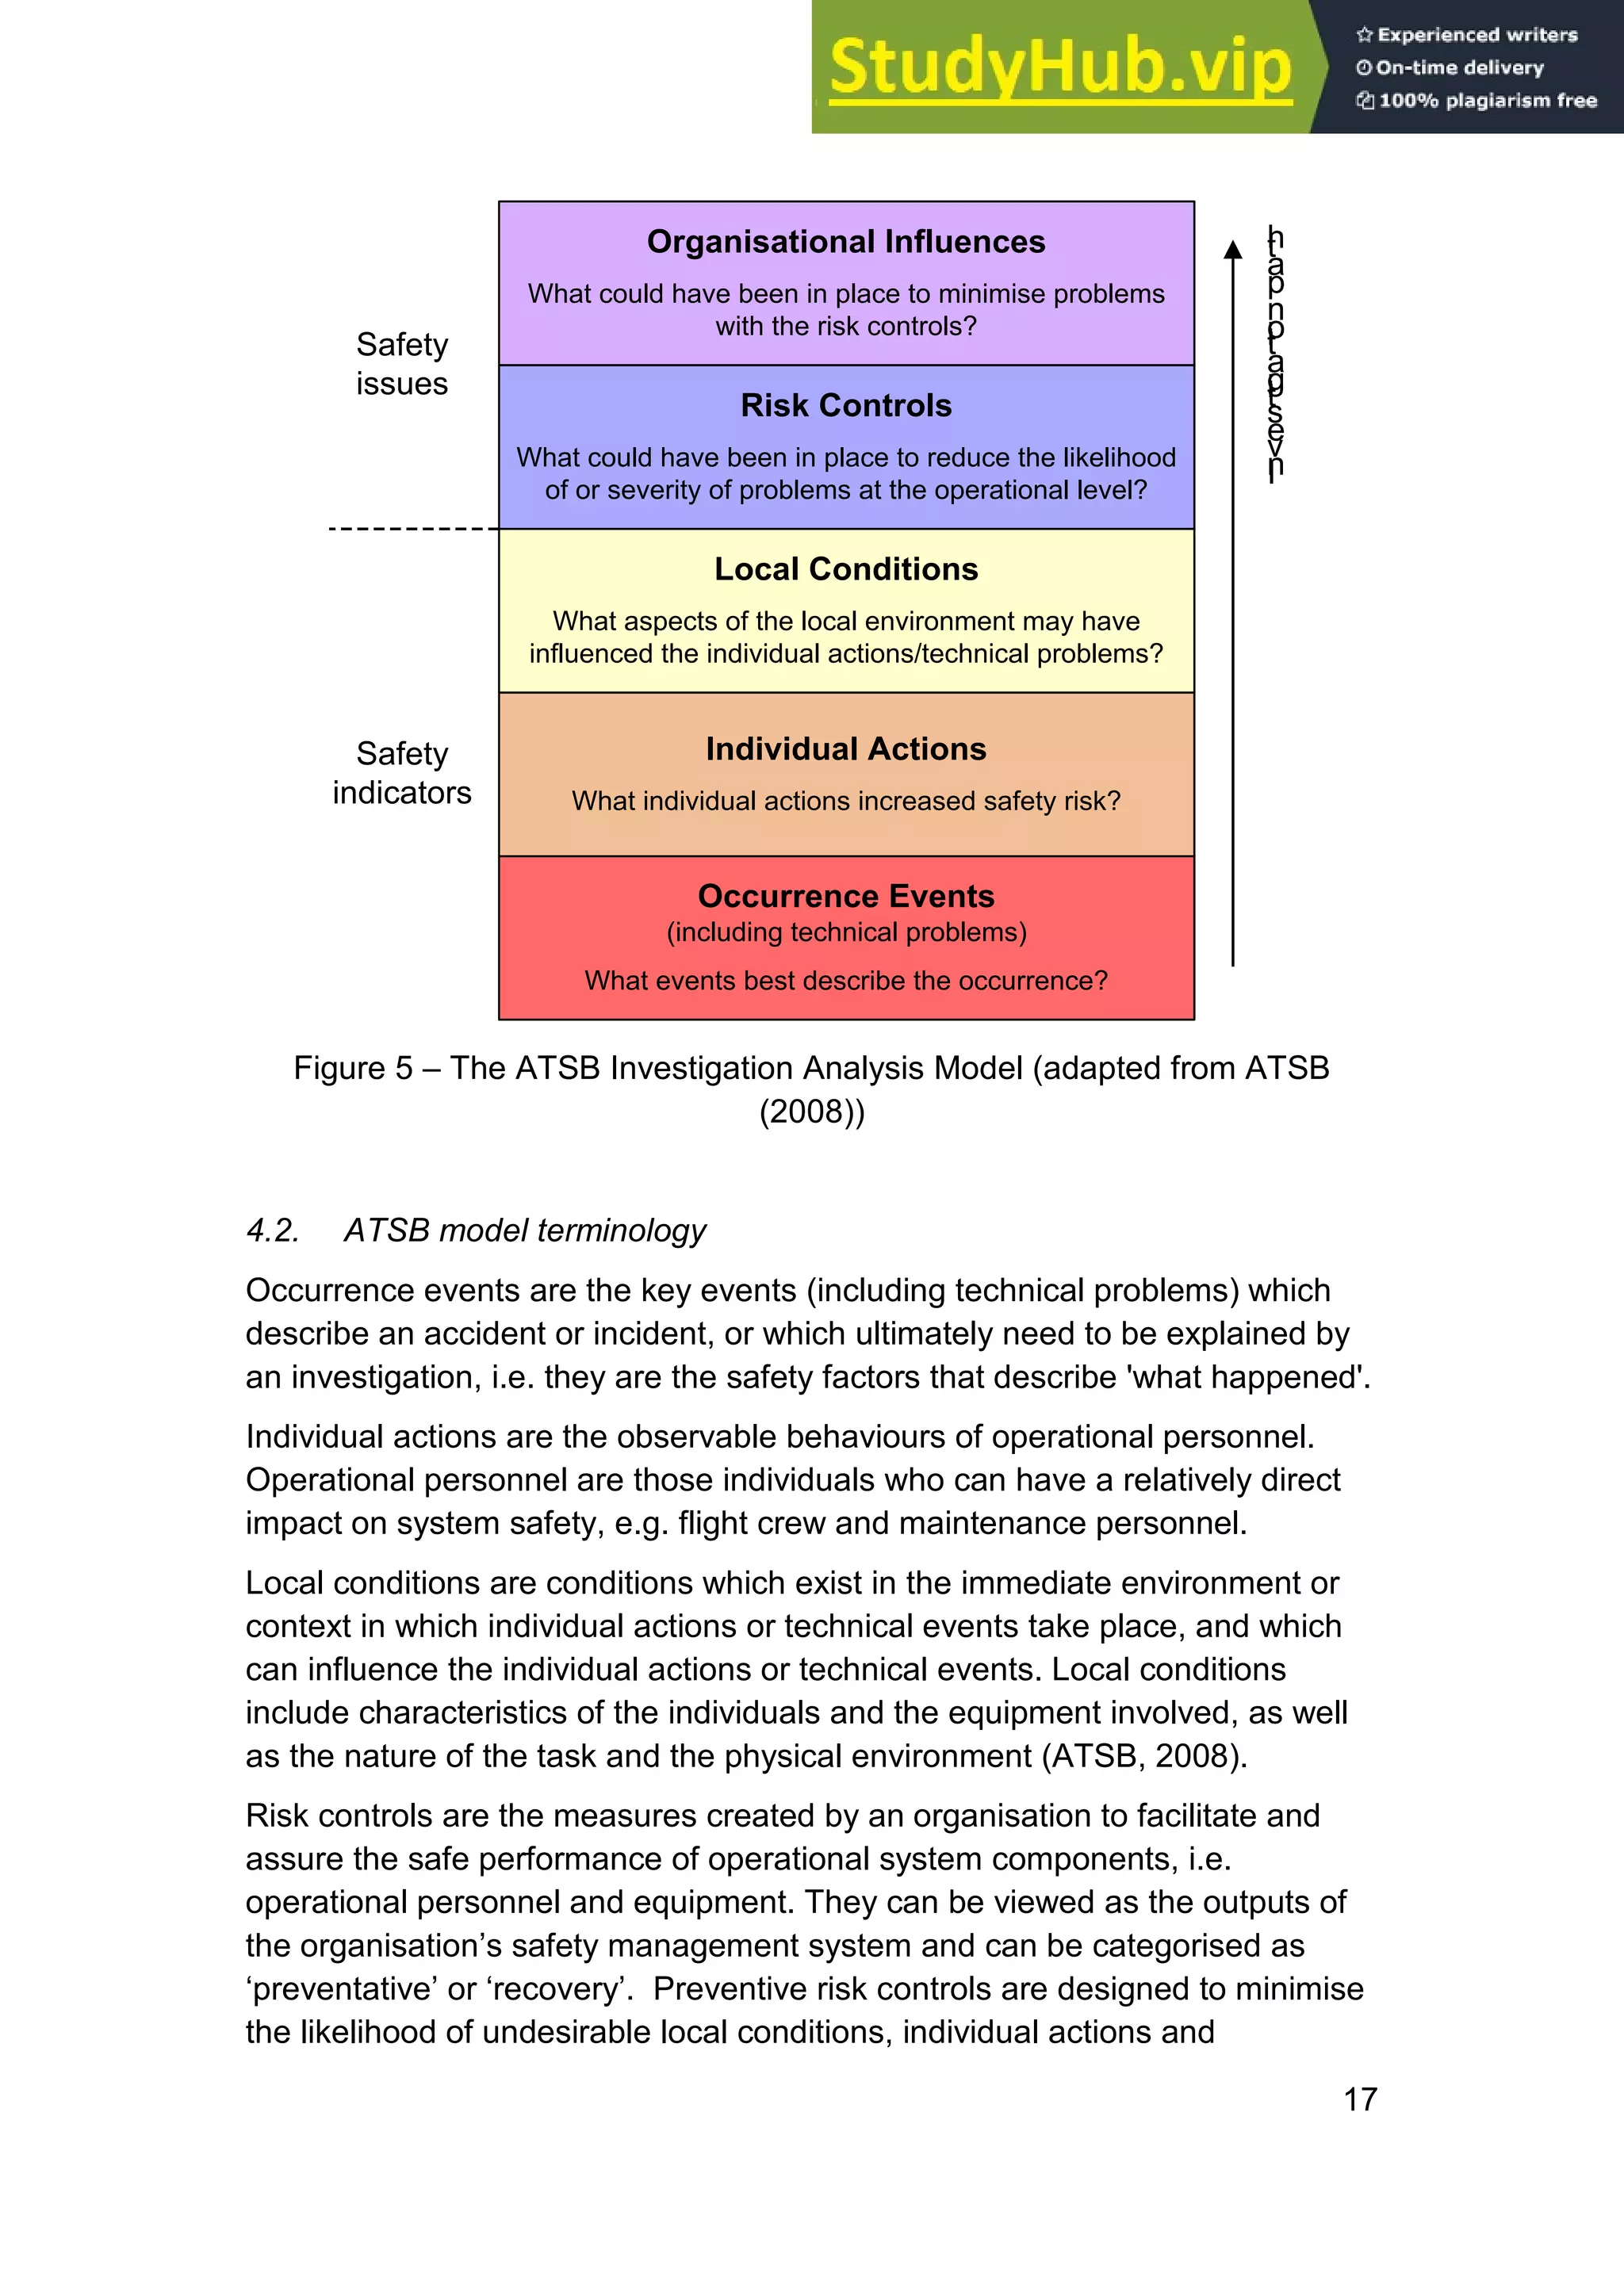
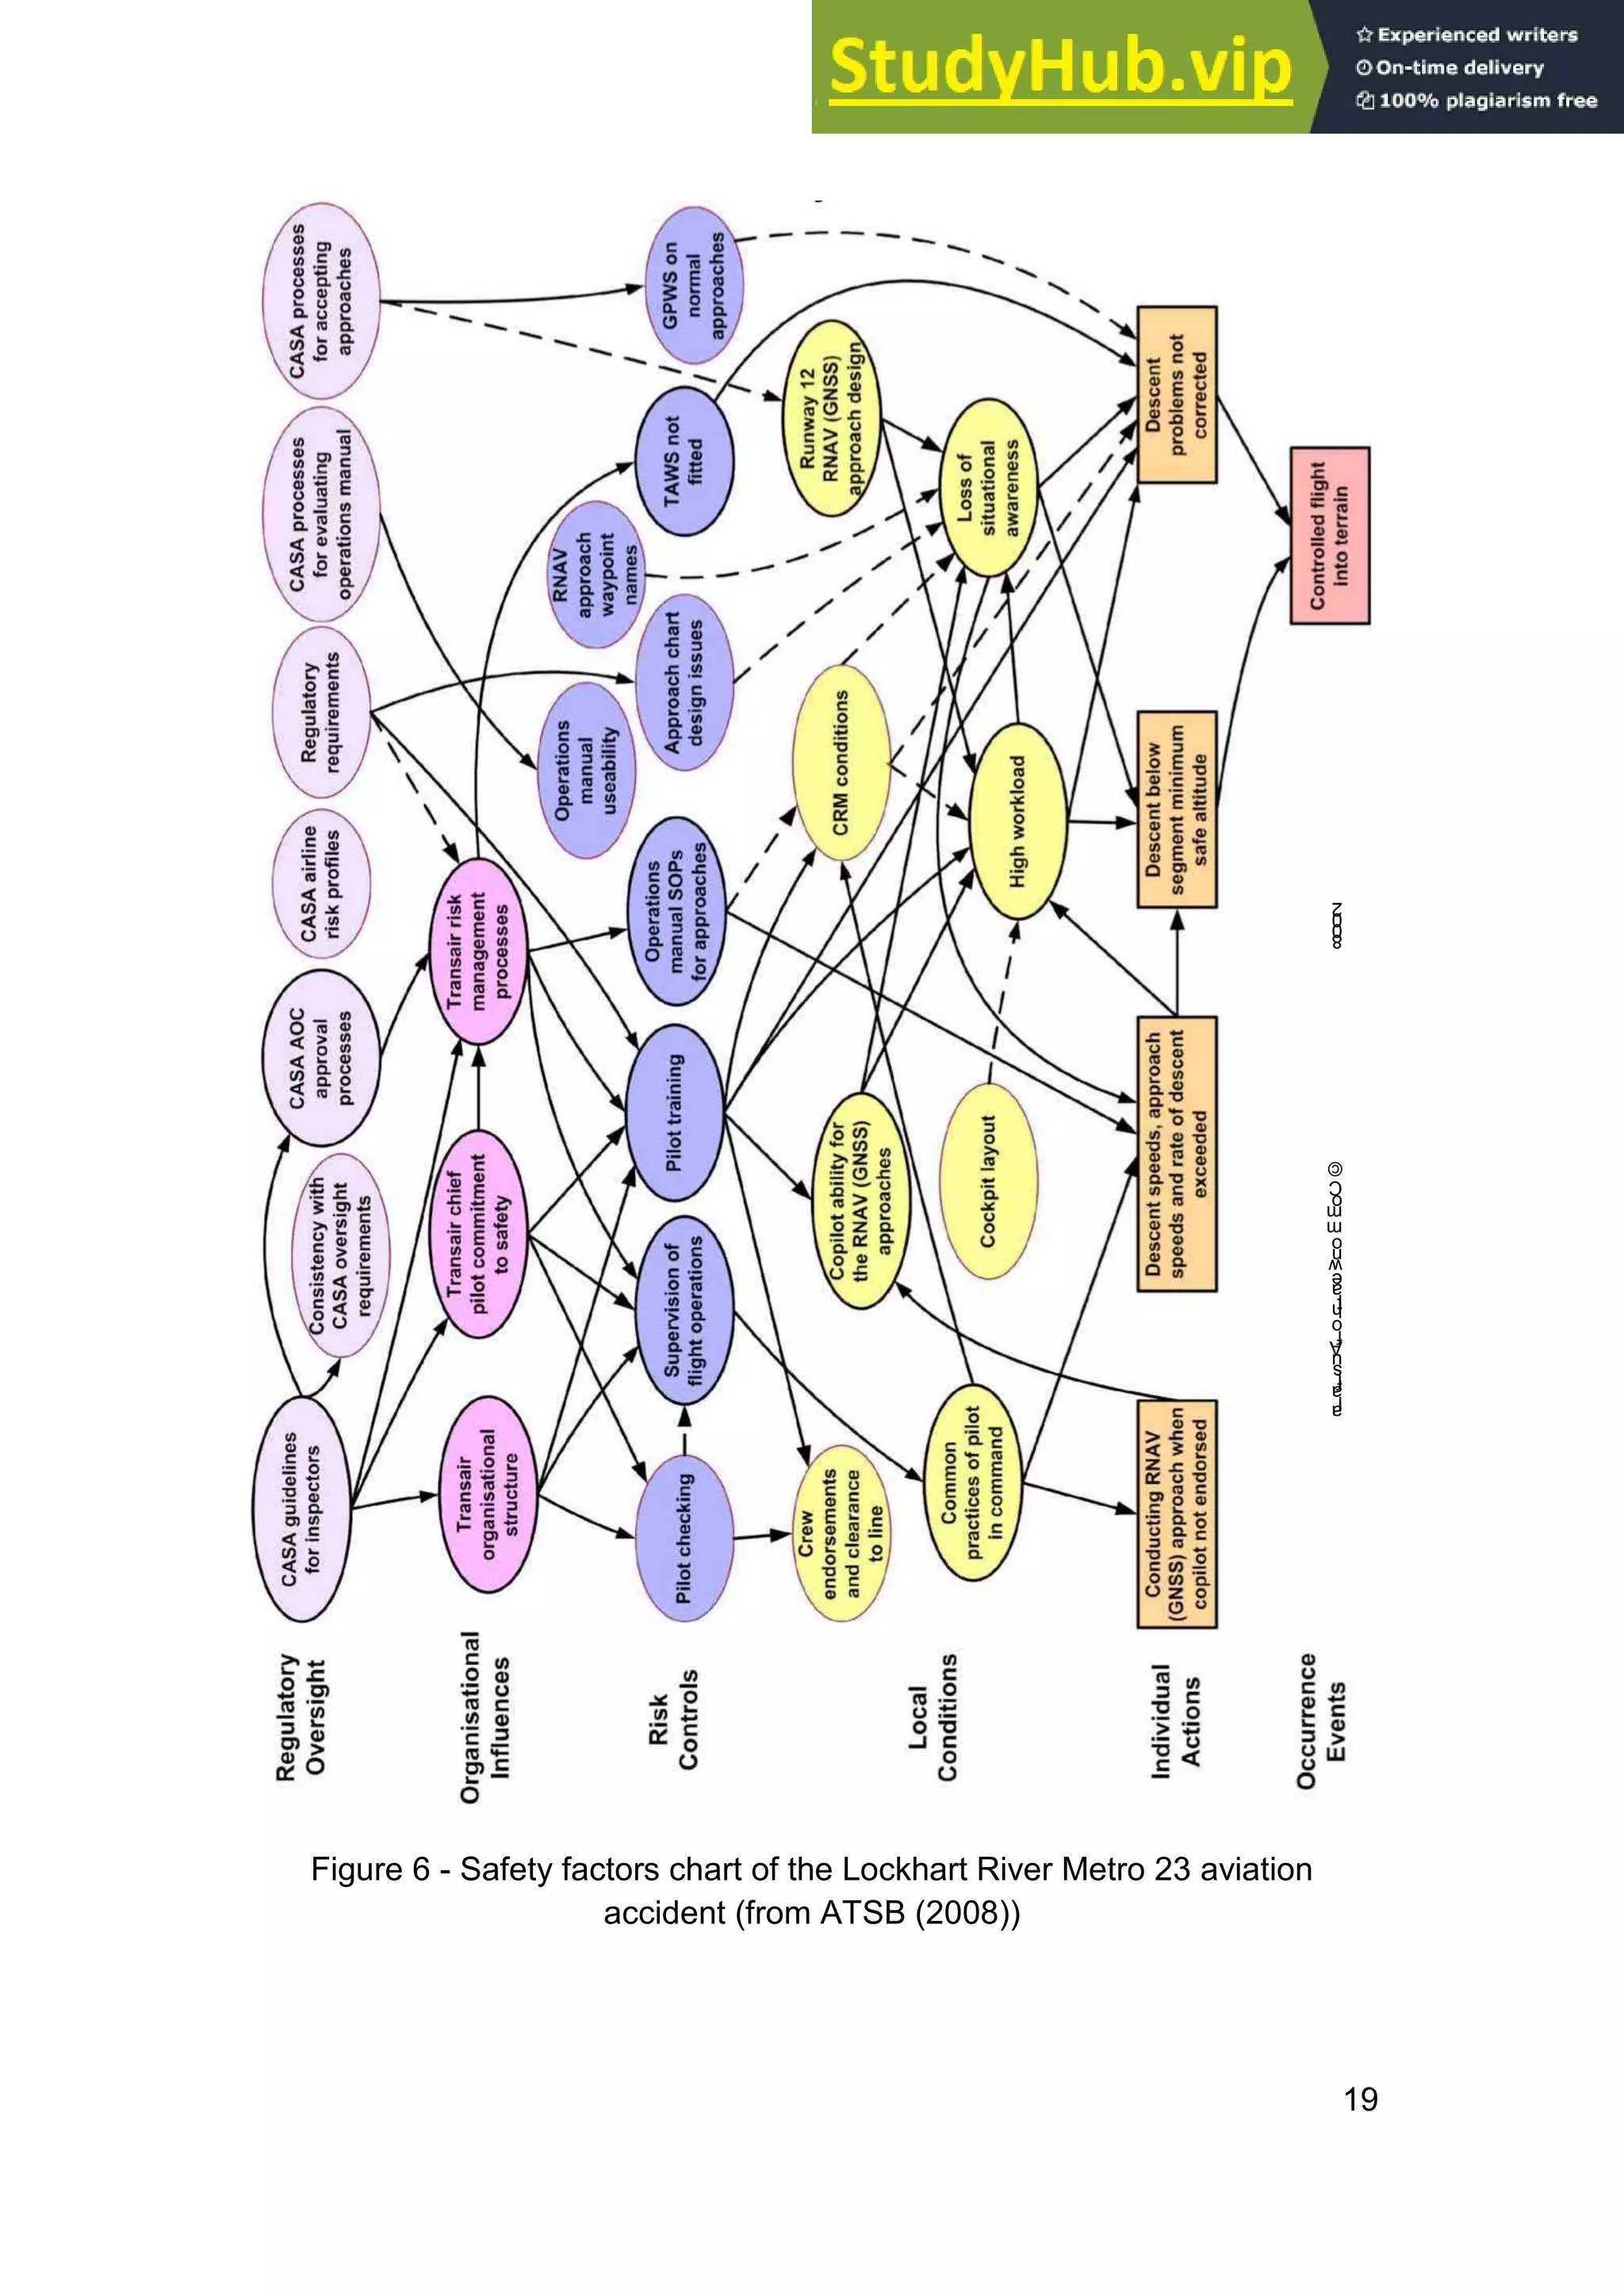

This document provides an overview of accident analysis models and methods. It discusses three categories of analysis techniques: sequential, epidemiological, and systemic. Sequential techniques view accidents as resulting from time-ordered causal events, but cannot adequately account for organizational and human factors. Epidemiological techniques were developed to consider organizational influences, and view accidents as stemming from latent failures within a system. More recently, systemic techniques have emerged that treat socio-technical systems holistically and focus on the interactions between system components. The document aims to inform readers on different analysis approaches and factors that influence model selection.


