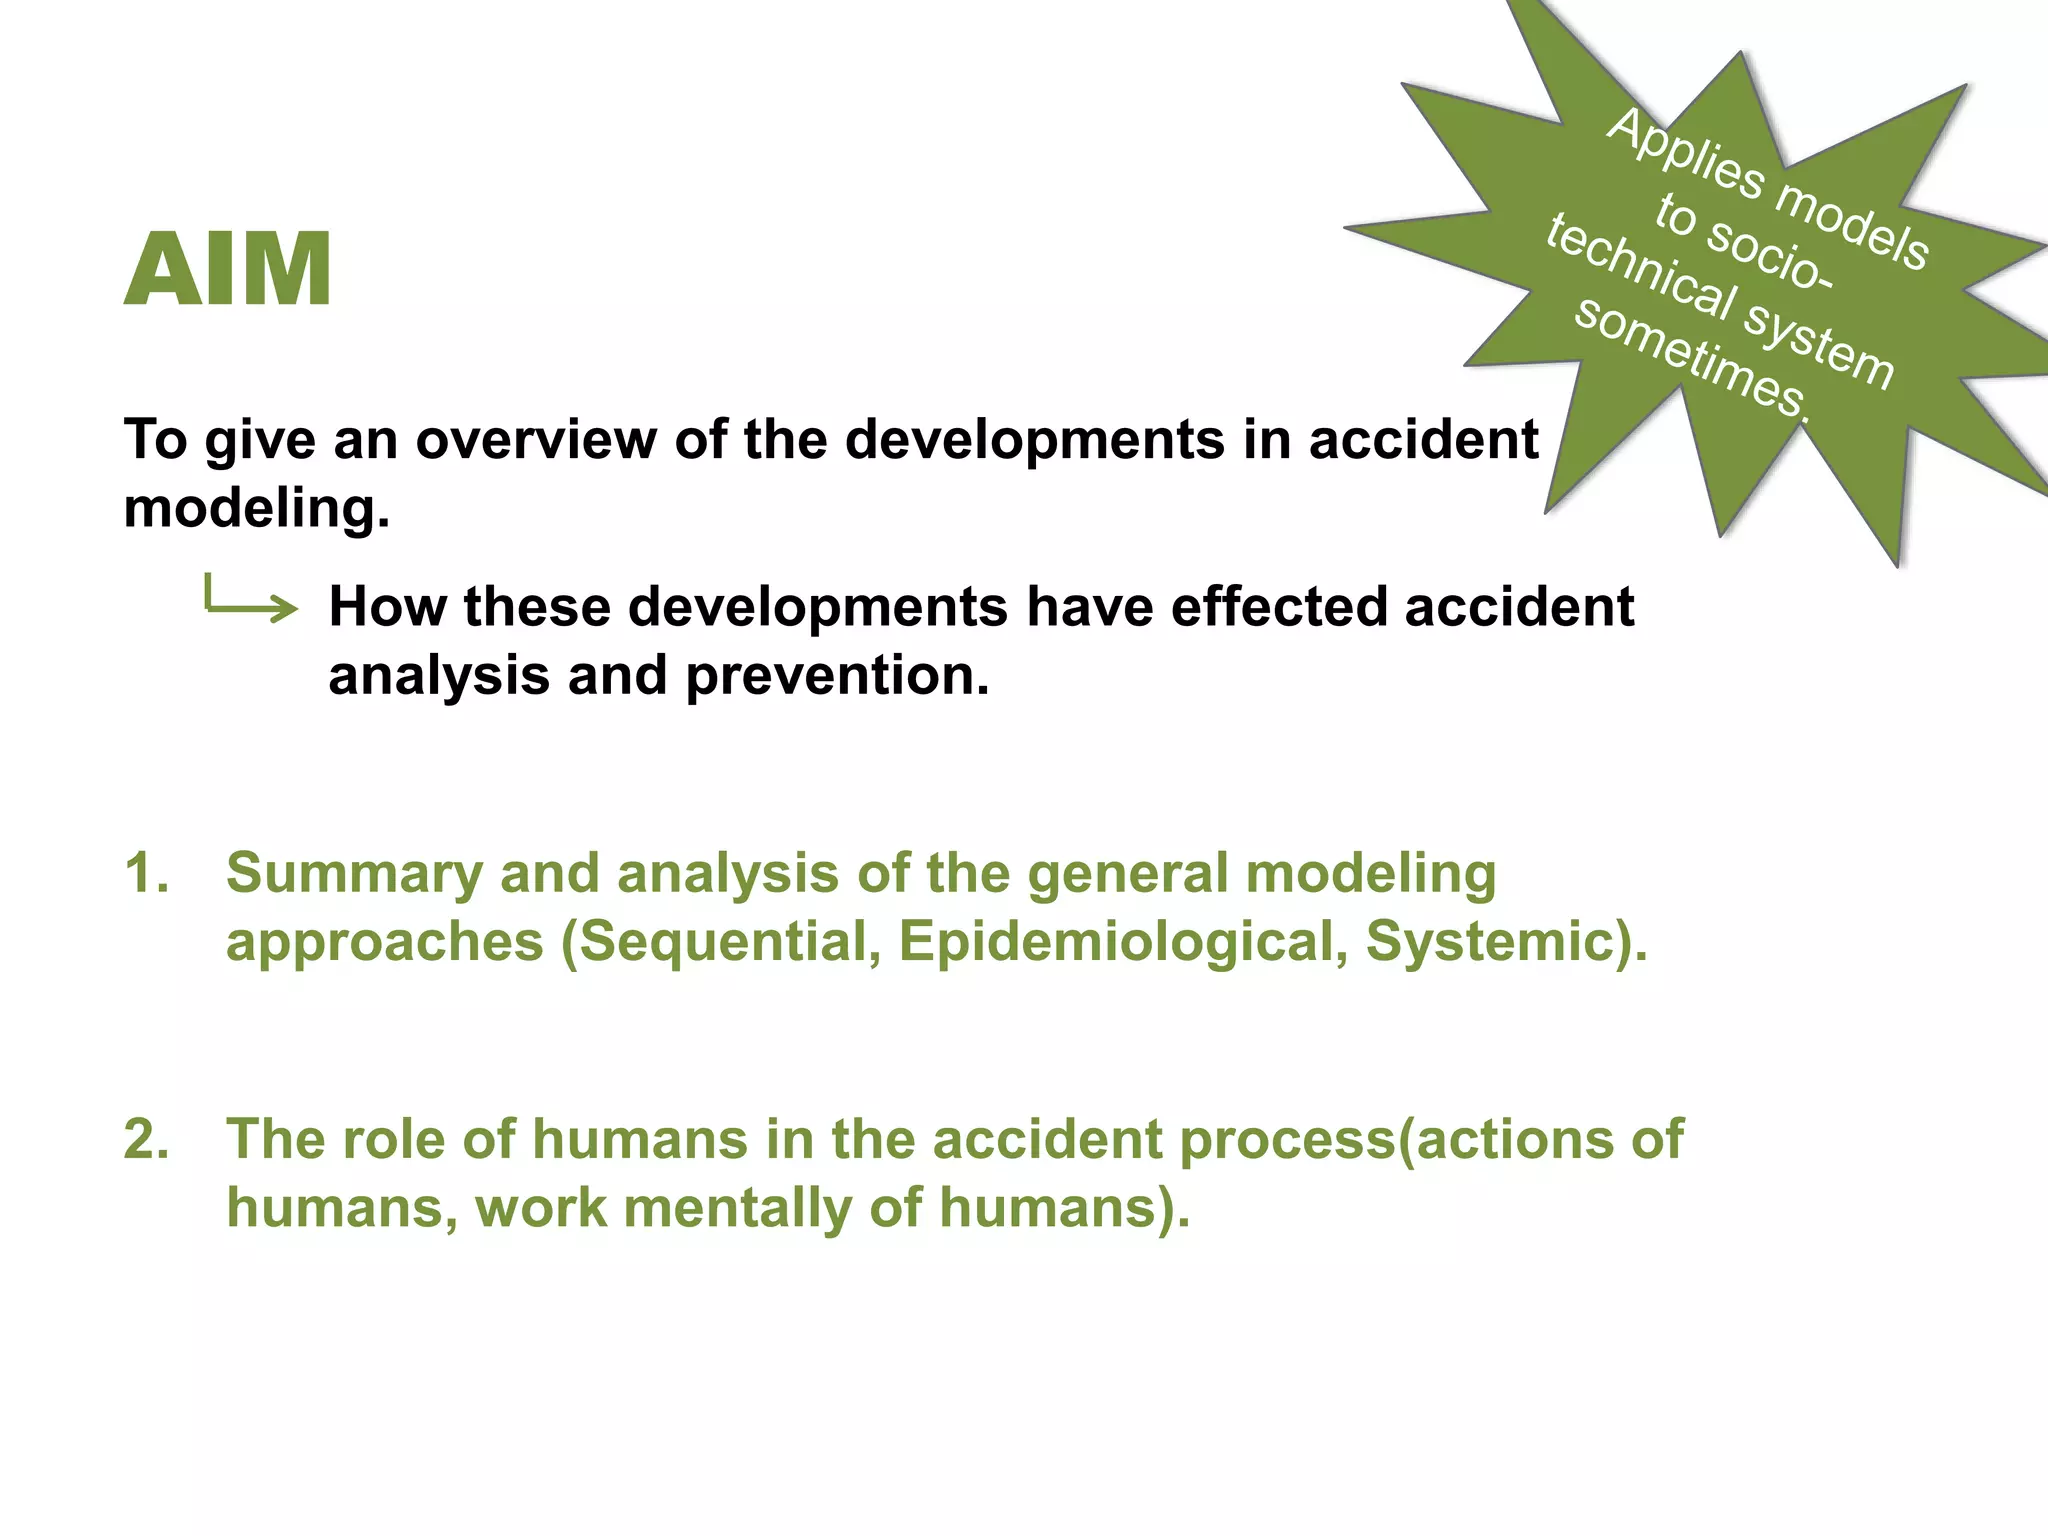
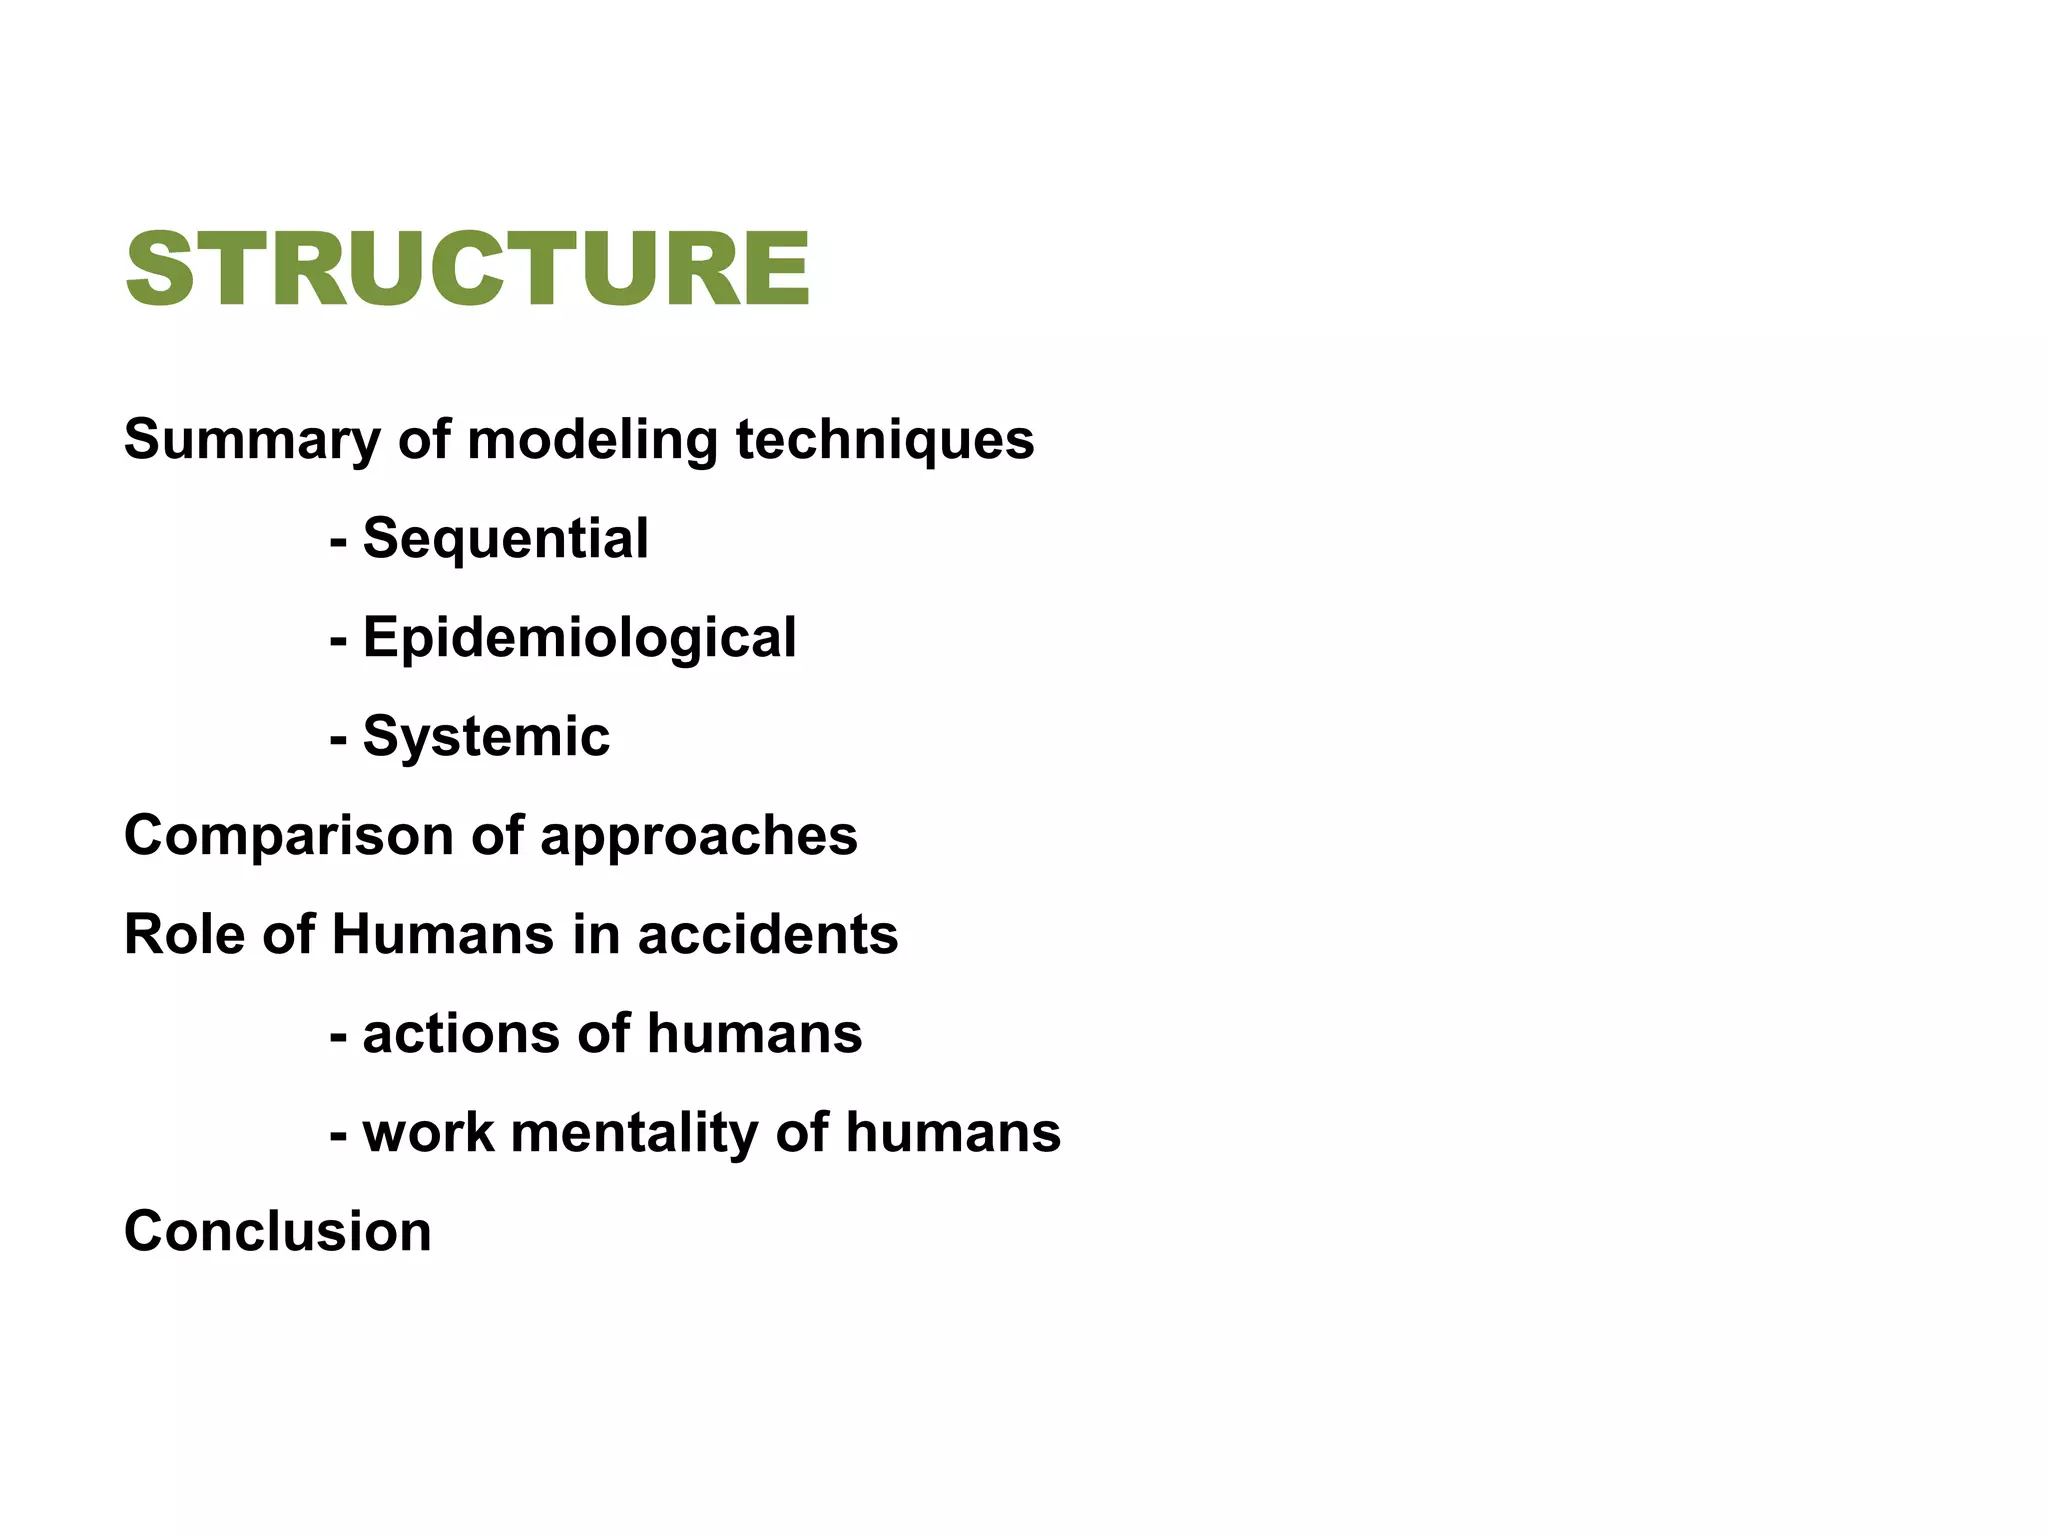
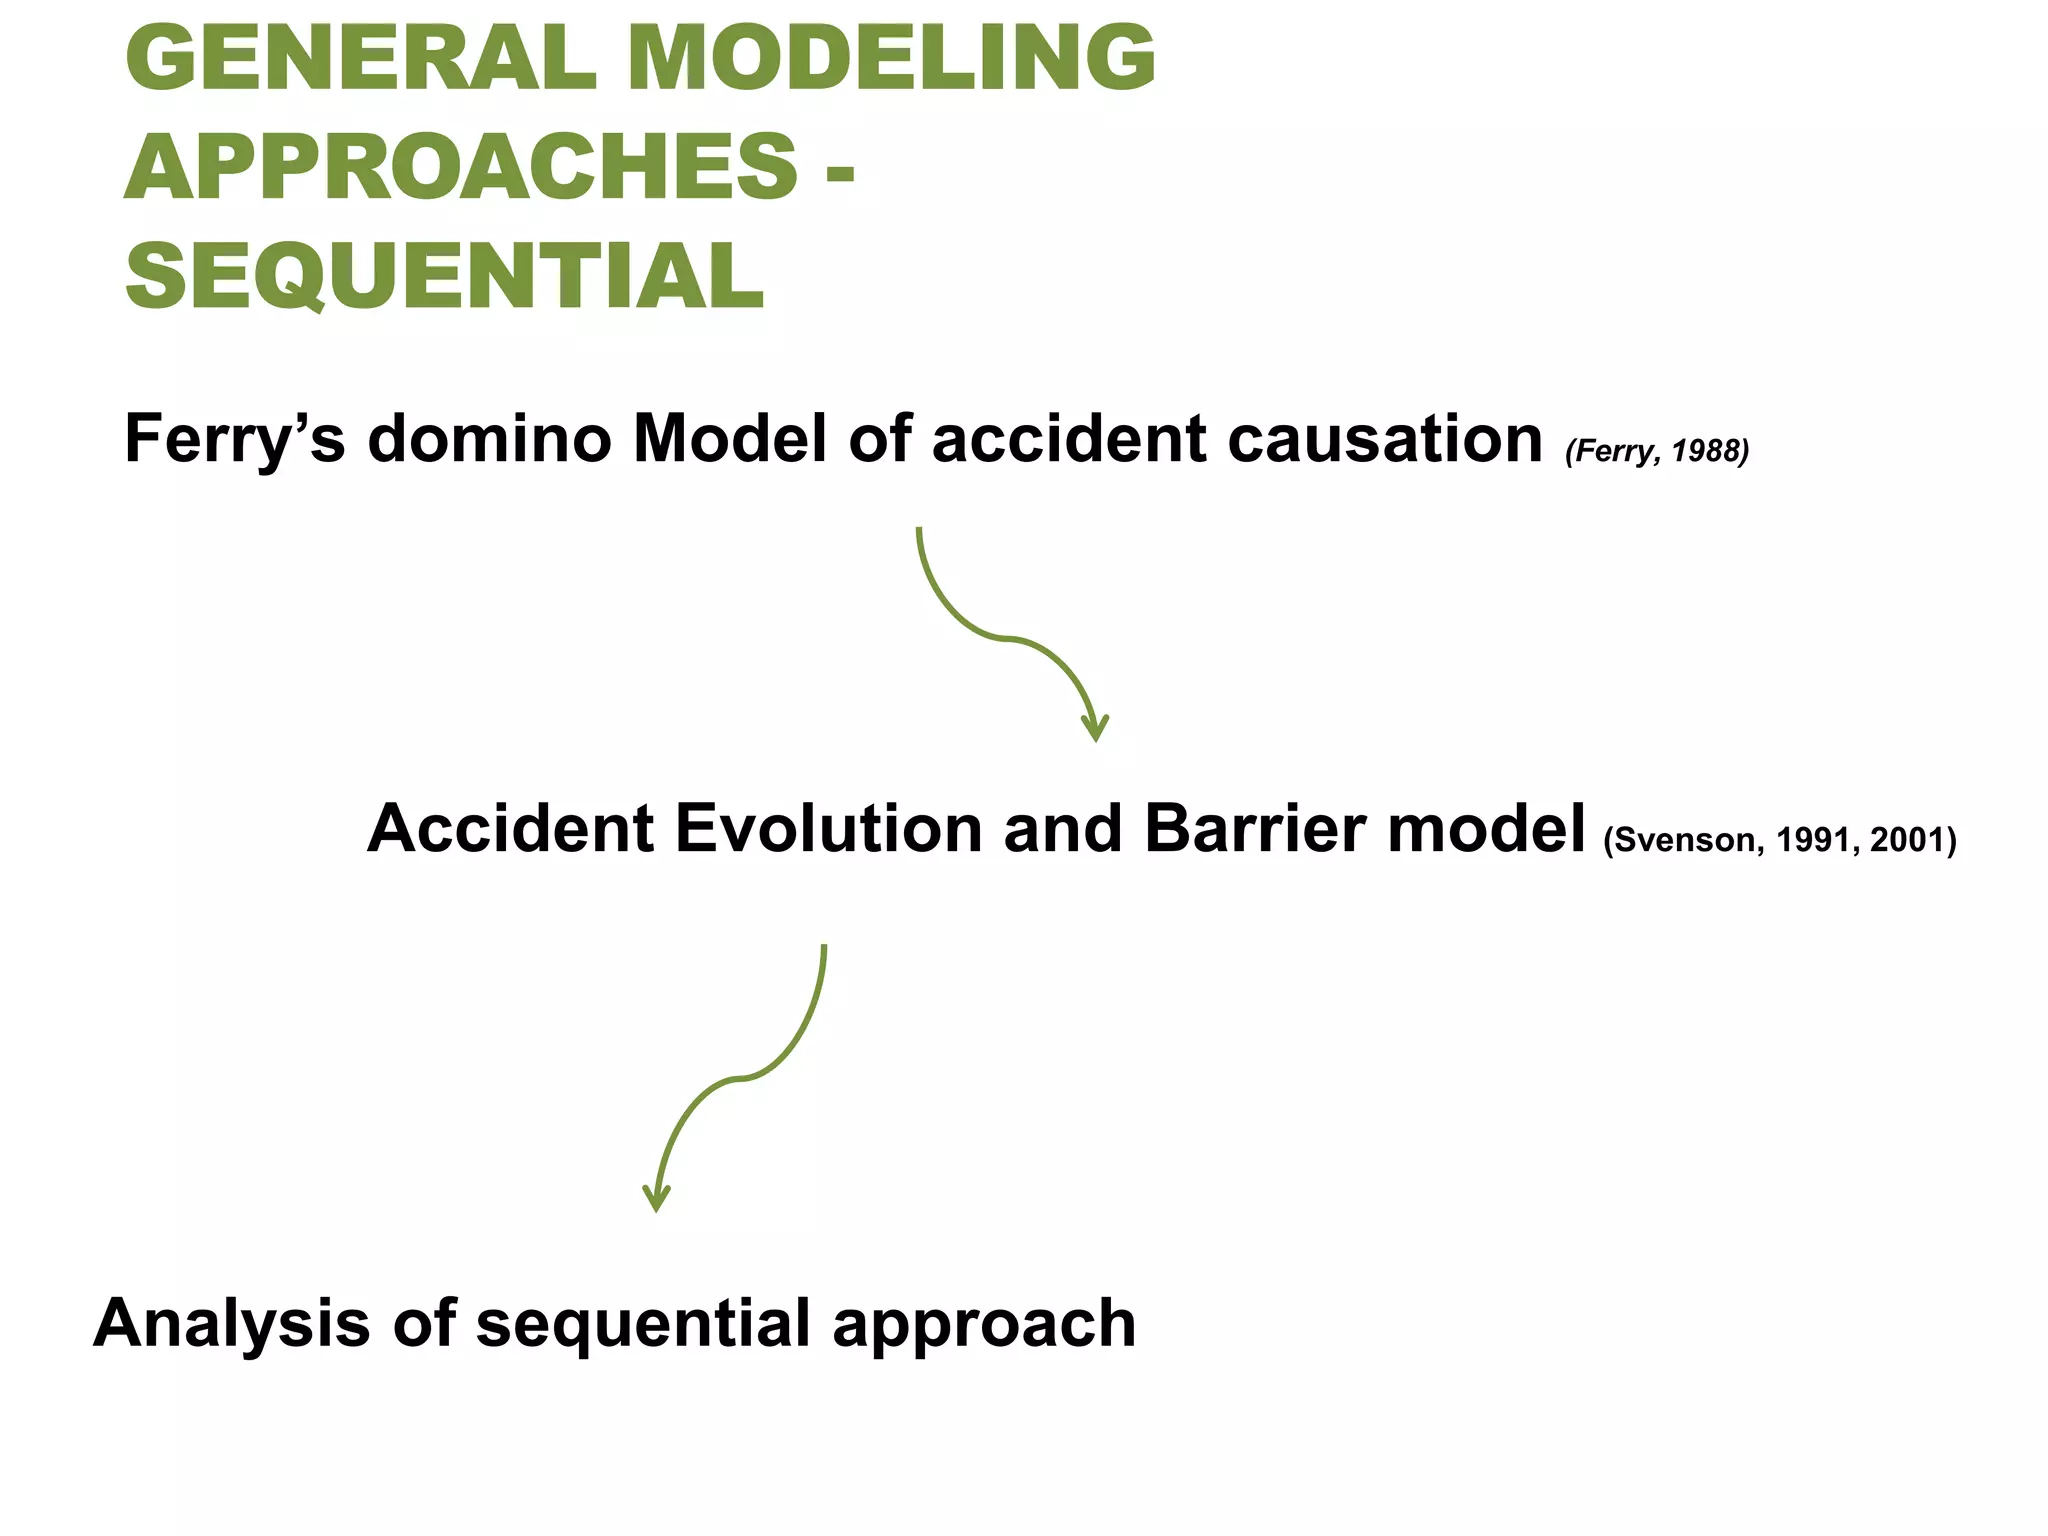
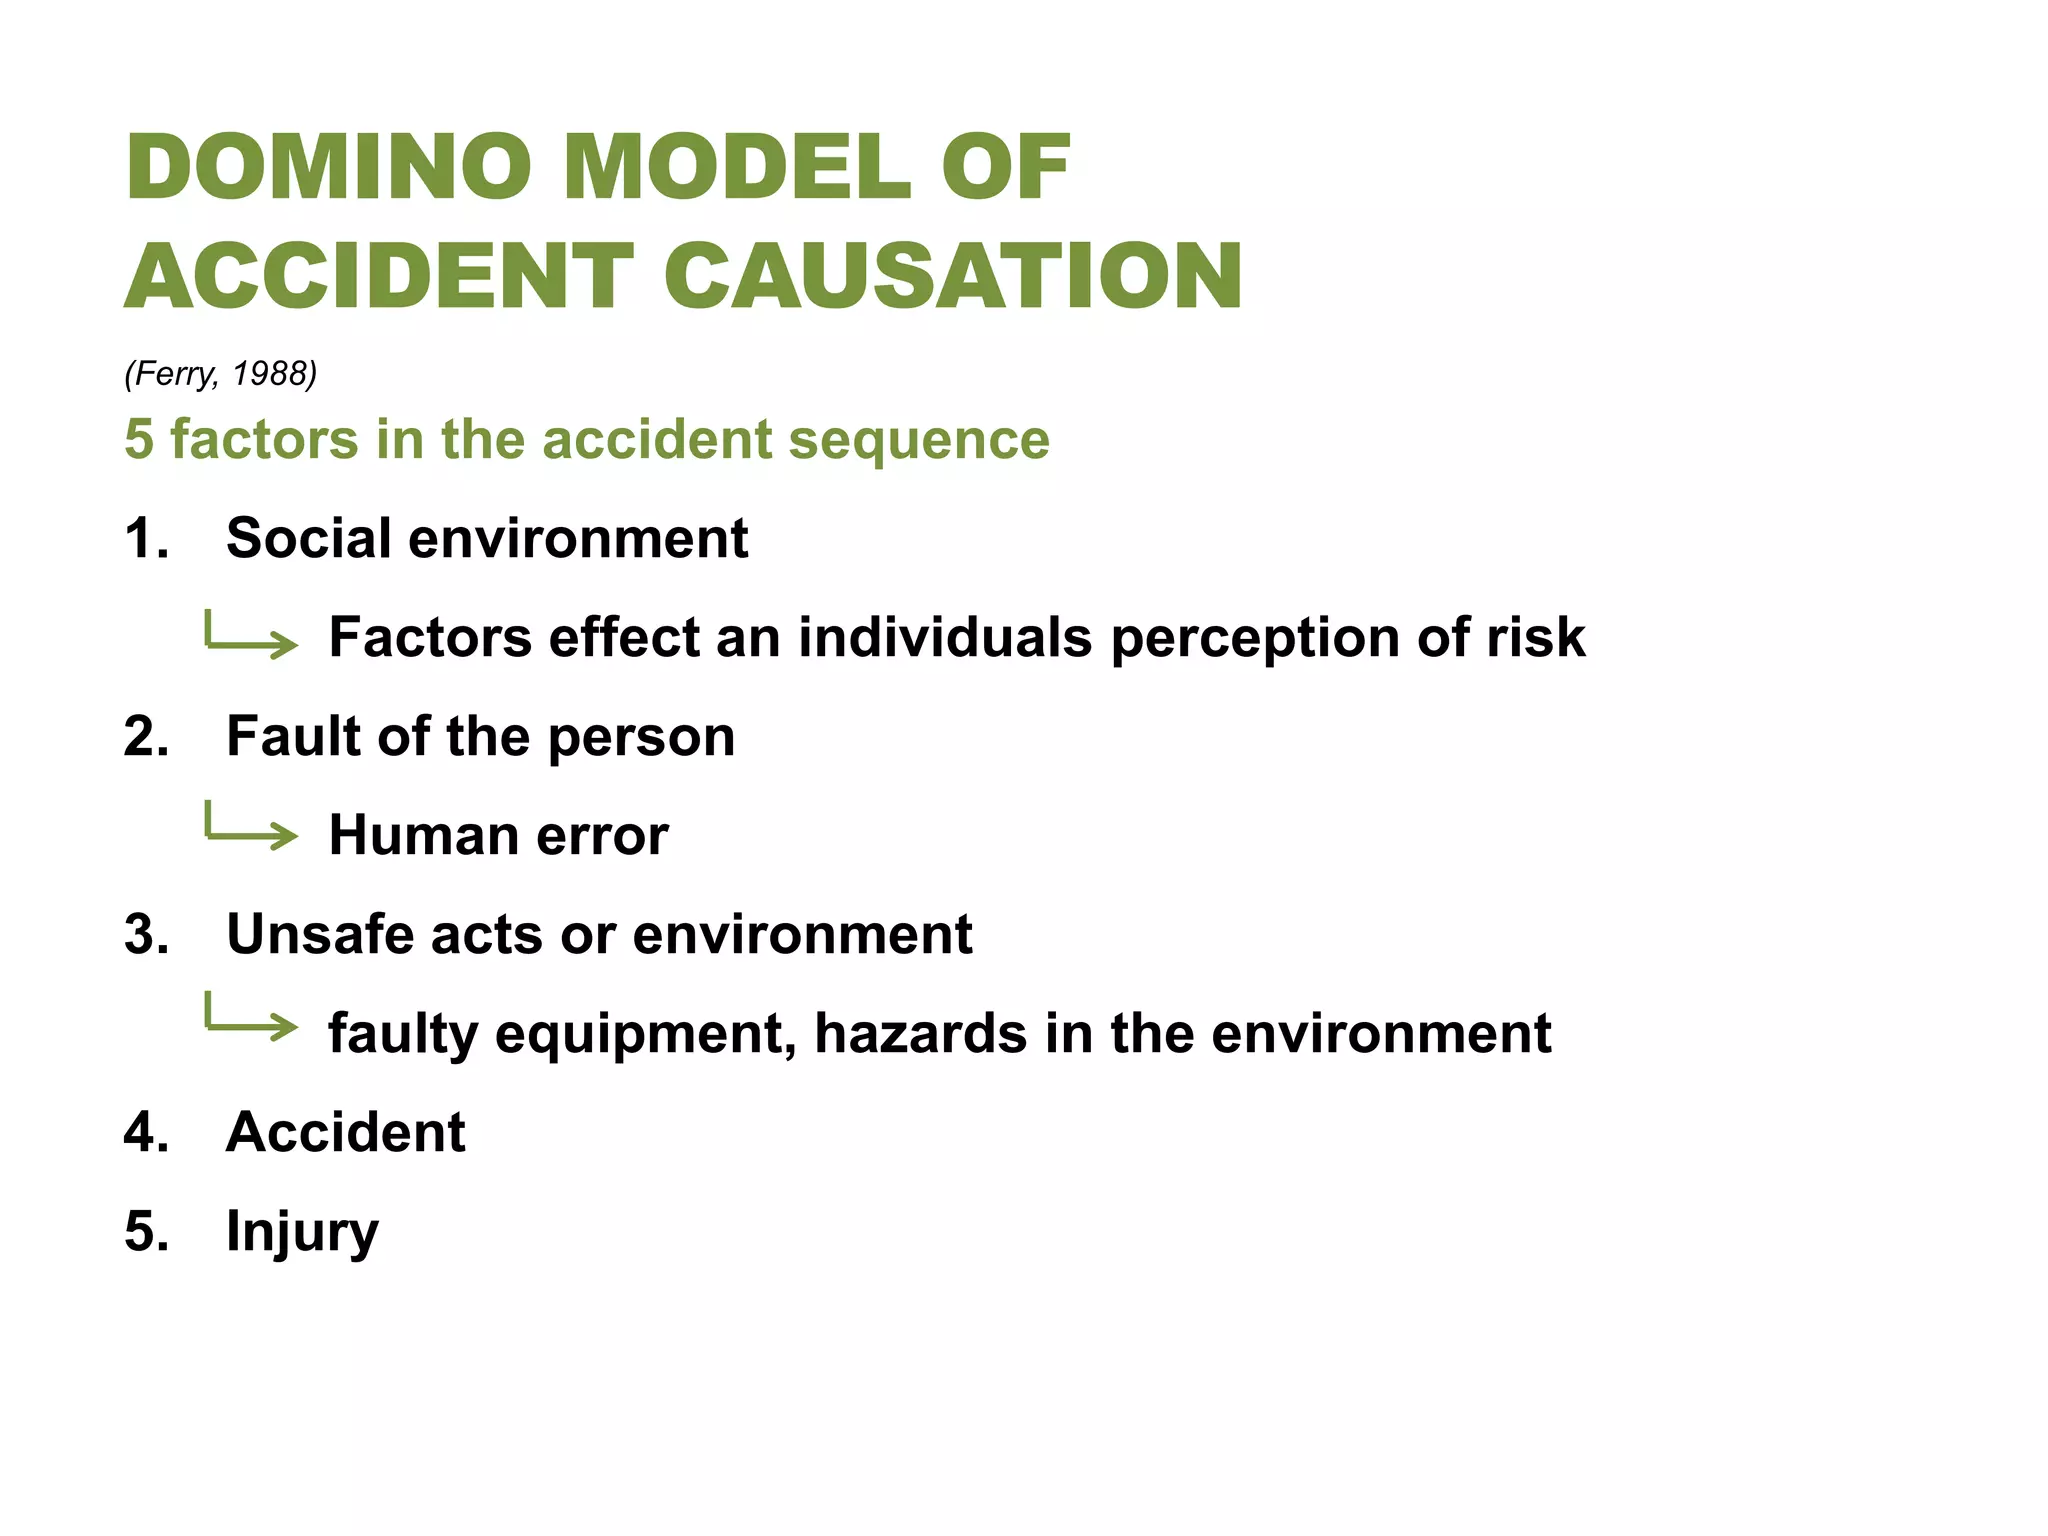
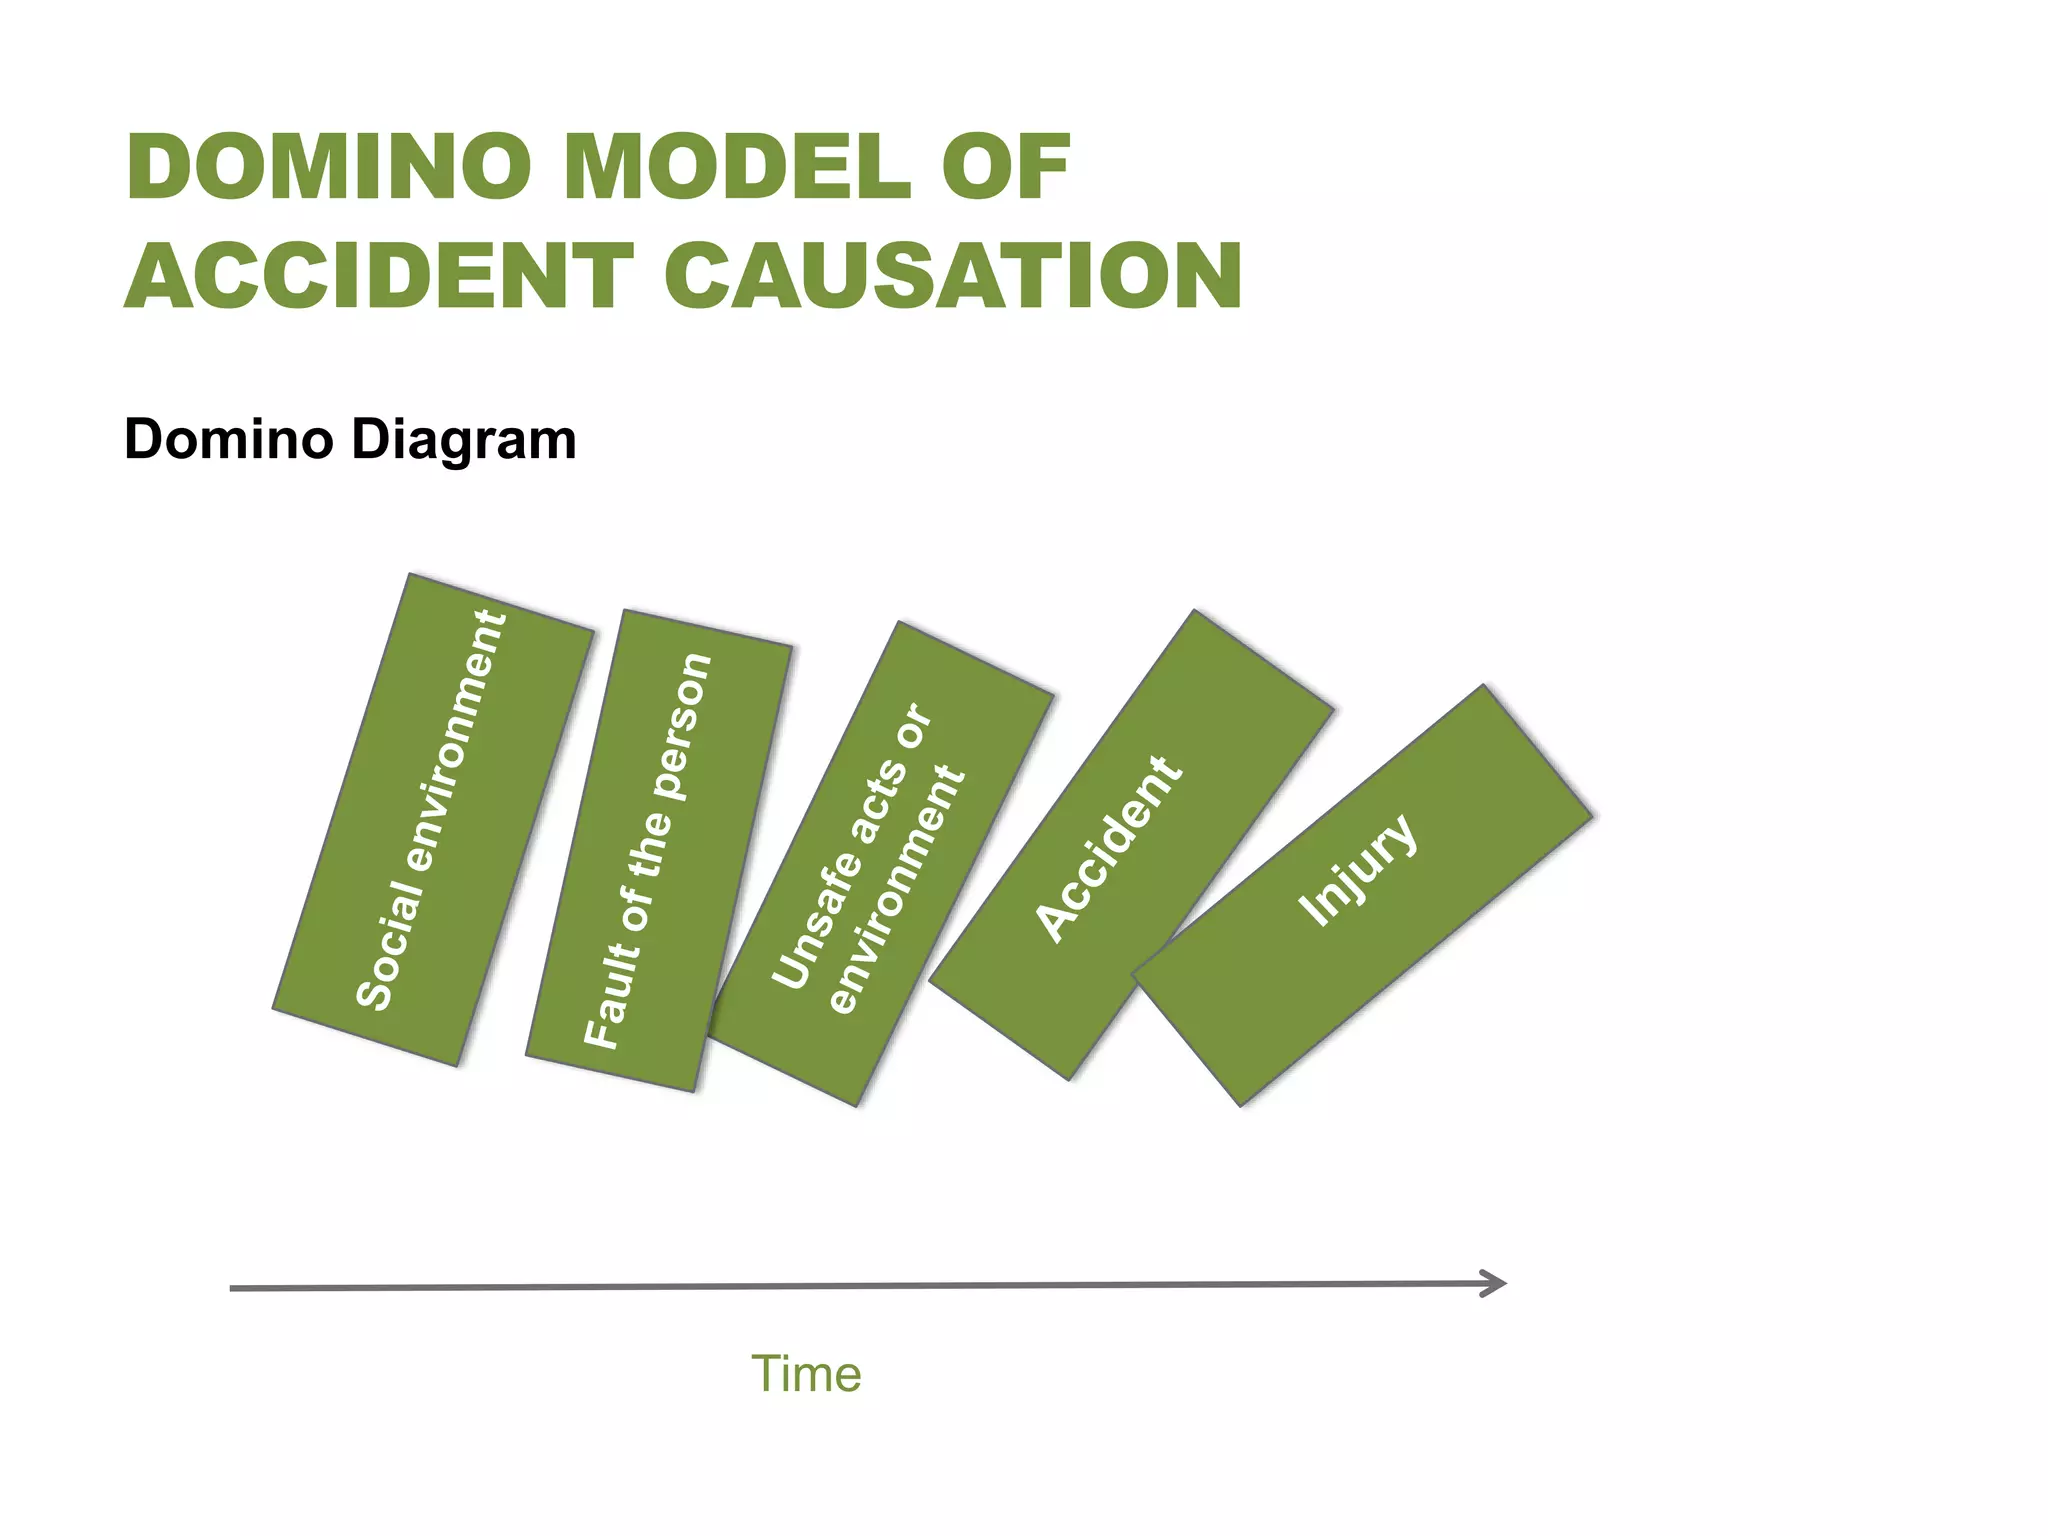
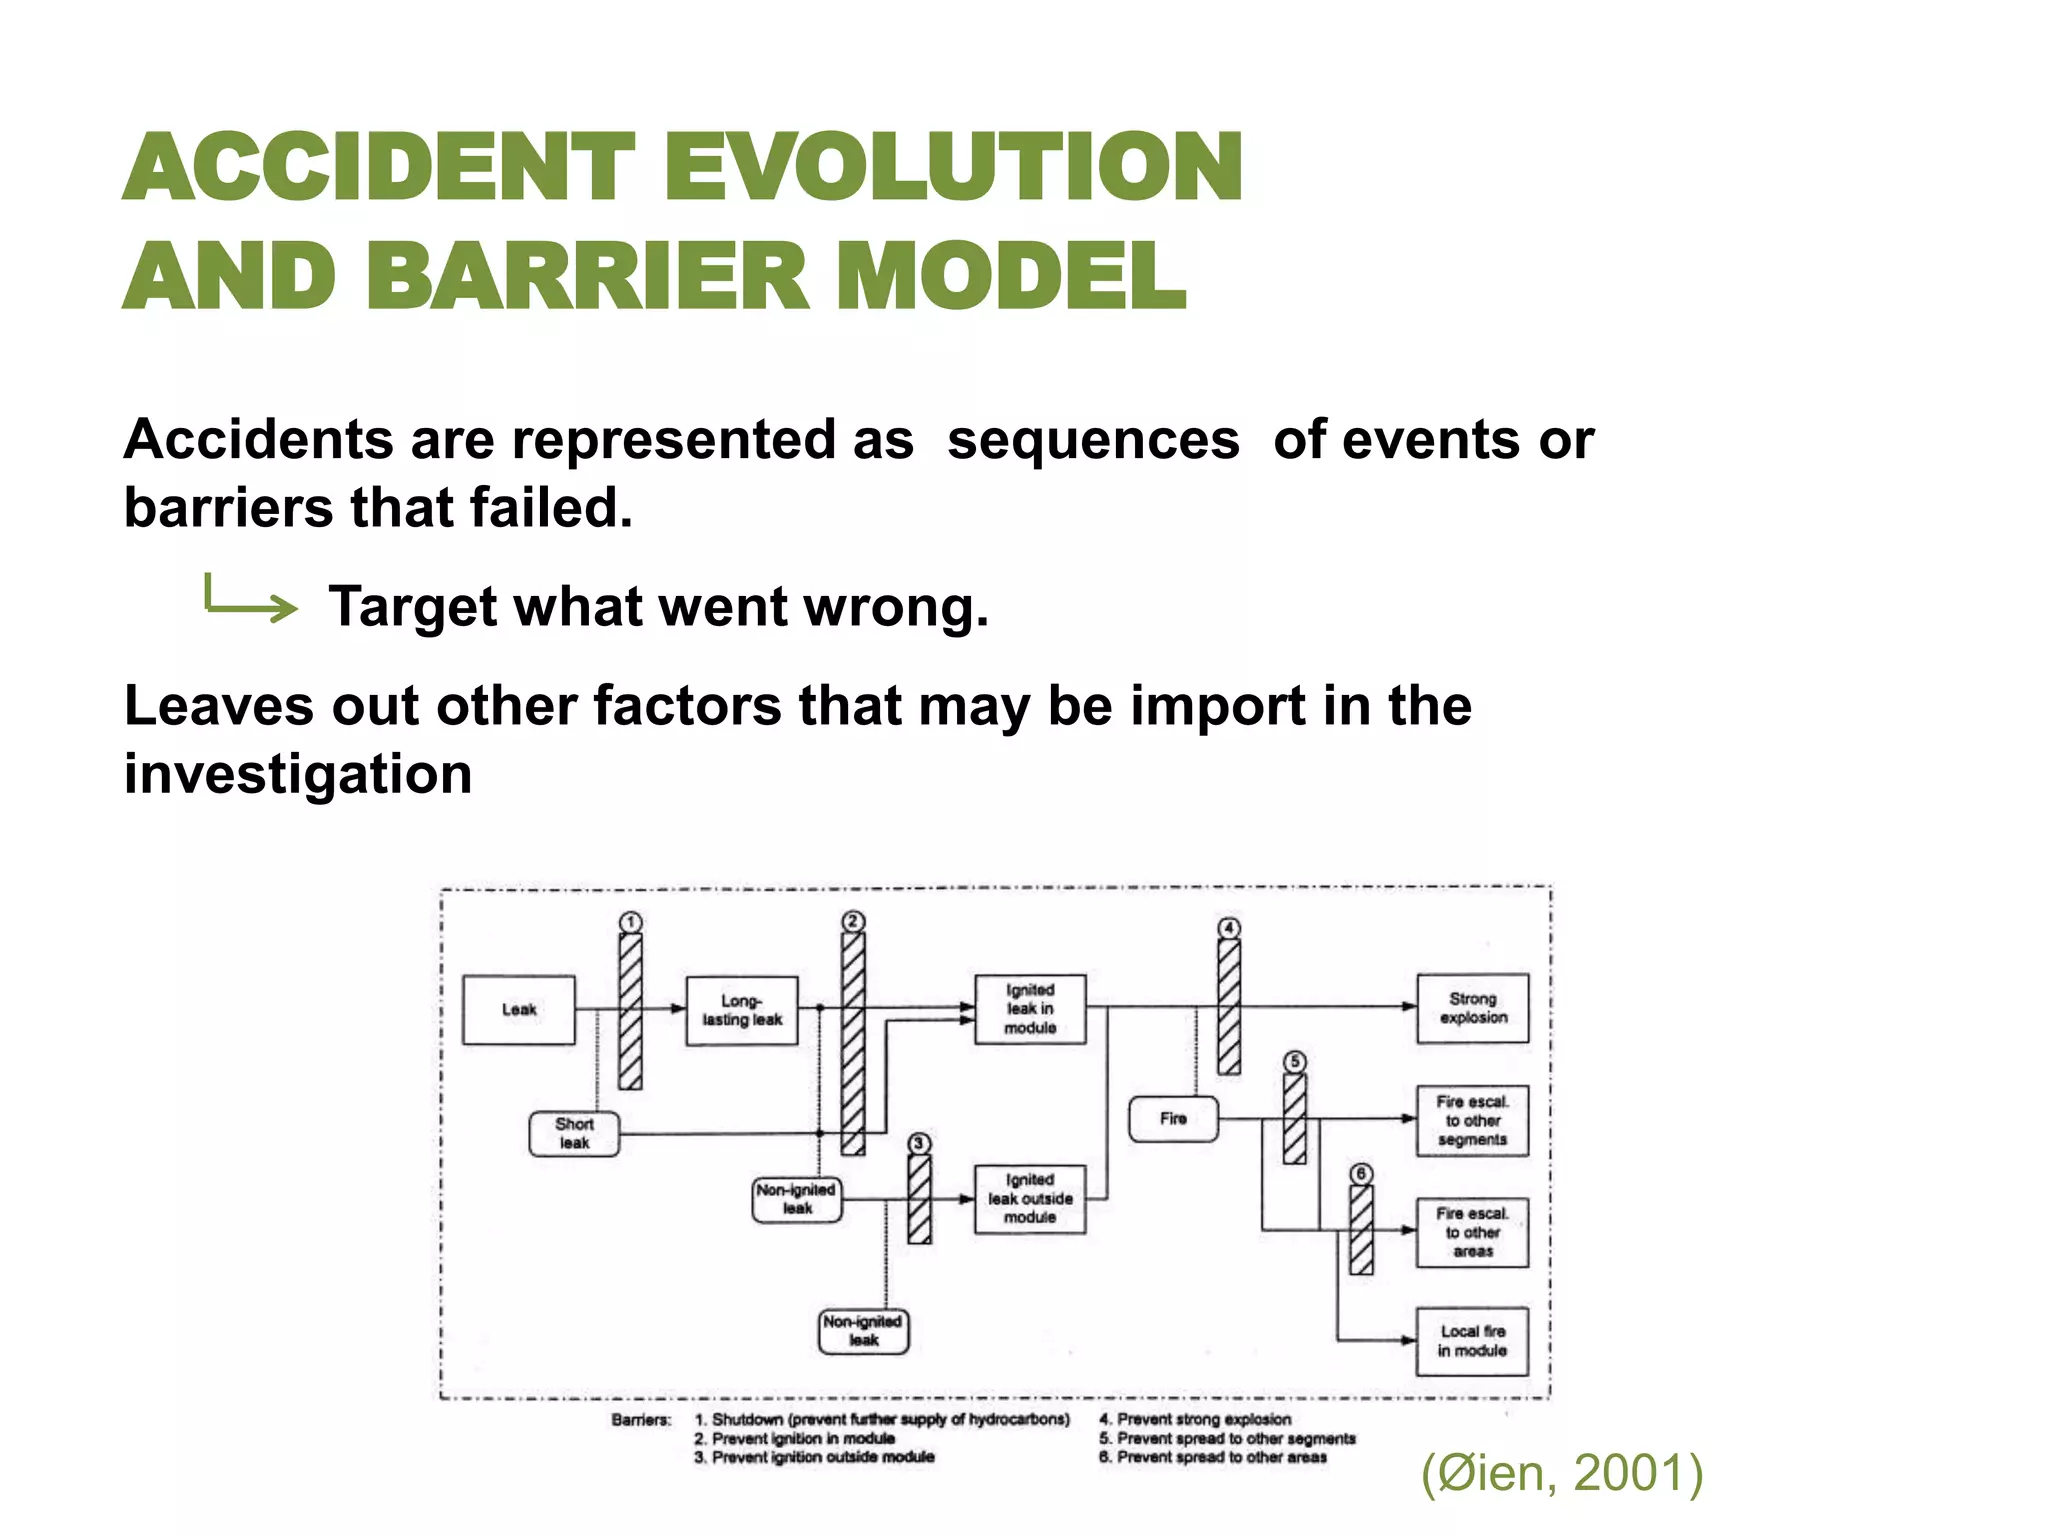
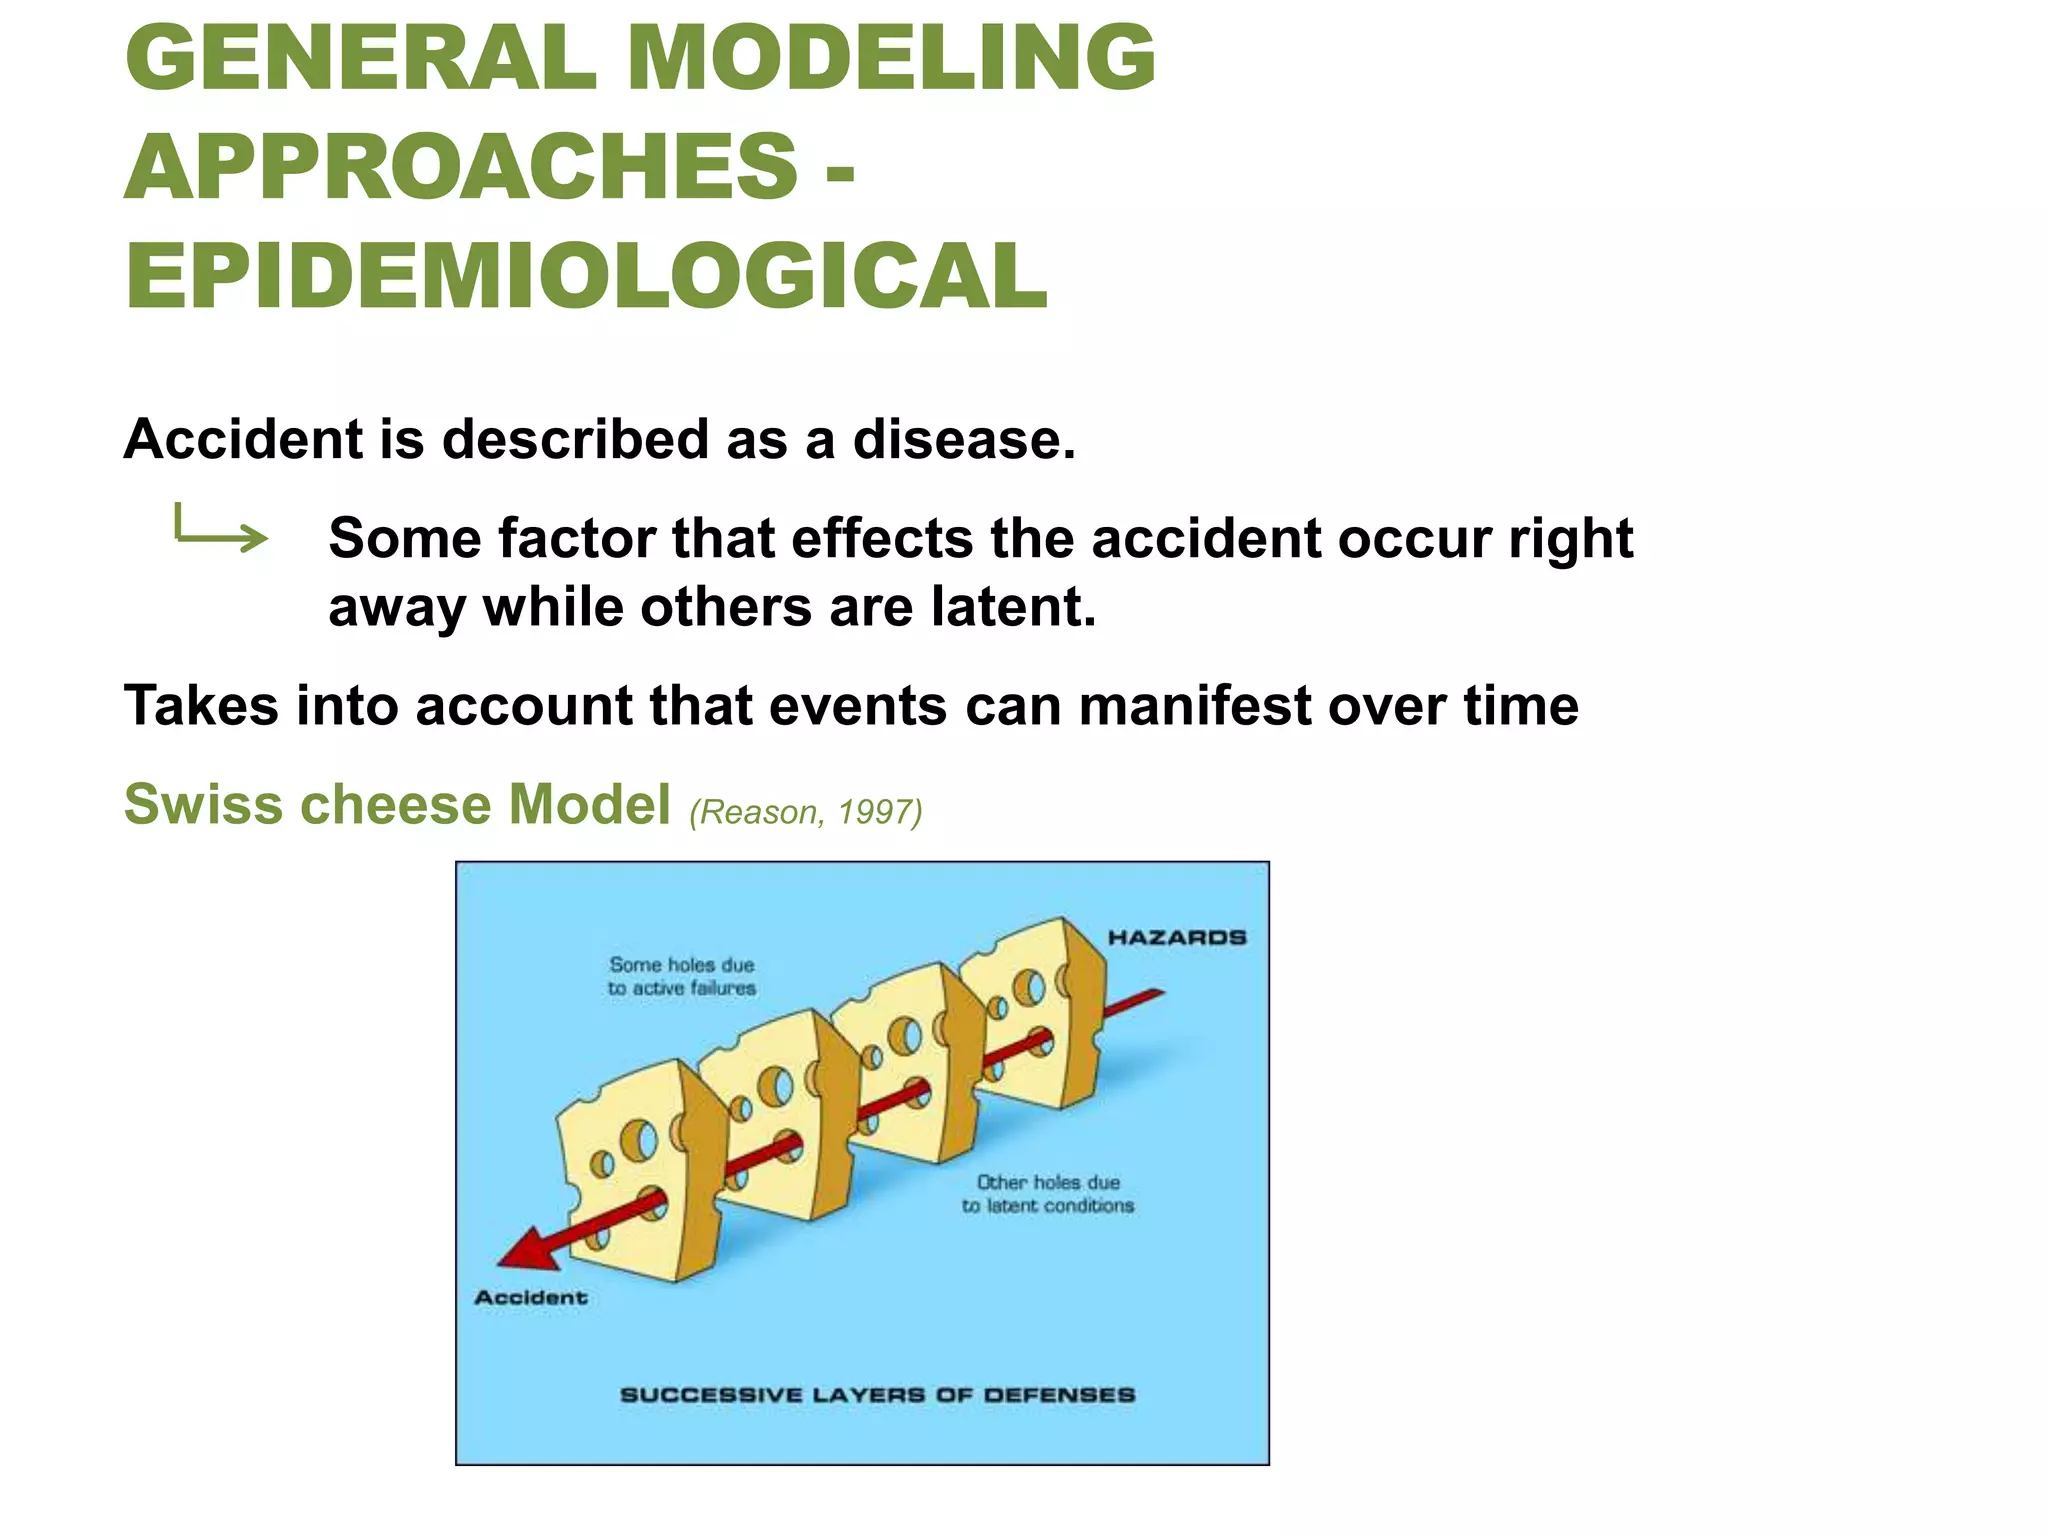
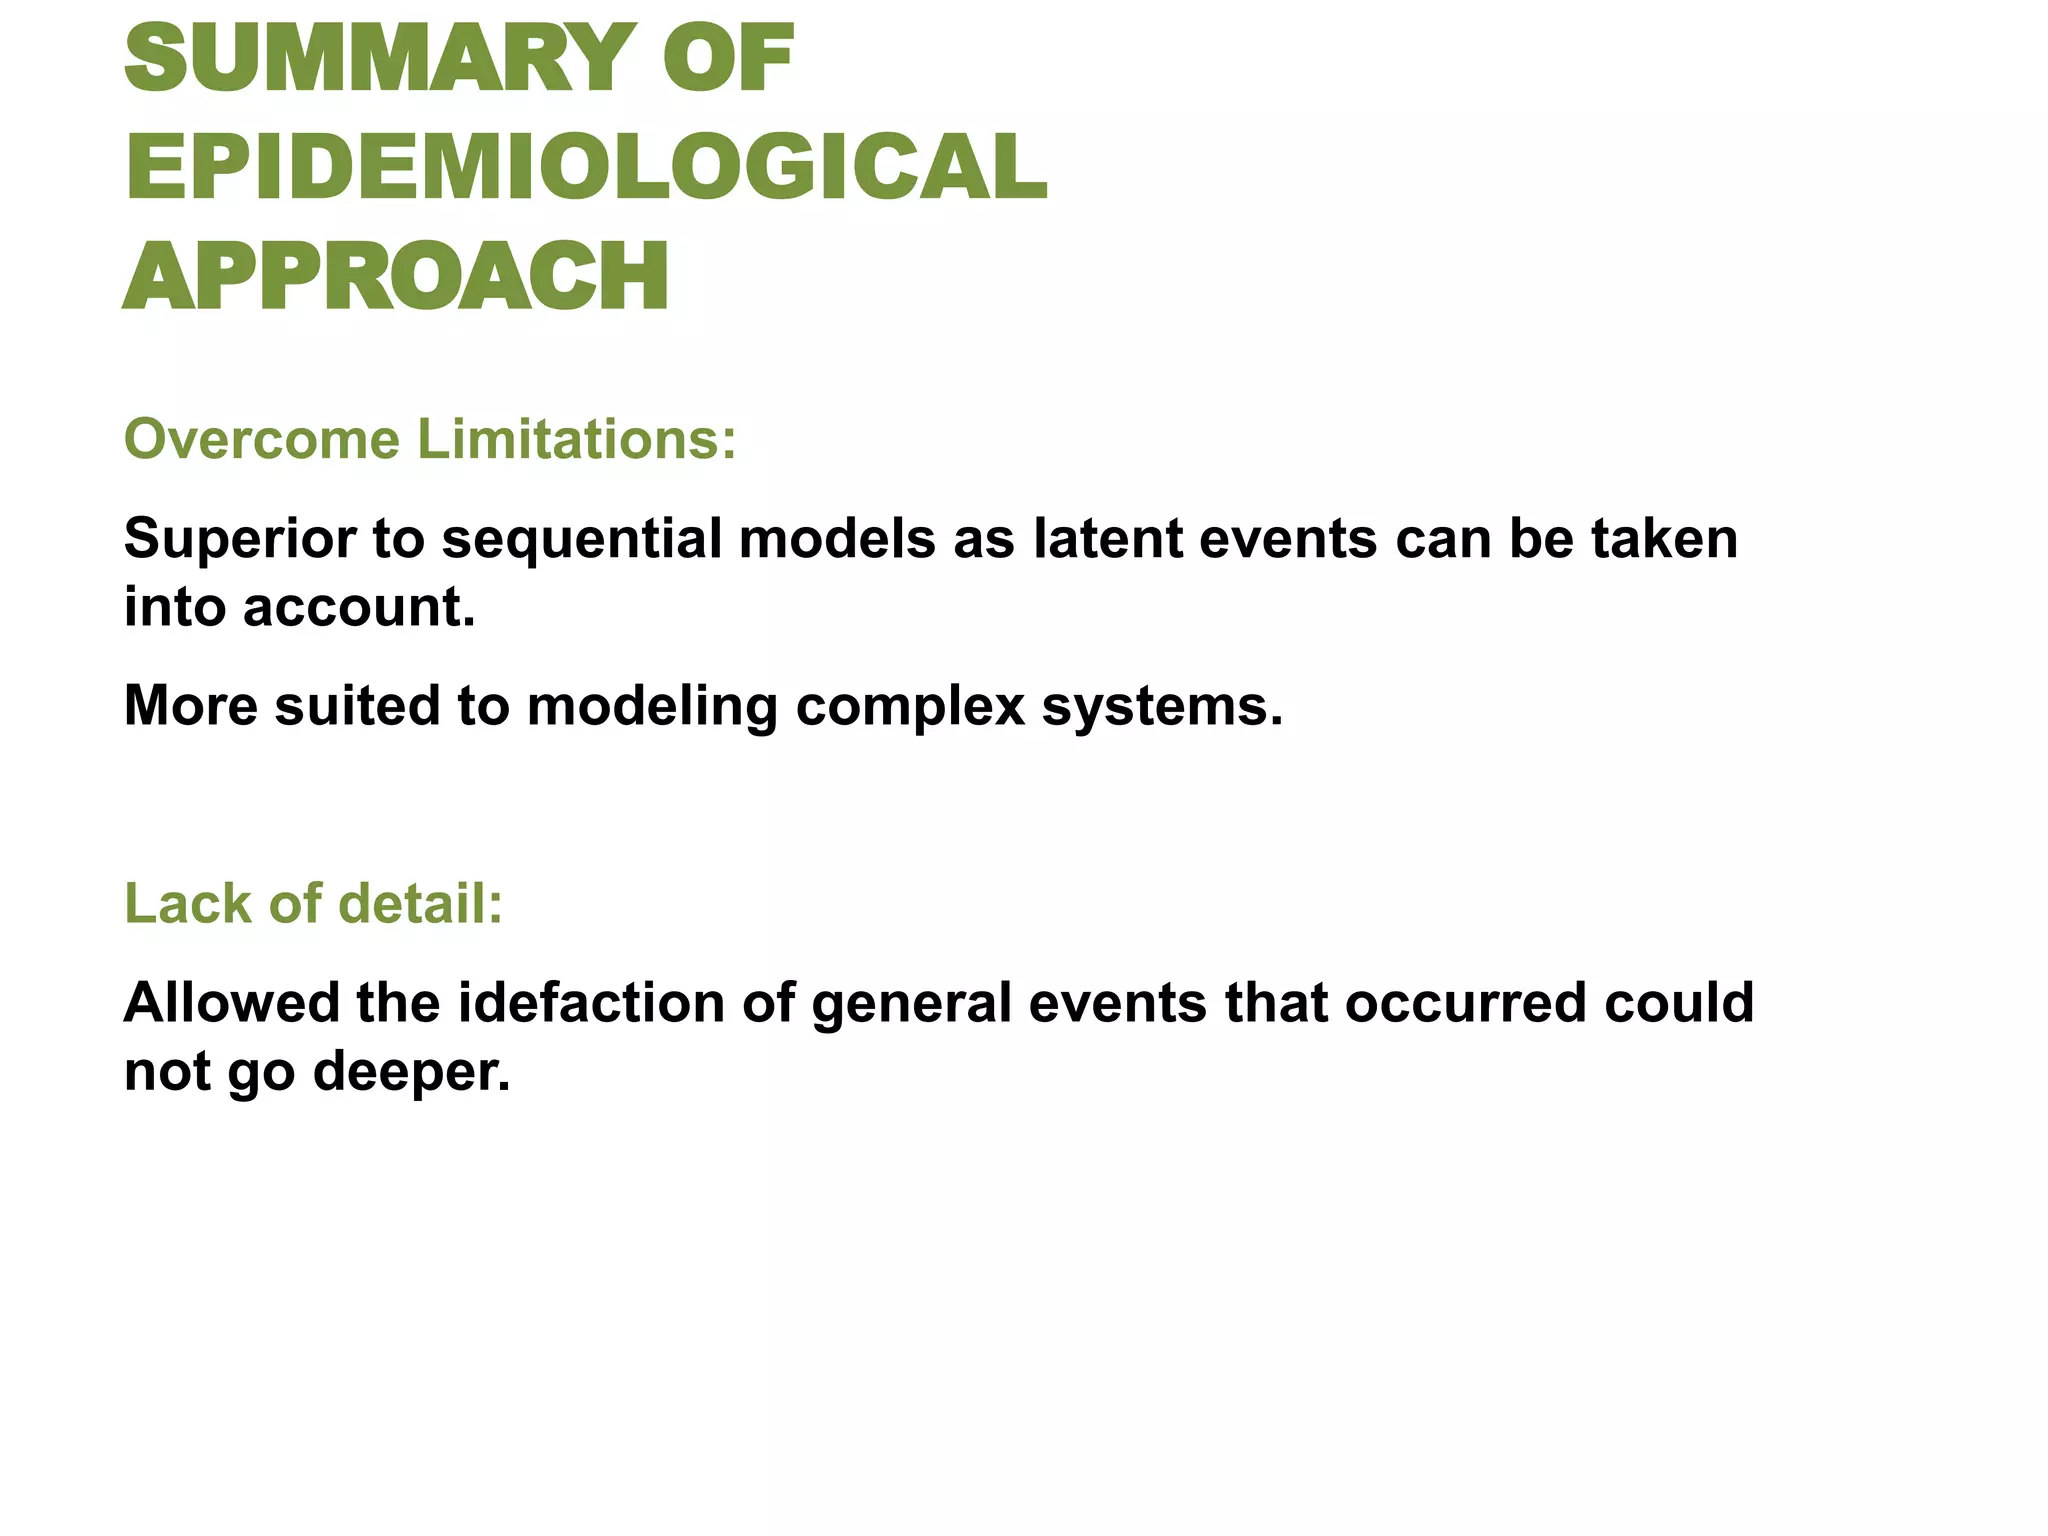
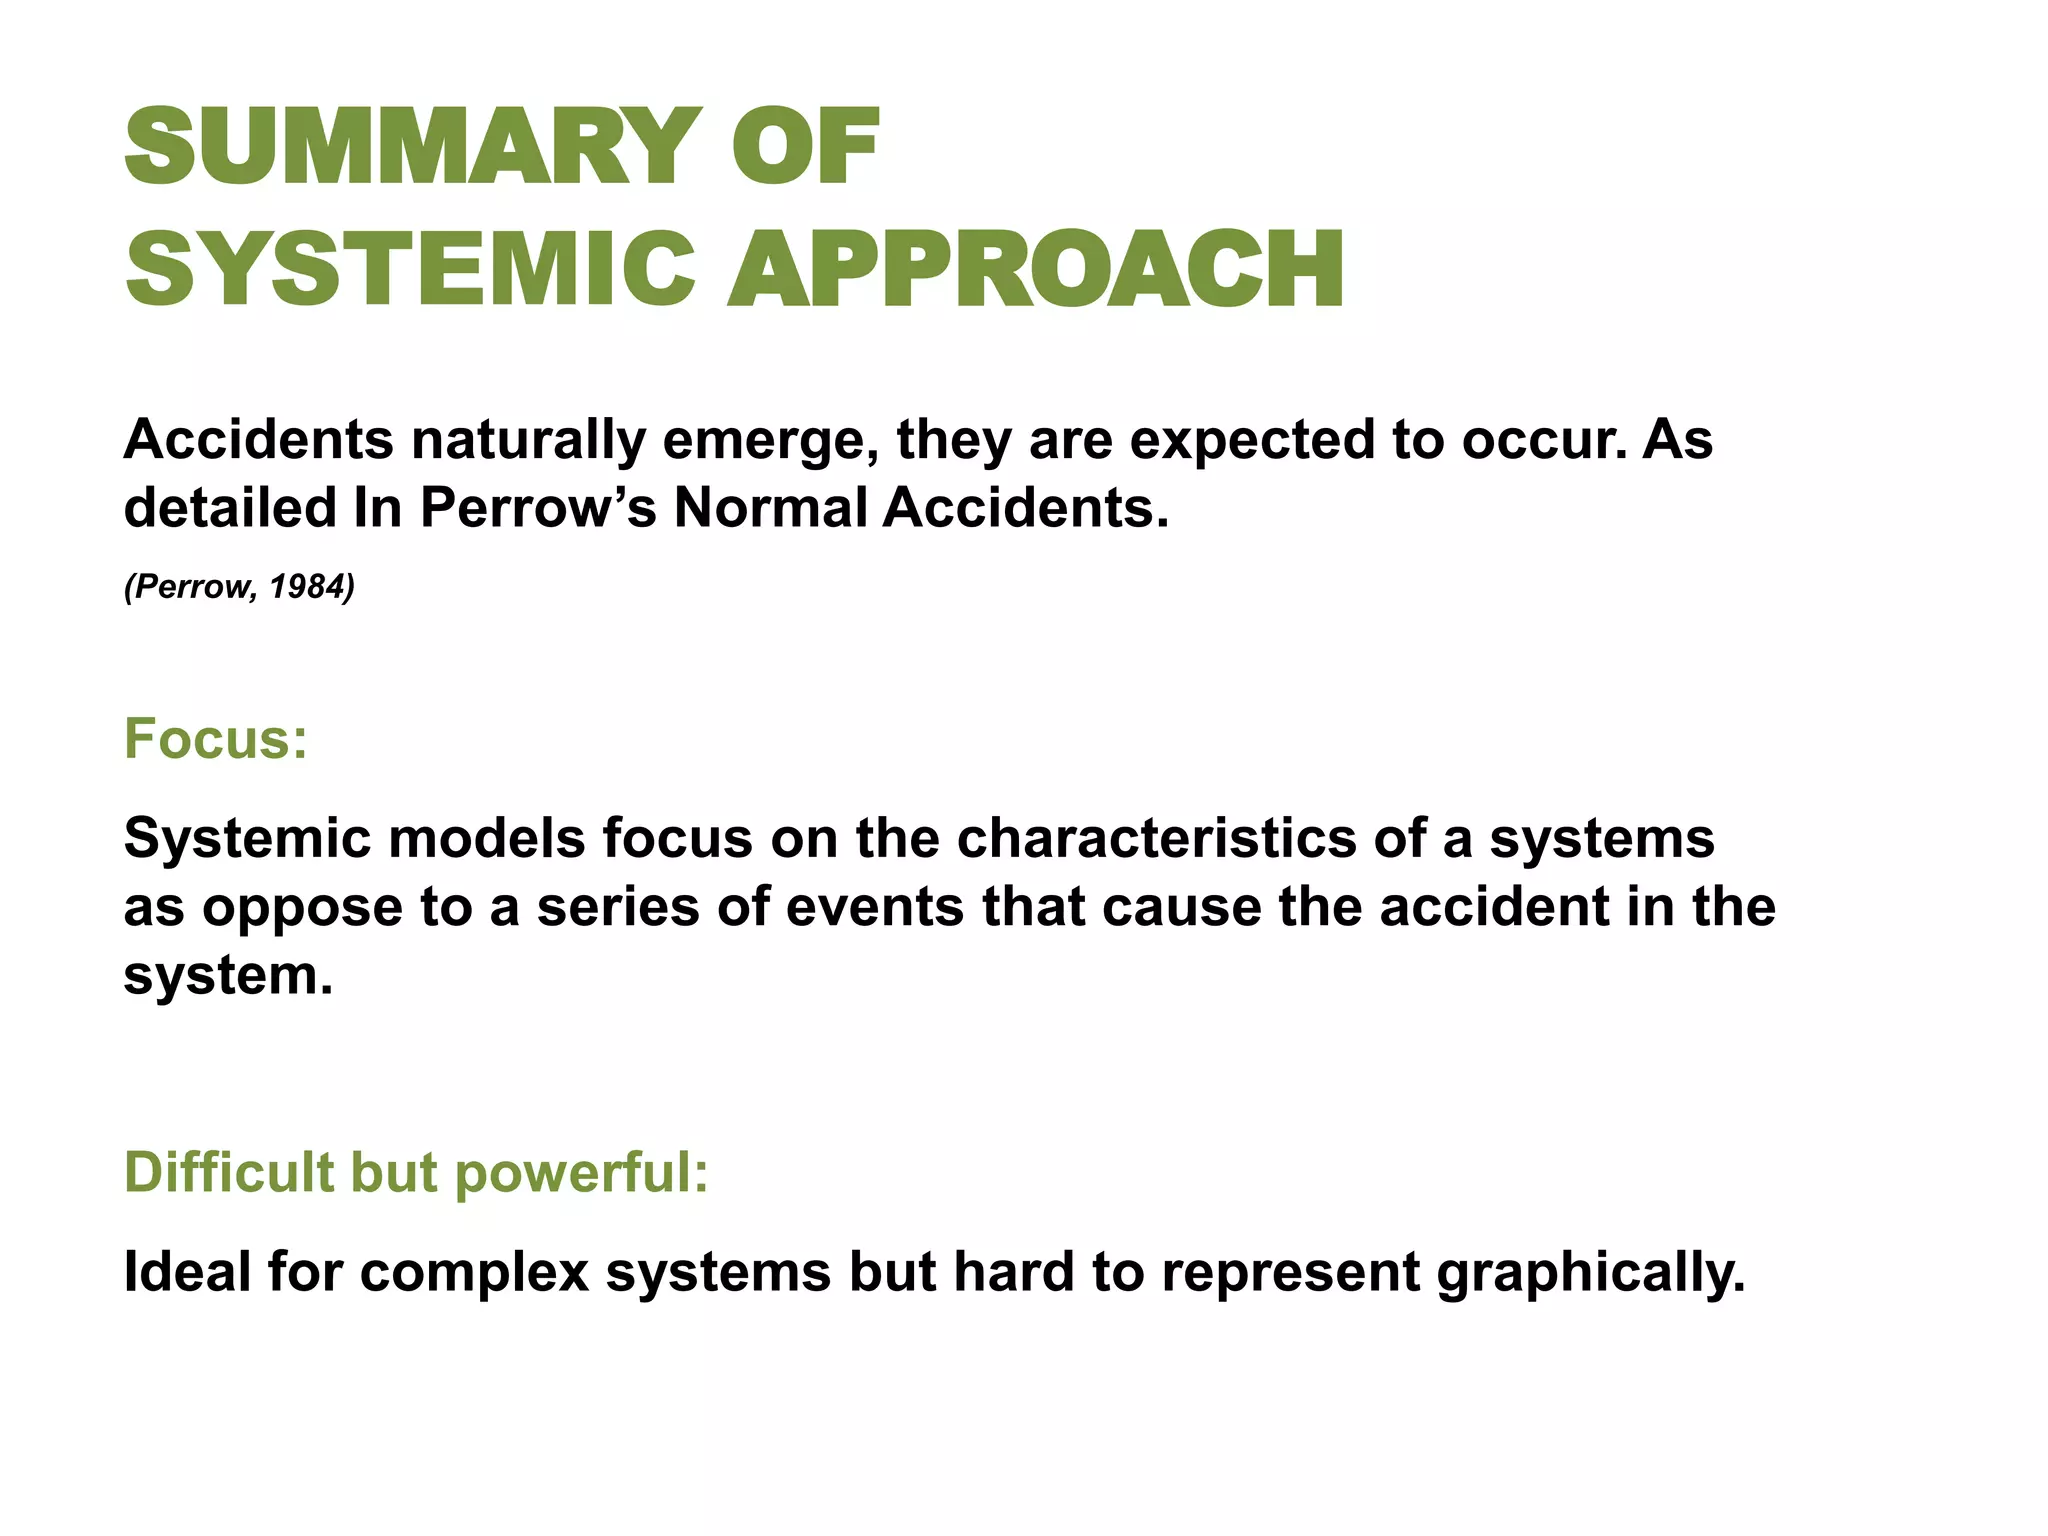
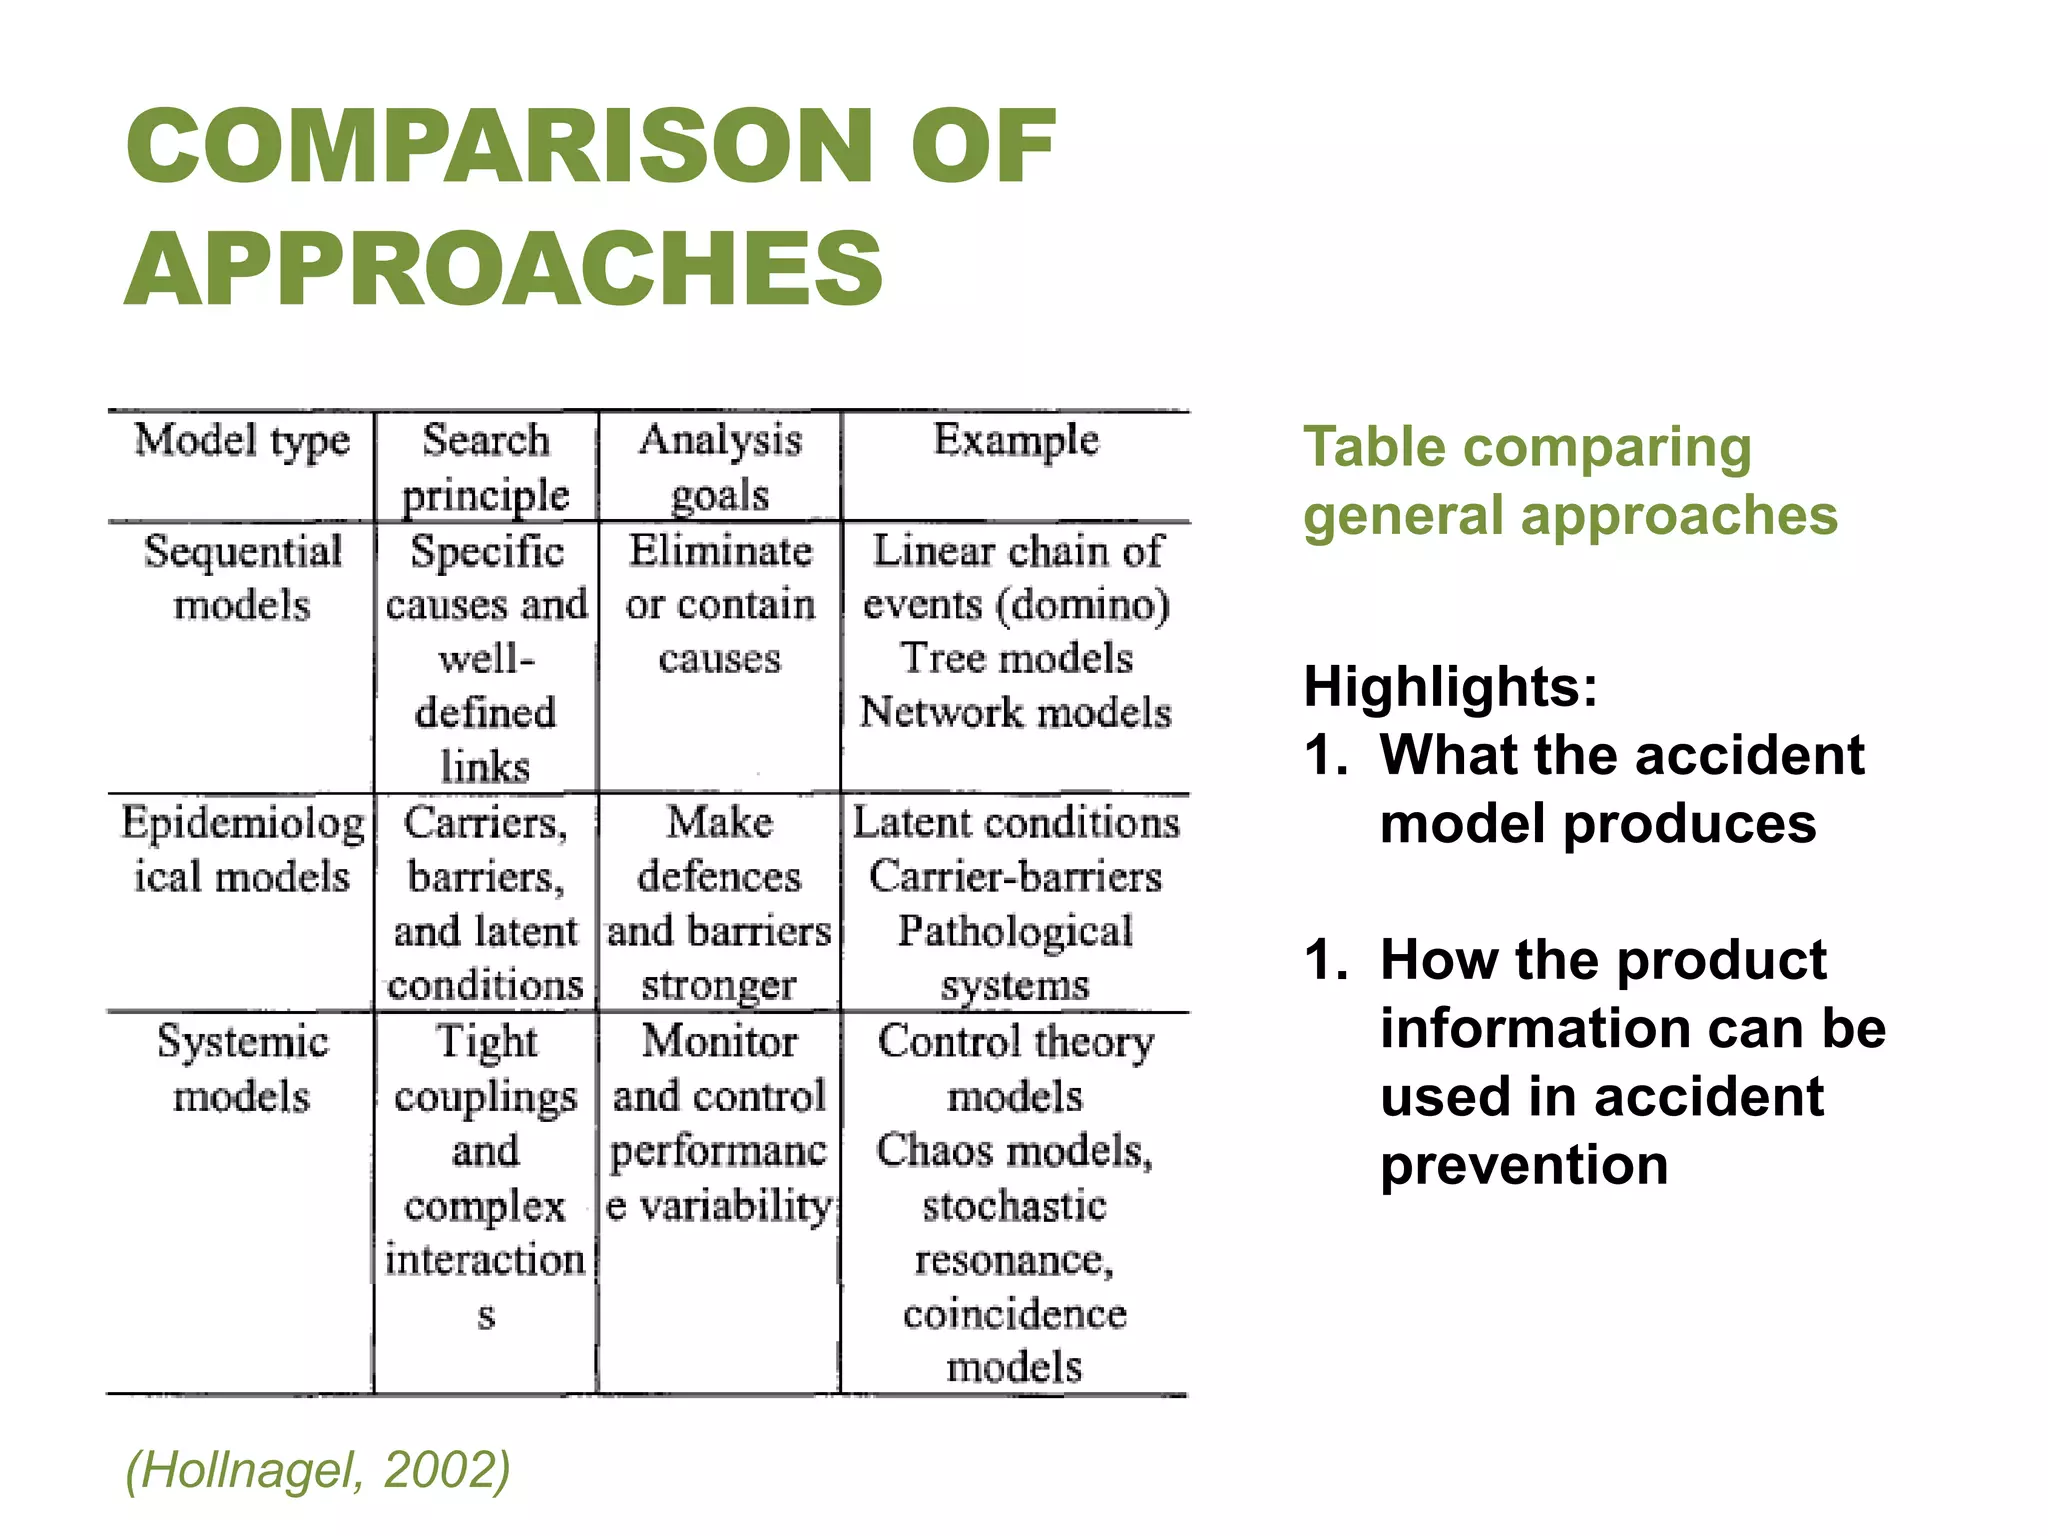
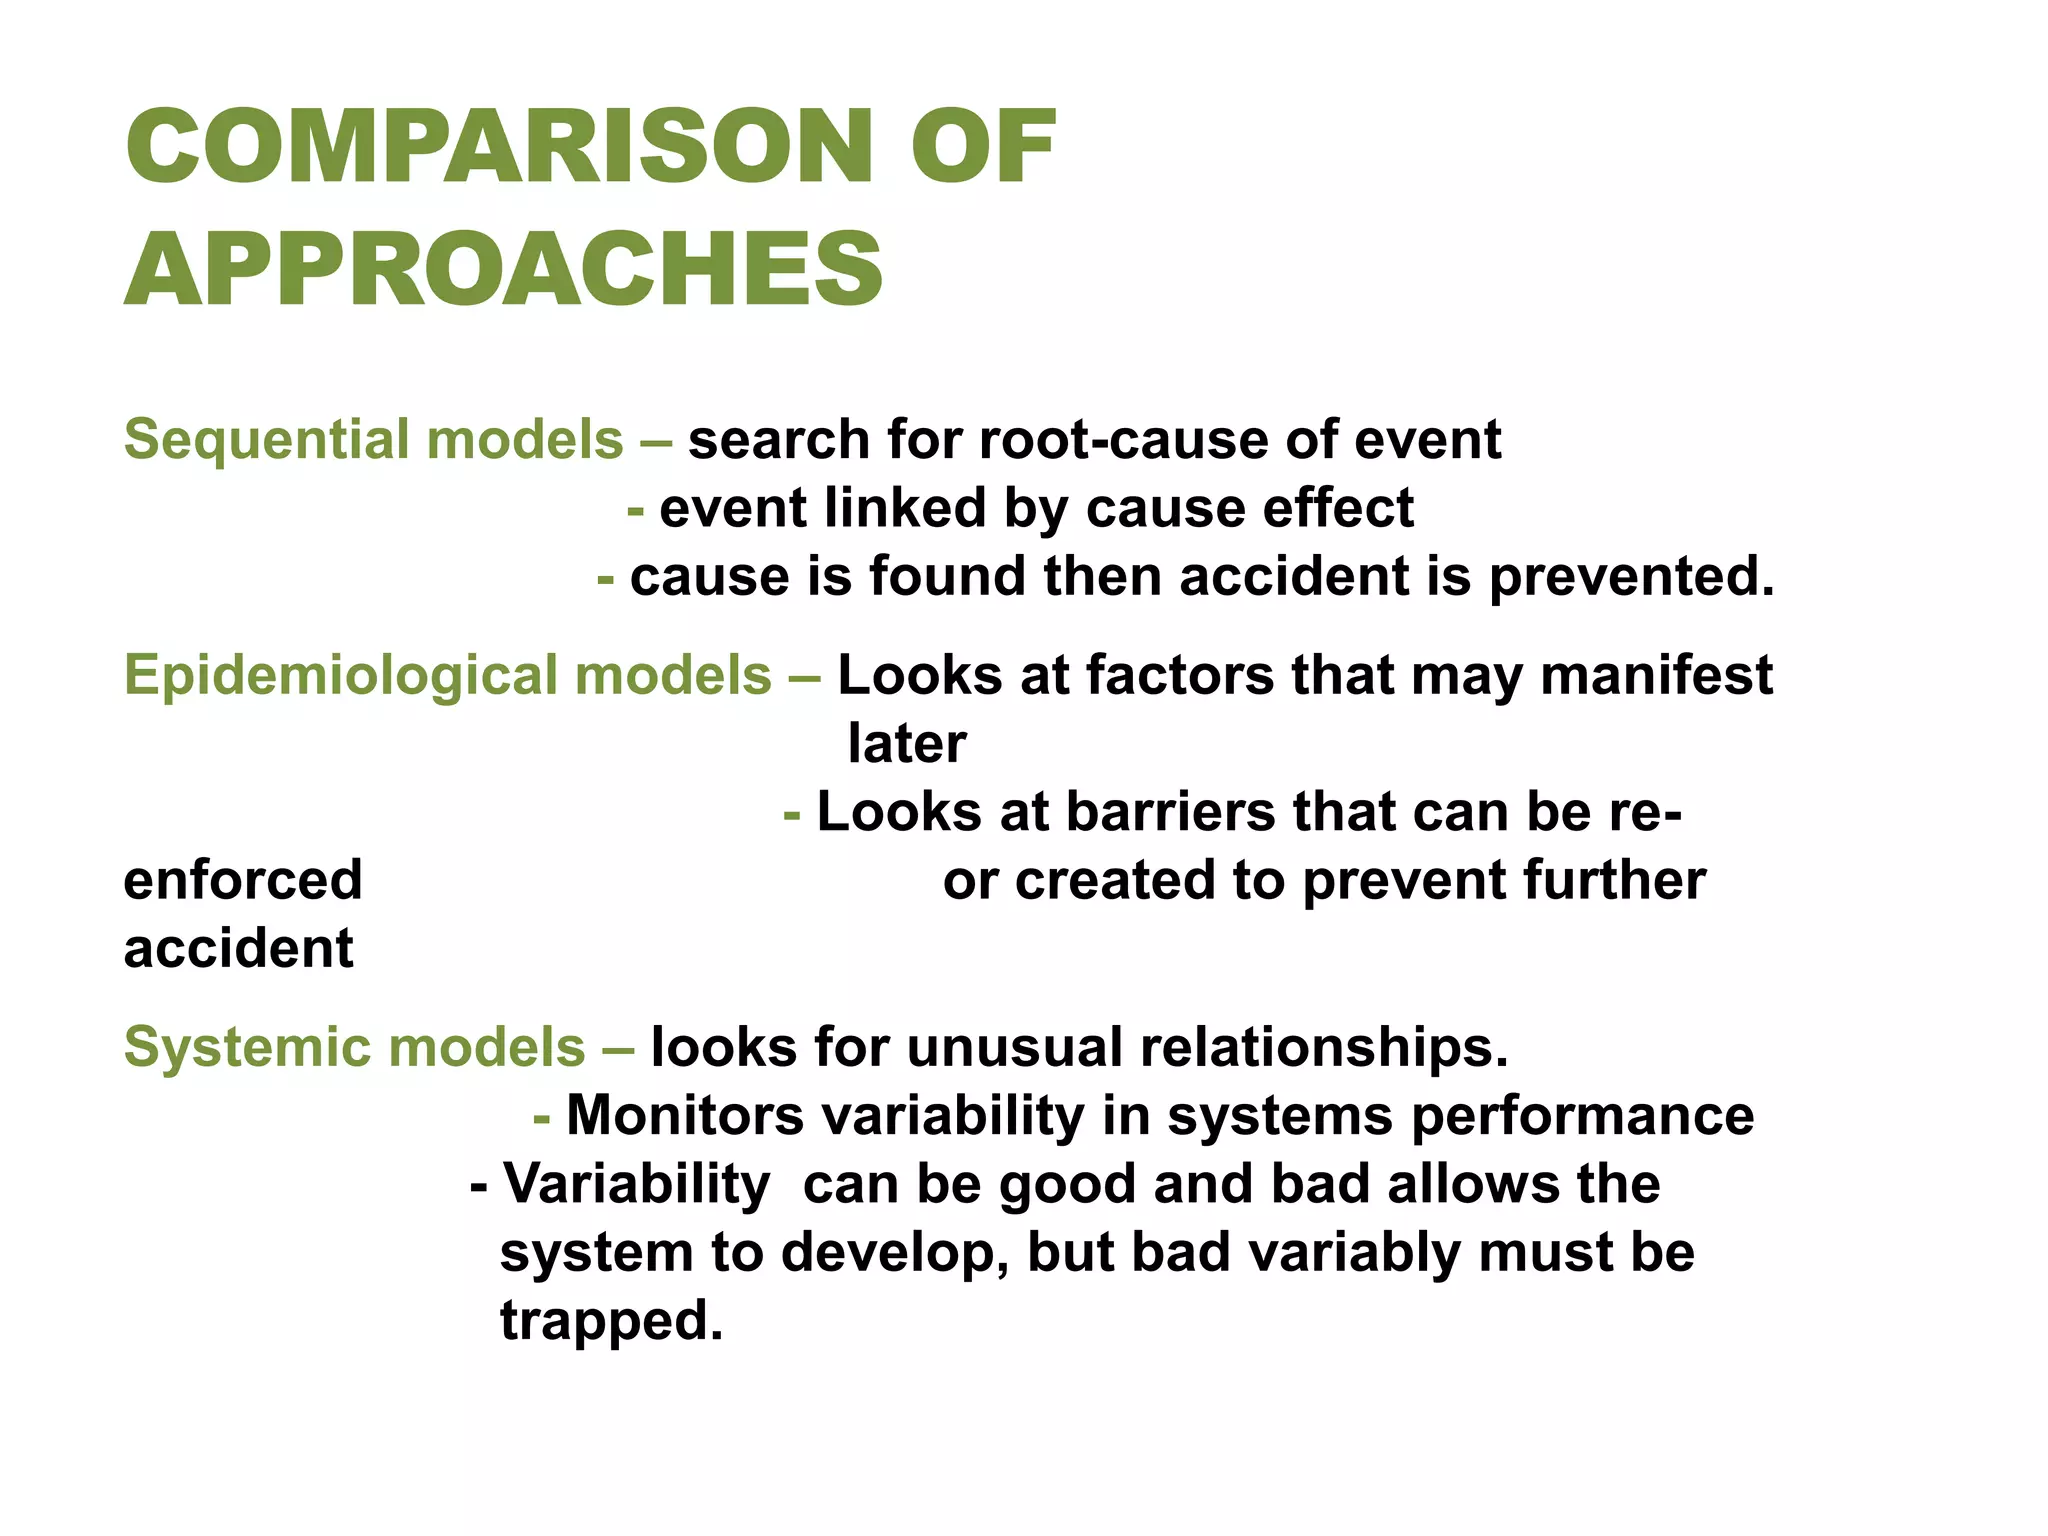
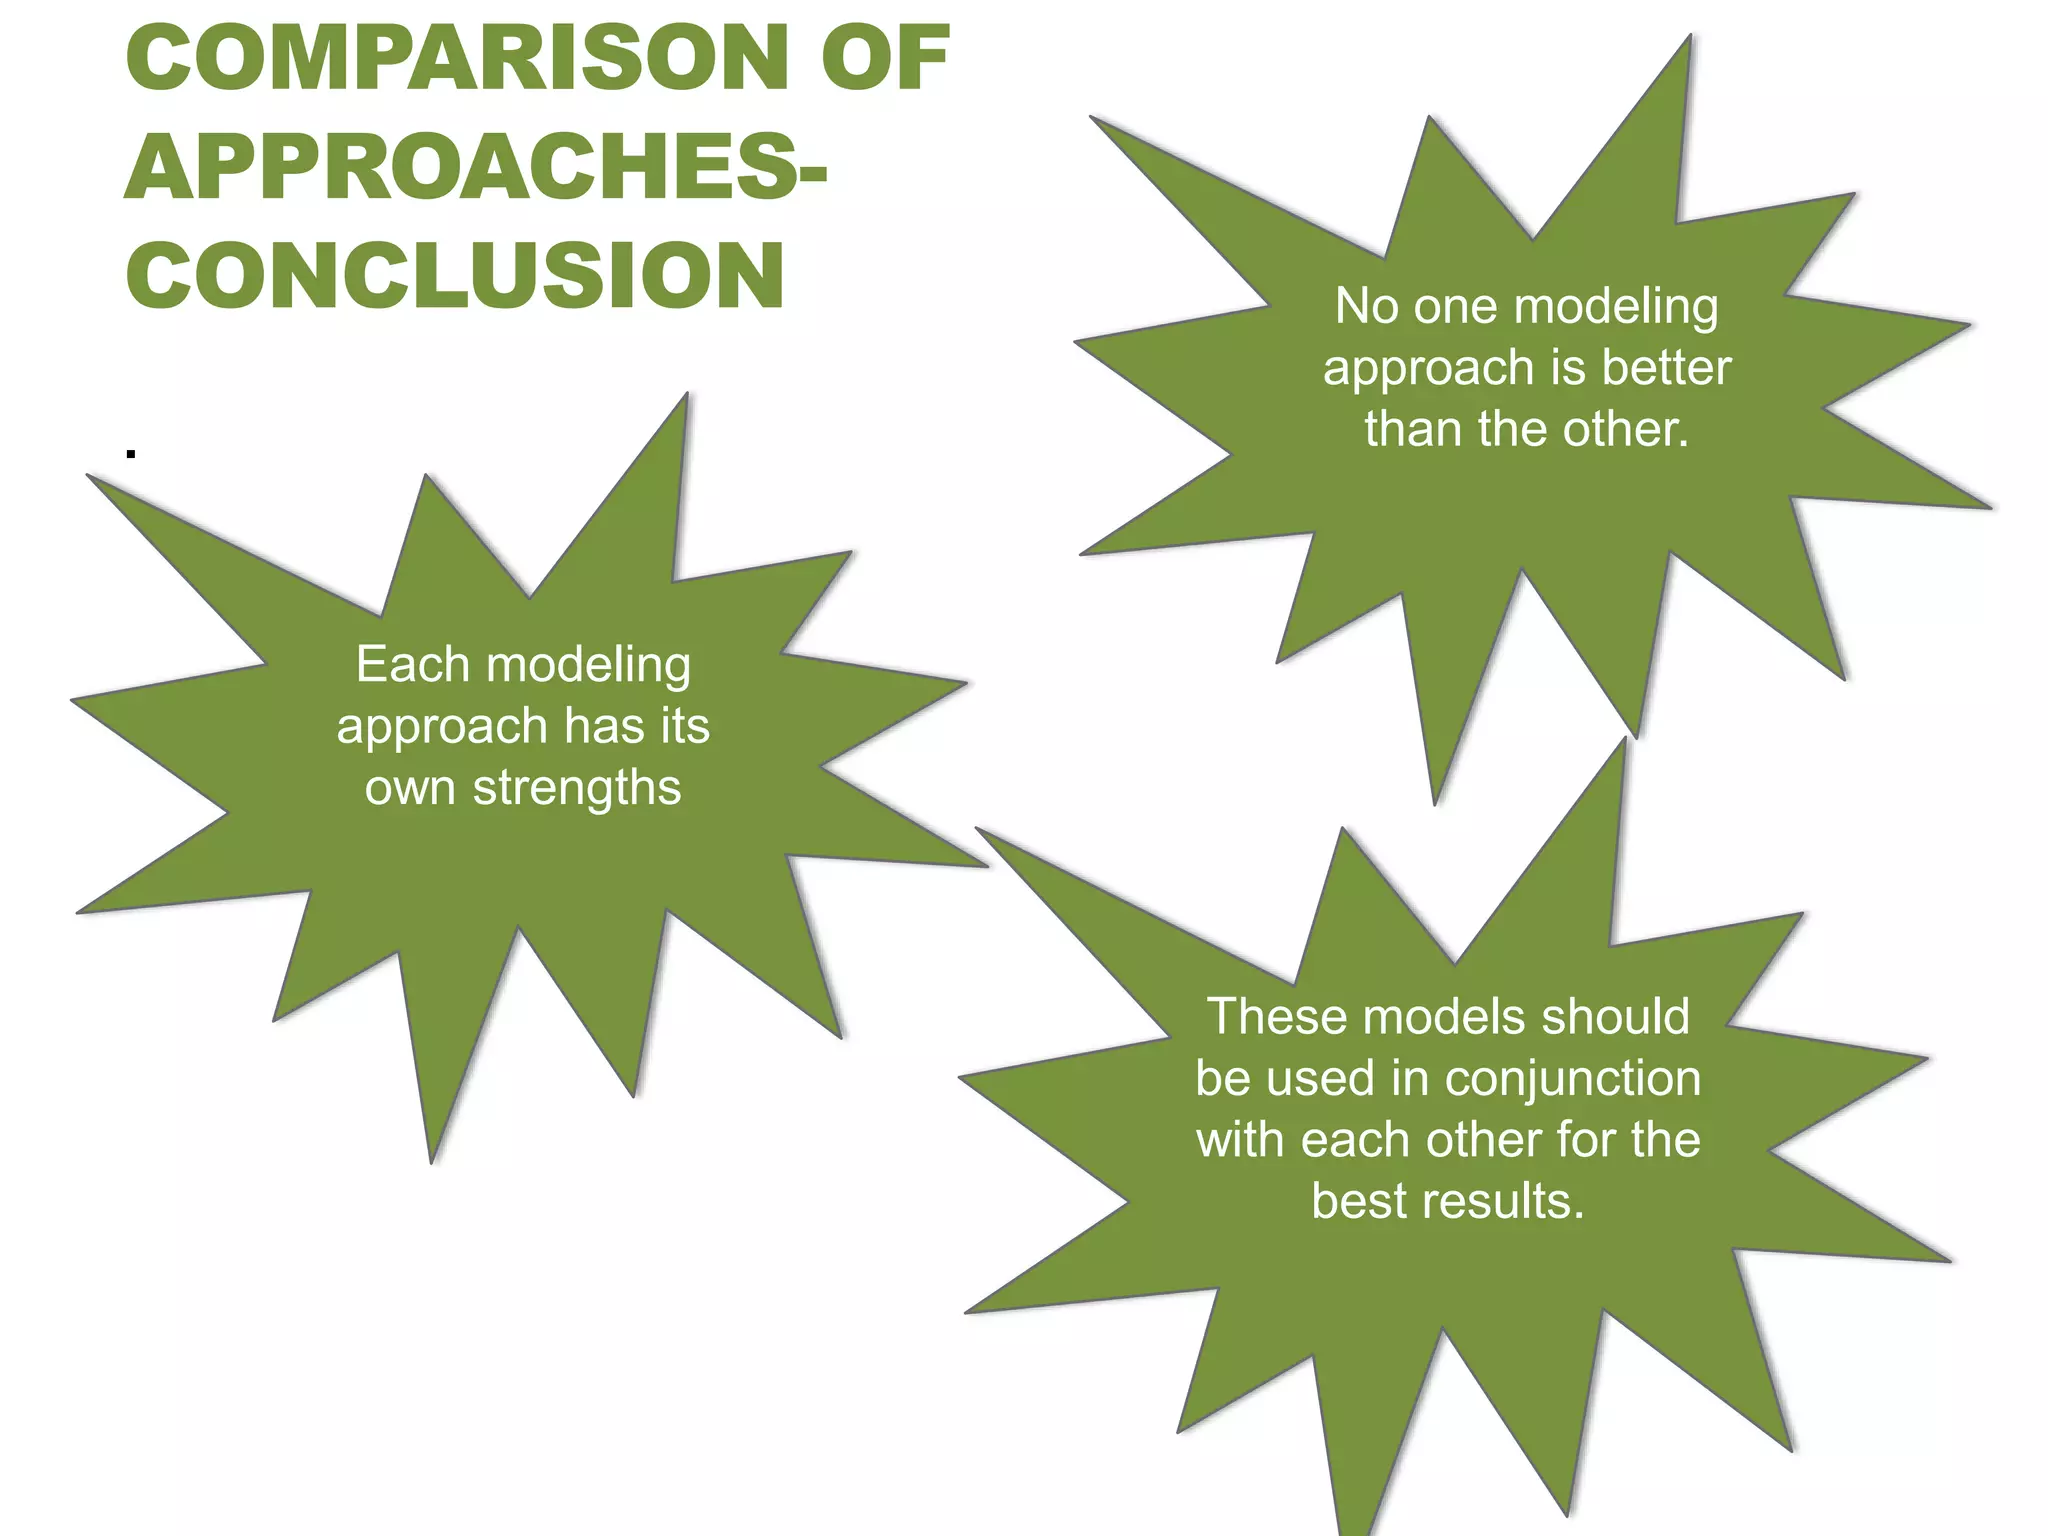
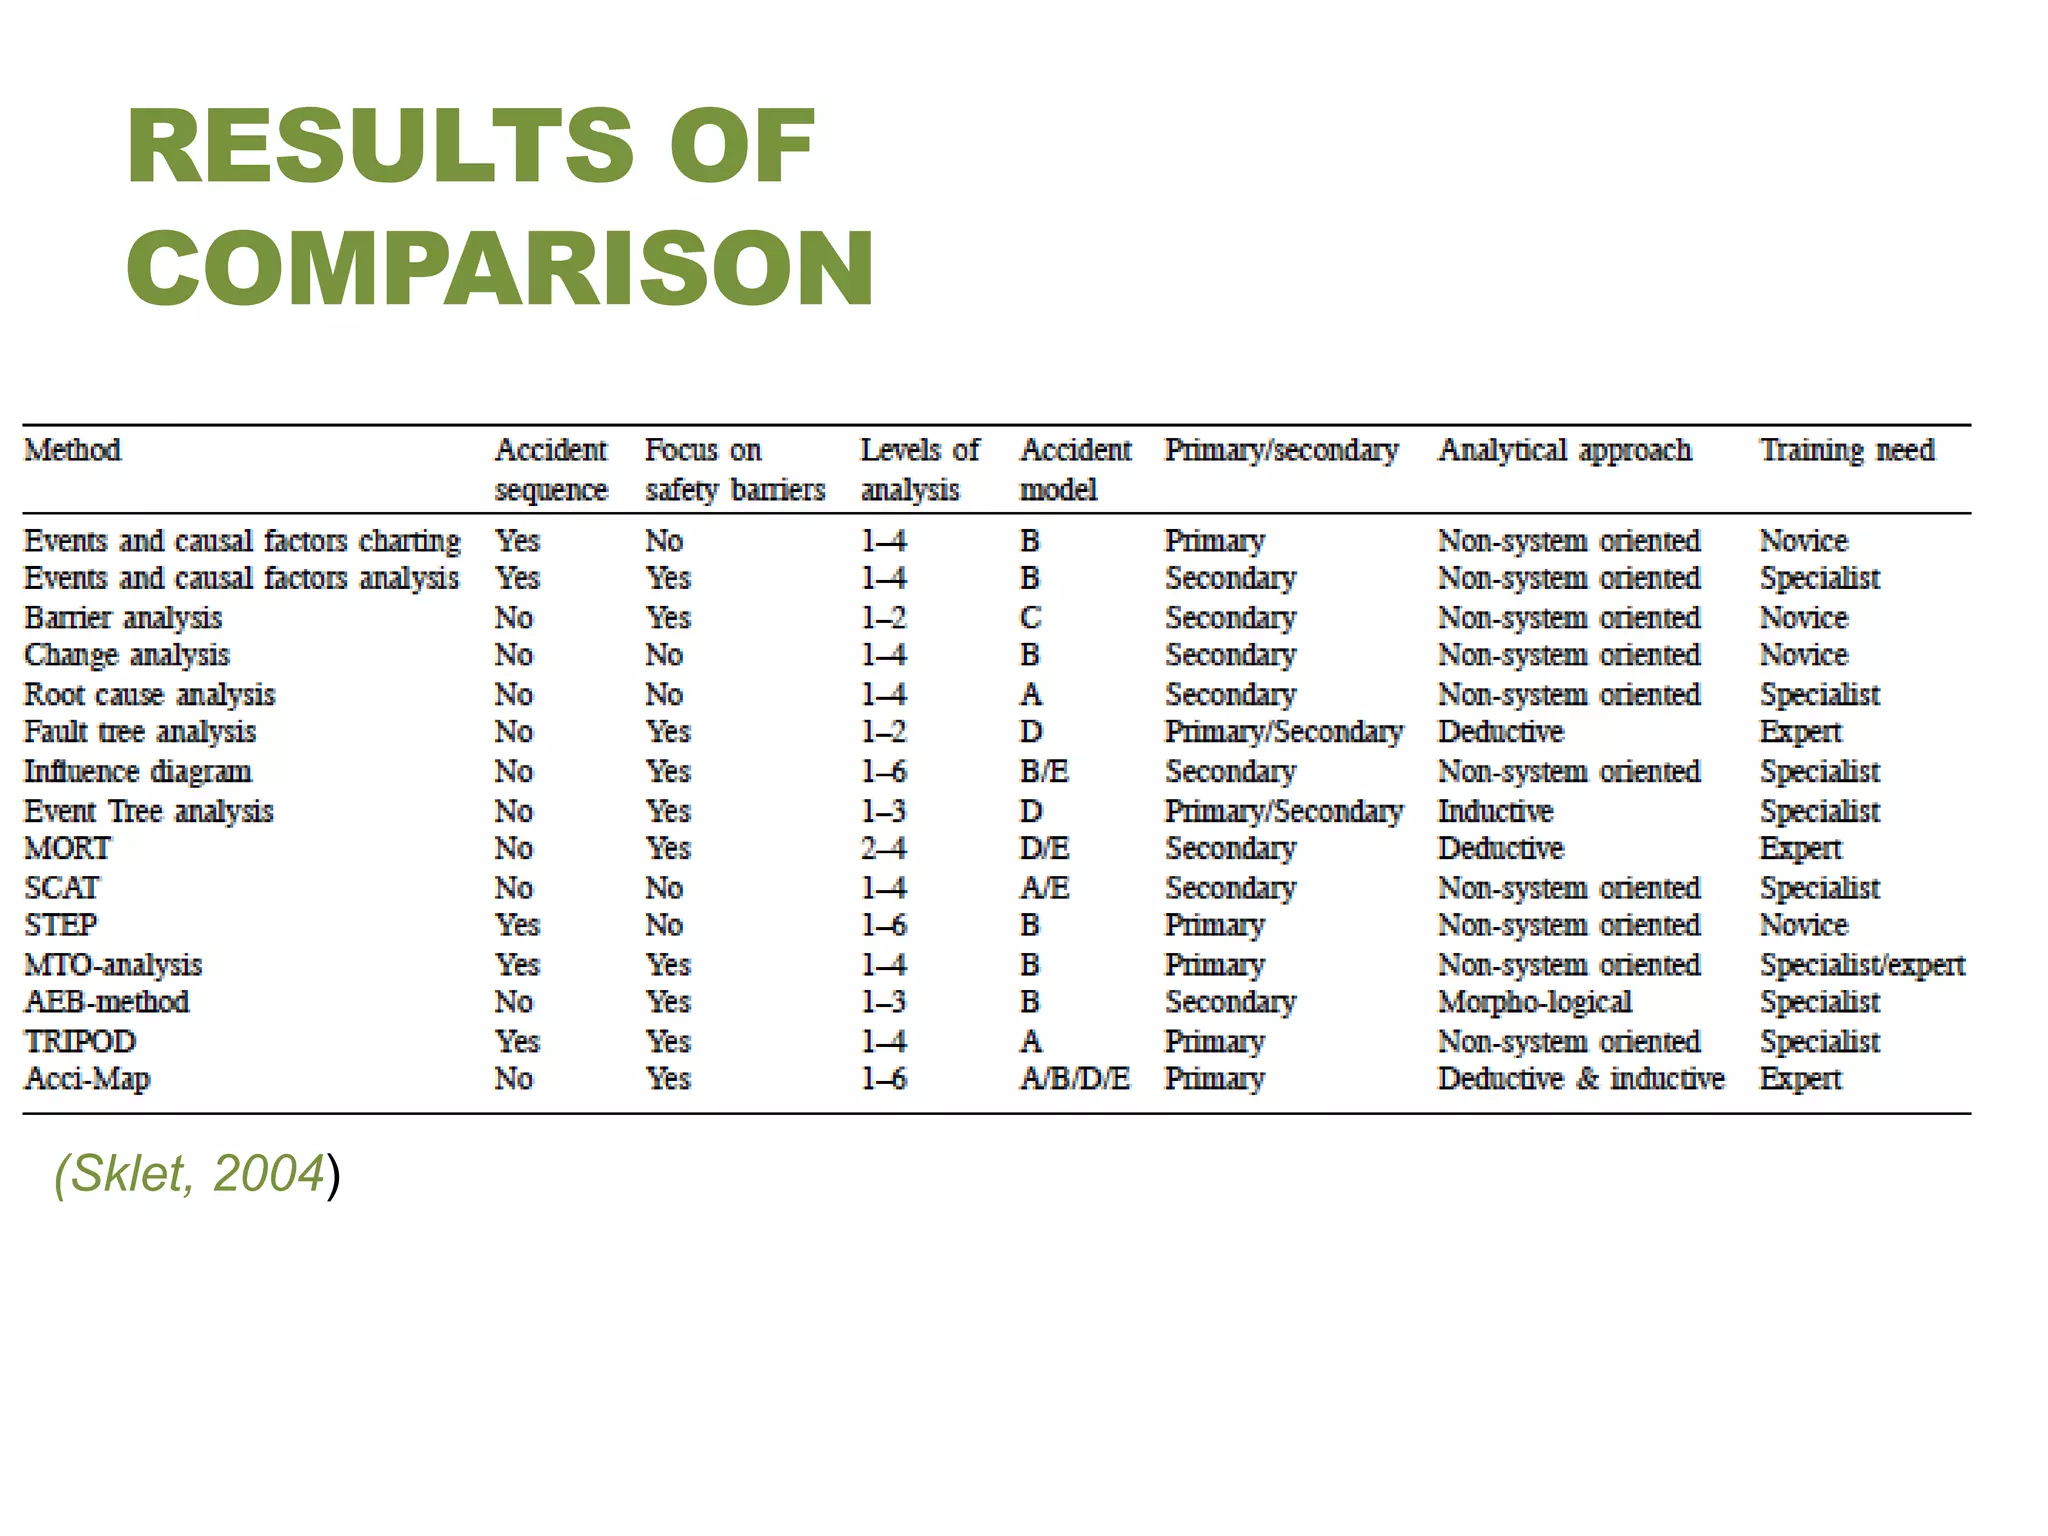
SUMMARY OF
SELECTED
ACCIDENT
MODELING PAPERS
ROSS APTED
TASK
To summarize a discuss the following journal articles and
conference proceedings.
                Papers compare accident modeling approaches in
                varying degrees of detail.


Understanding Accidents - From Root Causes to Performance
Variability
(Hollnagel, 2002)


Comparison of some selected methods for accident
investigation
(Sklet, 2003)


Models of accident causation and their application: Review and
reappraisal
(Lehto, 1991)
UNDERSTANDING ACCIDENTS - FROM ROOT
CAUSES TO PERFORMANCE VARIABILITY
(Hollnagel, 2002)
BACKGROUND
Published in 2002 in the Proceedings of the 2002 IEEE 7th
Conference on Human Factors and Power Plants.

                           Erik Hollnagel
 Department of Computer and Information Science, University of Linkoping, Sweden


Accidents Analysis and Accident Prevention
The variability of Human Performance
Modelling of Cognition


Developed FRAM and CREAM
AIM
To give an overview of the developments in accident
modeling.
       How these developments have effected accident
       analysis and prevention.


1. Summary and analysis of the general modeling
   approaches (Sequential, Epidemiological, Systemic).


2. The role of humans in the accident process(actions of
   humans, work mentally of humans).
STRUCTURE
Summary of modeling techniques
       - Sequential
       - Epidemiological
       - Systemic
Comparison of approaches
Role of Humans in accidents
       - actions of humans
       - work mentality of humans
Conclusion
GENERAL MODELING
APPROACHES -
SEQUENTIAL
Ferry’s domino Model of accident causation (Ferry, 1988)


        Accident Evolution and Barrier model (Svenson, 1991, 2001)


Analysis of sequential approach
DOMINO MODEL OF
ACCIDENT CAUSATION
(Ferry, 1988)

5 factors in the accident sequence
1. Social environment
                Factors effect an individuals perception of risk
2. Fault of the person
                Human error
3. Unsafe acts or environment
                faulty equipment, hazards in the environment
4. Accident
5. Injury
DOMINO MODEL OF
ACCIDENT CAUSATION
Domino Diagram


                 Time
ACCIDENT EVOLUTION
AND BARRIER MODEL
Accidents are represented as sequences of events or
barriers that failed.
       Target what went wrong.
Leaves out other factors that may be import in the
investigation


                                                (Øien, 2001)
SUMMARY OF
SEQUENTIAL APPROACH
Attractive:
Allows you to think in a casual sequence
Represent as a graph
              Allows easy communication of findings


Limited:
Not powerful enough to model more complex systems.
GENERAL MODELING
APPROACHES -
EPIDEMIOLOGICAL
Accident is described as a disease.
        Some factor that effects the accident occur right
        away while others are latent.
Takes into account that events can manifest over time
Swiss cheese Model (Reason, 1997)
SUMMARY OF
EPIDEMIOLOGICAL
APPROACH
Overcome Limitations:
Superior to sequential models as latent events can be taken
into account.
More suited to modeling complex systems.


Lack of detail:
Allowed the idefaction of general events that occurred could
not go deeper.
SUMMARY OF
SYSTEMIC APPROACH
Accidents naturally emerge, they are expected to occur. As
detailed In Perrow’s Normal Accidents.
(Perrow, 1984)


Focus:
Systemic models focus on the characteristics of a systems
as oppose to a series of events that cause the accident in the
system.


Difficult but powerful:
Ideal for complex systems but hard to represent graphically.
COMPARISON OF
APPROACHES
                    Table comparing
                    general approaches


                    Highlights:
                    1. What the accident
                       model produces

                    1. How the product
                       information can be
                       used in accident
                       prevention


(Hollnagel, 2002)
COMPARISON OF
APPROACHES
Sequential models – search for root-cause of event
                  - event linked by cause effect
                - cause is found then accident is prevented.
Epidemiological models – Looks at factors that may manifest
                         later
                      - Looks at barriers that can be re-
enforced                     or created to prevent further
accident
Systemic models – looks for unusual relationships.
               - Monitors variability in systems performance
           - Variability can be good and bad allows the
             system to develop, but bad variably must be
             trapped.
COMPARISON OF
APPROACHES-
CONCLUSION                  No one modeling
                            approach is better
.                            than the other.


     Each modeling
    approach has its
     own strengths


                       These models should
                       be used in conjunction
                       with each other for the
                            best results.
ROLE OF HUMANS IN
ACCIDENTS
Humans play a role a ever level in an accident not just the
sharp end.
Everyone blunt end is someone else's sharp end.


   Blunt end sharp end relationship (Hollnagel, 2002)
ACTIONS OF HUMANS
Humans actions are not black
and white and can only be judge
in hindsight.


        People do what they think
        is right at the time.


Different degrees of ‘being right’
not just correct or fail.


                                     (Amalberti, 1996)
ACTIONS OF HUMANS
Being right or worn does nor accurately show humans roles
in accidents.
ACTIONS OF HUMANS
In the sequential model an element is either correct or has
failed, but human actions are not like this


Human actions are better suited to the epidemiological model
as it allows for latent conditions , it takes into account that action
may contribute to accident over time.


The systemic model is built on the concept of variability and
does not focus on failures. This is perfect for representing
variability of human action.
WORK MENTALITY OF
HUMANS
Efficiency-Thoroughness Trade-off (ETTO) Principle
(Hollnagel, 2002)


Human performance must satisfy conflicting criteria.
        Will try and meet task demand and be as thorough as
        believed necessary while still being as efficient as
possible          and not wasting effort.
Performance can only increase in a stable environment
RO-RO ferries
                      Normal performance
CONCLUSION
“Normal performance and failures are emergent phenomena”
(Hollnagel, 2002)


             Neither can be attributed to a specific part of function
             of the system.


The adaptability of human work is the reason behind its
efficacy and it failures.
COMPARISON OF SOME SELECTED METHODS
FOR ACCIDENT INVESTIGATION
(Sklet, 2004)
BACKGROUND
Published in 2003 in Journal of Hazardous Materials

                              Snorre Sklet
Department of Production and Quality Engineering Norwegian University of Science and
                               Technology, Norway


Risk Analysis and Risk Influence Modeling
Safety Barriers
Safety Management
Accident Investigation
Does a lot of work with the oil industry
AIM
To give a brief summary of highly recognized accident
investigation methods developed over last decade .
       To compare these selected methods to highlight there
       qualities and deficiencies.


1. Summary of the methods ) brief summary of each one,
   framework for comparison).


2. Comparison of methods(table, analysis of comparison).
STRUCTURE
Selected Methods
Framework of comparison
Results of comparison
Analysis of comparison
Conclusion
SELECTED METHODS
Events and causal factors charting and analysis.
Barrier analysis.
Change analysis.
Root cause analysis.
Fault tree analysis.
Influence diagram.
Event tree analysis.
Management and Oversight Risk Tree (MORT).
Systematic Cause Analysis Technique (SCAT).
Sequential Timed Events Plotting (STEP).
Man, Technology and Organisation (MTO)-analysis.
The Accident Evolution and Barrier Function (AEB) method.
TRIPOD.
Acci-Map.

                                  No systemic methods compered
FRAMEWORK OF
COMPARISON
Details Framework of comparison highlighting the strengths
and weakness of each technique.
7 categories
Whether the methods give a graphical description of the event sequence
or not?
        Can give overview of events
         Allows for clear communication
         Easy to see broken link


To what degree the methods focus on safety barriers?
        Analysis of protective elements in the the system
FRAMEWORK OF
COMPARISON
The level of scope of the analysis.
        Which levels of Rasmussen’s classification of
        sociotechnical systems (Rasmussen, 1997) does the
        method model.


                                                (Rasmussen, 1997)
FRAMEWORK OF
COMPARISON
What kind of accident models that has influenced the methods?
        sequential model, epidemiological model, systemic model


Whether the different methods are inductive, deductive,
morphological or non-system-oriented?
        The way in which the method looks at the accident e.g.
        does reason from the general to the specific.
FRAMEWORK OF
COMPARISON
Whether the different methods are primary or secondary
methods?
        Primary Method – Self contained, stand alone method.
        Secondary Method – used in conjunction with other
                   method to provide special input.


The need for education and training in order to use the methods.
        Novice – no experience or training is needed.
        Specialist – In between Novice and expert.
        Expert – Formal education and training is needed.
RESULTS OF
   COMPARISON


(Sklet, 2004)
ANALYSIS OF THE
COMPARISON
The strongest in terms of graphical representation is STEP
as it does not use a single axis and can represent one – one
or one - *


Scope of most methods focus on levels 1-4 of the
sociotechnical systems


Identifying the casual factors or event paths is important.
CONCLUSION
Accidents do not have a single cause so the investigation
should reflected this buy using multiple methods.


A graphical representation is key, as it allows easy
communication of information.


There should be one person of every investigation team that
has the knowledge of different accident modeling techniques
so the right tools can be chosen for the job
REFERENCES
Amalberti, R. (1996). La conduite des systkmes ri risques. Paris: PUF.
Department of Energy. (1999). DOE Workbook, Conducting Accident Investigations . Washington,: Department
of Energy.
Ferry, T. (1988). Modern Accident Investigation and Analysis. Second Edition. New York: Wiley.
Høyland, A., & Rausand, M. (1994). System reliability Theory: Models and Statistical Methods. New York: Wiley.
Hollnagel, E. (2002). Understanding accidents-from root causes to performance variability. Human Factors and
Power Plants, 2002. Proceedings of the 2002 IEEE 7th Conference on , (pp. 1 - 1-6 ).
Lehto, M. (1991). Models of accident causation and their application: Review and reappraisal. journal of
engineering and technology management , 173.
Perrow, C. (1984). Normal Accidents: Living With High-Risk Technologies. New york: Basic books.
Rasmussen, J. (1997). Risk management in a dynamic society: a modelling problem. Safety Sci. , 183–213.
Reason, J. (1997). Managing the Risks of Organizational Accidents. Aldershot: Ashgate.
Sklet, S. (2003). Comparison of some selected methods for accident investigation. Journal of hazardous
materials , 29-37.
Svenson, O. (2001). Accident and Incident Analysis Based on the Accident Evolution and Barrier Function (
AEB) Model. Cognition, Technology & Work , 42-52.
Svenson, O. (1991). The Accident Evolution and Barrier Function (AEB) Model Applied to Incident Analysis in
the Processing Industries. Risk Analysis , 499–507.
Øien, K. (2001). Risk indicators as a tool for risk control. Reliability Engineering & System Safety , 129–145.

Summary of Selected Accident Modeling Papers

  • 1.
  • 2.
    TASK To summarize adiscuss the following journal articles and conference proceedings. Papers compare accident modeling approaches in varying degrees of detail. Understanding Accidents - From Root Causes to Performance Variability (Hollnagel, 2002) Comparison of some selected methods for accident investigation (Sklet, 2003) Models of accident causation and their application: Review and reappraisal (Lehto, 1991)
  • 3.
    UNDERSTANDING ACCIDENTS -FROM ROOT CAUSES TO PERFORMANCE VARIABILITY (Hollnagel, 2002)
  • 4.
    BACKGROUND Published in 2002in the Proceedings of the 2002 IEEE 7th Conference on Human Factors and Power Plants. Erik Hollnagel Department of Computer and Information Science, University of Linkoping, Sweden Accidents Analysis and Accident Prevention The variability of Human Performance Modelling of Cognition Developed FRAM and CREAM
  • 5.
    AIM To give anoverview of the developments in accident modeling. How these developments have effected accident analysis and prevention. 1. Summary and analysis of the general modeling approaches (Sequential, Epidemiological, Systemic). 2. The role of humans in the accident process(actions of humans, work mentally of humans).
  • 6.
    STRUCTURE Summary of modelingtechniques - Sequential - Epidemiological - Systemic Comparison of approaches Role of Humans in accidents - actions of humans - work mentality of humans Conclusion
  • 7.
    GENERAL MODELING APPROACHES - SEQUENTIAL Ferry’sdomino Model of accident causation (Ferry, 1988) Accident Evolution and Barrier model (Svenson, 1991, 2001) Analysis of sequential approach
  • 8.
    DOMINO MODEL OF ACCIDENTCAUSATION (Ferry, 1988) 5 factors in the accident sequence 1. Social environment Factors effect an individuals perception of risk 2. Fault of the person Human error 3. Unsafe acts or environment faulty equipment, hazards in the environment 4. Accident 5. Injury
  • 9.
    DOMINO MODEL OF ACCIDENTCAUSATION Domino Diagram Time
  • 10.
    ACCIDENT EVOLUTION AND BARRIERMODEL Accidents are represented as sequences of events or barriers that failed. Target what went wrong. Leaves out other factors that may be import in the investigation (Øien, 2001)
  • 11.
    SUMMARY OF SEQUENTIAL APPROACH Attractive: Allowsyou to think in a casual sequence Represent as a graph Allows easy communication of findings Limited: Not powerful enough to model more complex systems.
  • 12.
    GENERAL MODELING APPROACHES - EPIDEMIOLOGICAL Accidentis described as a disease. Some factor that effects the accident occur right away while others are latent. Takes into account that events can manifest over time Swiss cheese Model (Reason, 1997)
  • 13.
    SUMMARY OF EPIDEMIOLOGICAL APPROACH Overcome Limitations: Superiorto sequential models as latent events can be taken into account. More suited to modeling complex systems. Lack of detail: Allowed the idefaction of general events that occurred could not go deeper.
  • 14.
    SUMMARY OF SYSTEMIC APPROACH Accidentsnaturally emerge, they are expected to occur. As detailed In Perrow’s Normal Accidents. (Perrow, 1984) Focus: Systemic models focus on the characteristics of a systems as oppose to a series of events that cause the accident in the system. Difficult but powerful: Ideal for complex systems but hard to represent graphically.
  • 15.
    COMPARISON OF APPROACHES Table comparing general approaches Highlights: 1. What the accident model produces 1. How the product information can be used in accident prevention (Hollnagel, 2002)
  • 16.
    COMPARISON OF APPROACHES Sequential models– search for root-cause of event - event linked by cause effect - cause is found then accident is prevented. Epidemiological models – Looks at factors that may manifest later - Looks at barriers that can be re- enforced or created to prevent further accident Systemic models – looks for unusual relationships. - Monitors variability in systems performance - Variability can be good and bad allows the system to develop, but bad variably must be trapped.
  • 17.
    COMPARISON OF APPROACHES- CONCLUSION No one modeling approach is better . than the other. Each modeling approach has its own strengths These models should be used in conjunction with each other for the best results.
  • 18.
    ROLE OF HUMANSIN ACCIDENTS Humans play a role a ever level in an accident not just the sharp end. Everyone blunt end is someone else's sharp end. Blunt end sharp end relationship (Hollnagel, 2002)
  • 19.
    ACTIONS OF HUMANS Humansactions are not black and white and can only be judge in hindsight. People do what they think is right at the time. Different degrees of ‘being right’ not just correct or fail. (Amalberti, 1996)
  • 20.
    ACTIONS OF HUMANS Beingright or worn does nor accurately show humans roles in accidents.
  • 21.
    ACTIONS OF HUMANS Inthe sequential model an element is either correct or has failed, but human actions are not like this Human actions are better suited to the epidemiological model as it allows for latent conditions , it takes into account that action may contribute to accident over time. The systemic model is built on the concept of variability and does not focus on failures. This is perfect for representing variability of human action.
  • 22.
    WORK MENTALITY OF HUMANS Efficiency-ThoroughnessTrade-off (ETTO) Principle (Hollnagel, 2002) Human performance must satisfy conflicting criteria. Will try and meet task demand and be as thorough as believed necessary while still being as efficient as possible and not wasting effort. Performance can only increase in a stable environment RO-RO ferries Normal performance
  • 23.
    CONCLUSION “Normal performance andfailures are emergent phenomena” (Hollnagel, 2002) Neither can be attributed to a specific part of function of the system. The adaptability of human work is the reason behind its efficacy and it failures.
  • 24.
    COMPARISON OF SOMESELECTED METHODS FOR ACCIDENT INVESTIGATION (Sklet, 2004)
  • 25.
    BACKGROUND Published in 2003in Journal of Hazardous Materials Snorre Sklet Department of Production and Quality Engineering Norwegian University of Science and Technology, Norway Risk Analysis and Risk Influence Modeling Safety Barriers Safety Management Accident Investigation Does a lot of work with the oil industry
  • 26.
    AIM To give abrief summary of highly recognized accident investigation methods developed over last decade . To compare these selected methods to highlight there qualities and deficiencies. 1. Summary of the methods ) brief summary of each one, framework for comparison). 2. Comparison of methods(table, analysis of comparison).
  • 27.
    STRUCTURE Selected Methods Framework ofcomparison Results of comparison Analysis of comparison Conclusion
  • 28.
    SELECTED METHODS Events andcausal factors charting and analysis. Barrier analysis. Change analysis. Root cause analysis. Fault tree analysis. Influence diagram. Event tree analysis. Management and Oversight Risk Tree (MORT). Systematic Cause Analysis Technique (SCAT). Sequential Timed Events Plotting (STEP). Man, Technology and Organisation (MTO)-analysis. The Accident Evolution and Barrier Function (AEB) method. TRIPOD. Acci-Map. No systemic methods compered
  • 29.
    FRAMEWORK OF COMPARISON Details Frameworkof comparison highlighting the strengths and weakness of each technique. 7 categories Whether the methods give a graphical description of the event sequence or not? Can give overview of events Allows for clear communication Easy to see broken link To what degree the methods focus on safety barriers? Analysis of protective elements in the the system
  • 30.
    FRAMEWORK OF COMPARISON The levelof scope of the analysis. Which levels of Rasmussen’s classification of sociotechnical systems (Rasmussen, 1997) does the method model. (Rasmussen, 1997)
  • 31.
    FRAMEWORK OF COMPARISON What kindof accident models that has influenced the methods? sequential model, epidemiological model, systemic model Whether the different methods are inductive, deductive, morphological or non-system-oriented? The way in which the method looks at the accident e.g. does reason from the general to the specific.
  • 32.
    FRAMEWORK OF COMPARISON Whether thedifferent methods are primary or secondary methods? Primary Method – Self contained, stand alone method. Secondary Method – used in conjunction with other method to provide special input. The need for education and training in order to use the methods. Novice – no experience or training is needed. Specialist – In between Novice and expert. Expert – Formal education and training is needed.
  • 33.
    RESULTS OF COMPARISON (Sklet, 2004)
  • 34.
    ANALYSIS OF THE COMPARISON Thestrongest in terms of graphical representation is STEP as it does not use a single axis and can represent one – one or one - * Scope of most methods focus on levels 1-4 of the sociotechnical systems Identifying the casual factors or event paths is important.
  • 35.
    CONCLUSION Accidents do nothave a single cause so the investigation should reflected this buy using multiple methods. A graphical representation is key, as it allows easy communication of information. There should be one person of every investigation team that has the knowledge of different accident modeling techniques so the right tools can be chosen for the job
  • 36.
    REFERENCES Amalberti, R. (1996).La conduite des systkmes ri risques. Paris: PUF. Department of Energy. (1999). DOE Workbook, Conducting Accident Investigations . Washington,: Department of Energy. Ferry, T. (1988). Modern Accident Investigation and Analysis. Second Edition. New York: Wiley. Høyland, A., & Rausand, M. (1994). System reliability Theory: Models and Statistical Methods. New York: Wiley. Hollnagel, E. (2002). Understanding accidents-from root causes to performance variability. Human Factors and Power Plants, 2002. Proceedings of the 2002 IEEE 7th Conference on , (pp. 1 - 1-6 ). Lehto, M. (1991). Models of accident causation and their application: Review and reappraisal. journal of engineering and technology management , 173. Perrow, C. (1984). Normal Accidents: Living With High-Risk Technologies. New york: Basic books. Rasmussen, J. (1997). Risk management in a dynamic society: a modelling problem. Safety Sci. , 183–213. Reason, J. (1997). Managing the Risks of Organizational Accidents. Aldershot: Ashgate. Sklet, S. (2003). Comparison of some selected methods for accident investigation. Journal of hazardous materials , 29-37. Svenson, O. (2001). Accident and Incident Analysis Based on the Accident Evolution and Barrier Function ( AEB) Model. Cognition, Technology & Work , 42-52. Svenson, O. (1991). The Accident Evolution and Barrier Function (AEB) Model Applied to Incident Analysis in the Processing Industries. Risk Analysis , 499–507. Øien, K. (2001). Risk indicators as a tool for risk control. Reliability Engineering & System Safety , 129–145.

Editor's Notes

  • #5 Functional Resonance Accident ModelCognitive Reliability and Error Analysis Method
  • #26 Functional Resonance Accident ModelCognitive Reliability and Error Analysis Method