Downloaded 414 times
![Layer of Protection
Analysis (LOPA)
technique is described in detail in The
American
Institute of Chemical Engineers Center for
Chemical Process Safety (CCPS) publication
on
the subject [2]. An overview of the technique
is presented here. For more information the
reader is referred to the CCPS publication,
which contains a number of worked
examples and
extensive references.](https://image.slidesharecdn.com/riskassessmenttechnique-170923010930/75/Risk-assessment-tools-and-techniques-19-2048.jpg)

![Cost
benefit
analysis
(CBA),
sometimes
called
benefit
cost
analysis (BCA),
is
a
systematic
approach
to
estimating
the
strengths
and
weaknesses
of
alternatives
(for
example
in
transactions,
activities,
functional
business
requirements
or
projects
investments);
it
is
used
to
determine
options
that
provide
the
best
approach
to
achieve
benefits
while
preserving
savings.[1] The
CBA
is
also
defined
as
a
systematic
process
for
calculating
and
comparing
benefits
and
costs of
a
decision,
policy
(with
particular
regard
to
government
policy)
or
(in
general)
project.
Broadly,
CBA
has
two
main
purposes:
1.To
determine
if
an
investment/decision
is
sound
(justification/feasibility)
– verifying
whether
its
benefits
outweigh
the
costs,
and
by
how
much;
2.To
provide
a
basis
for
comparing
projects
–
which
involves
comparing
the
total
expected
cost
of
each
option
against
its
total
expected
benefits.[2]](https://image.slidesharecdn.com/riskassessmenttechnique-170923010930/75/Risk-assessment-tools-and-techniques-31-2048.jpg)
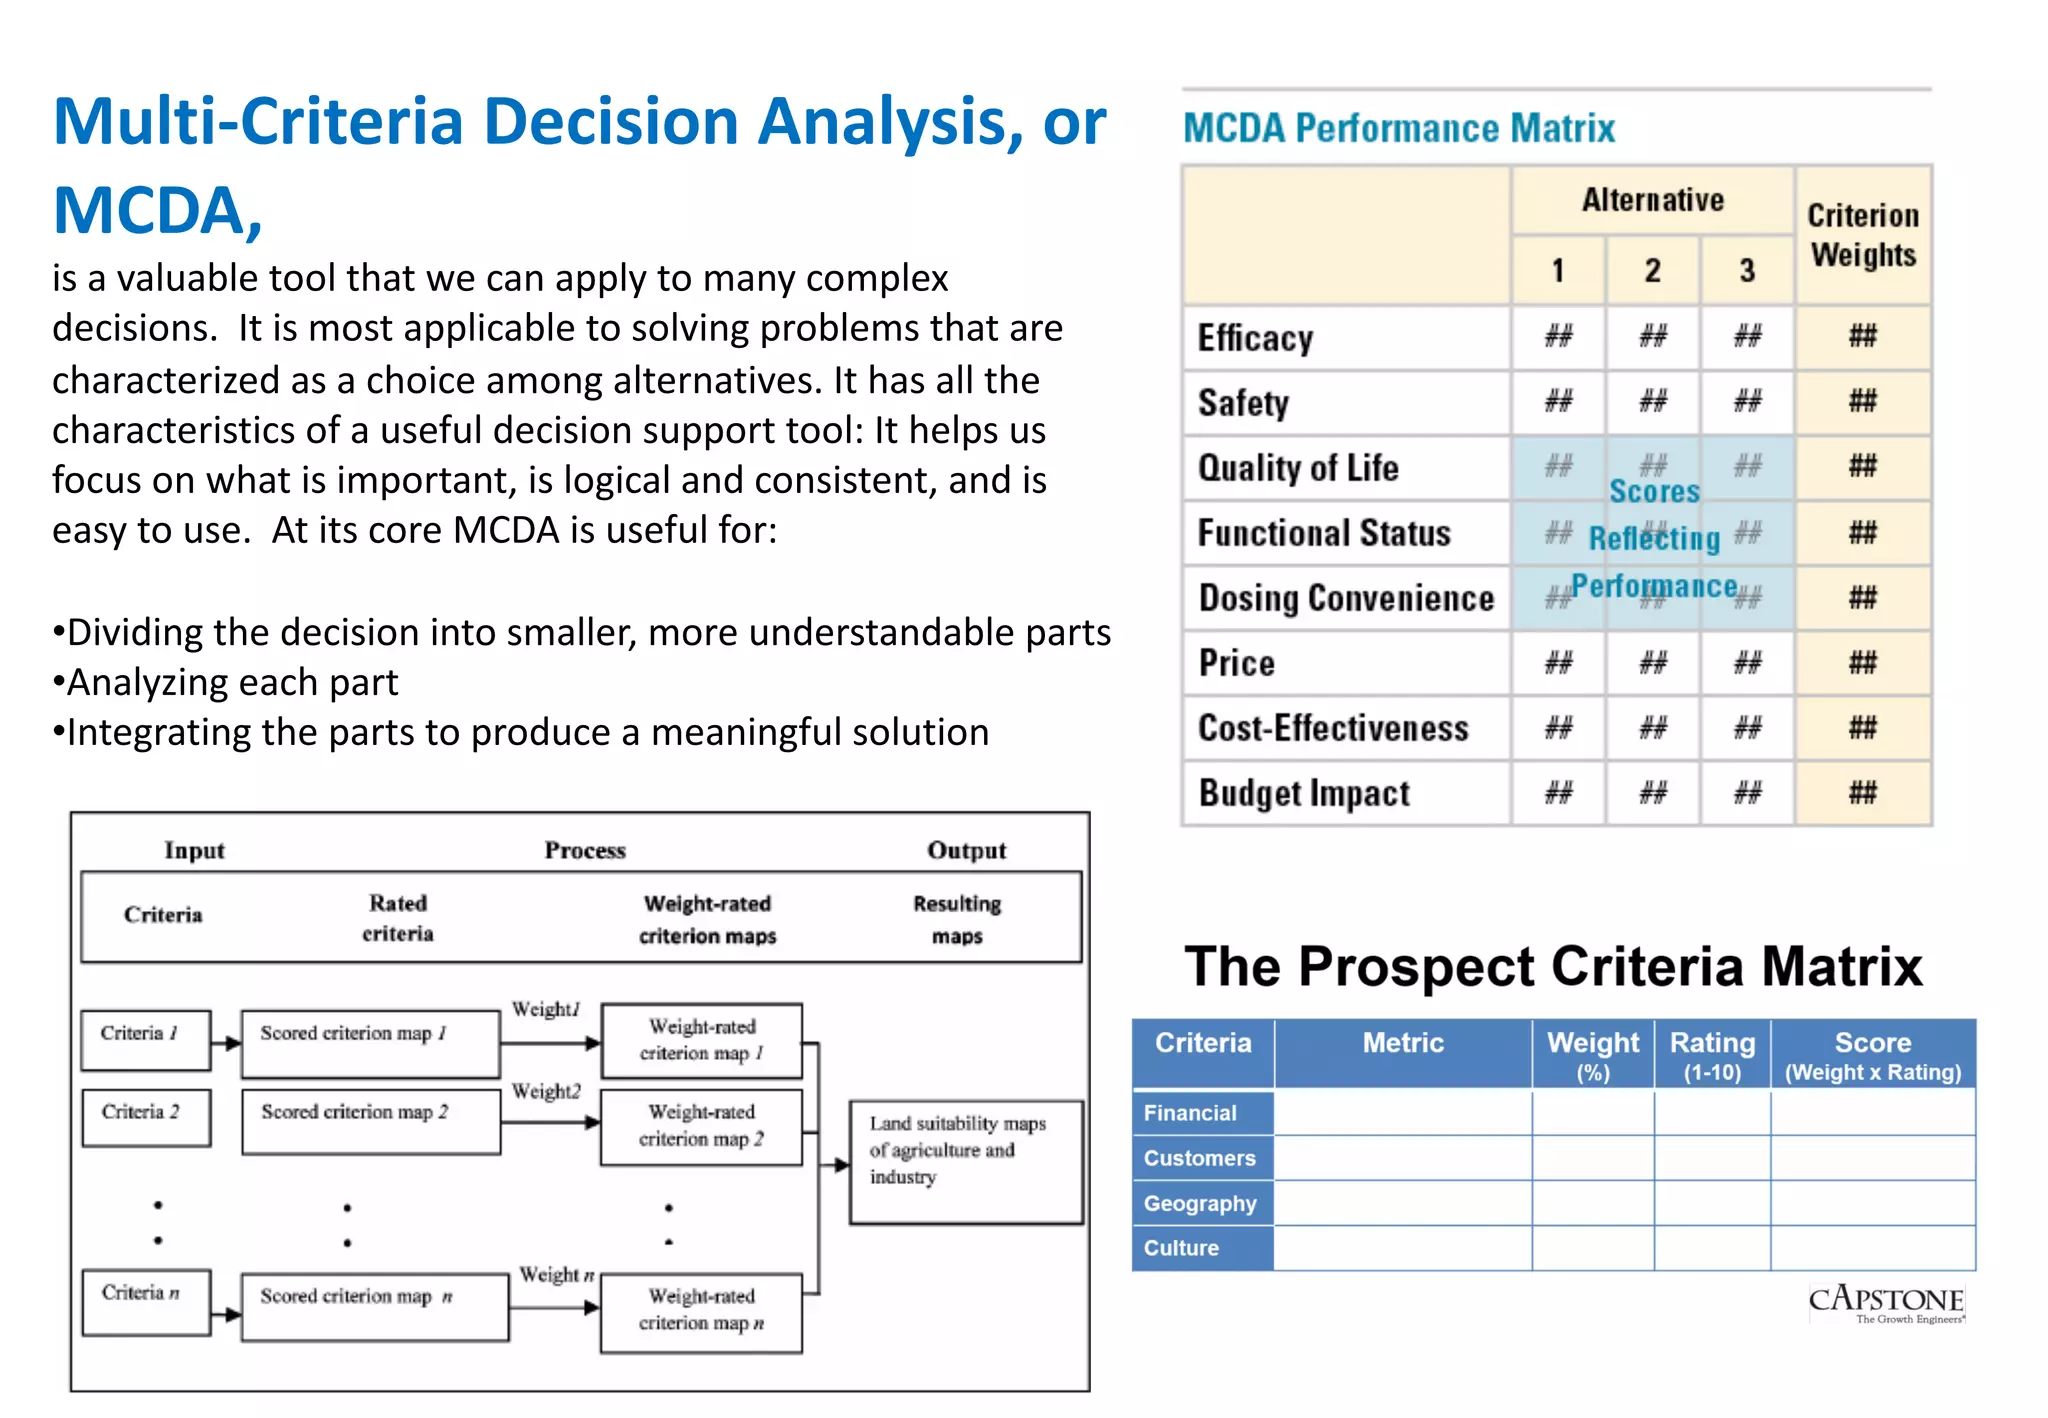


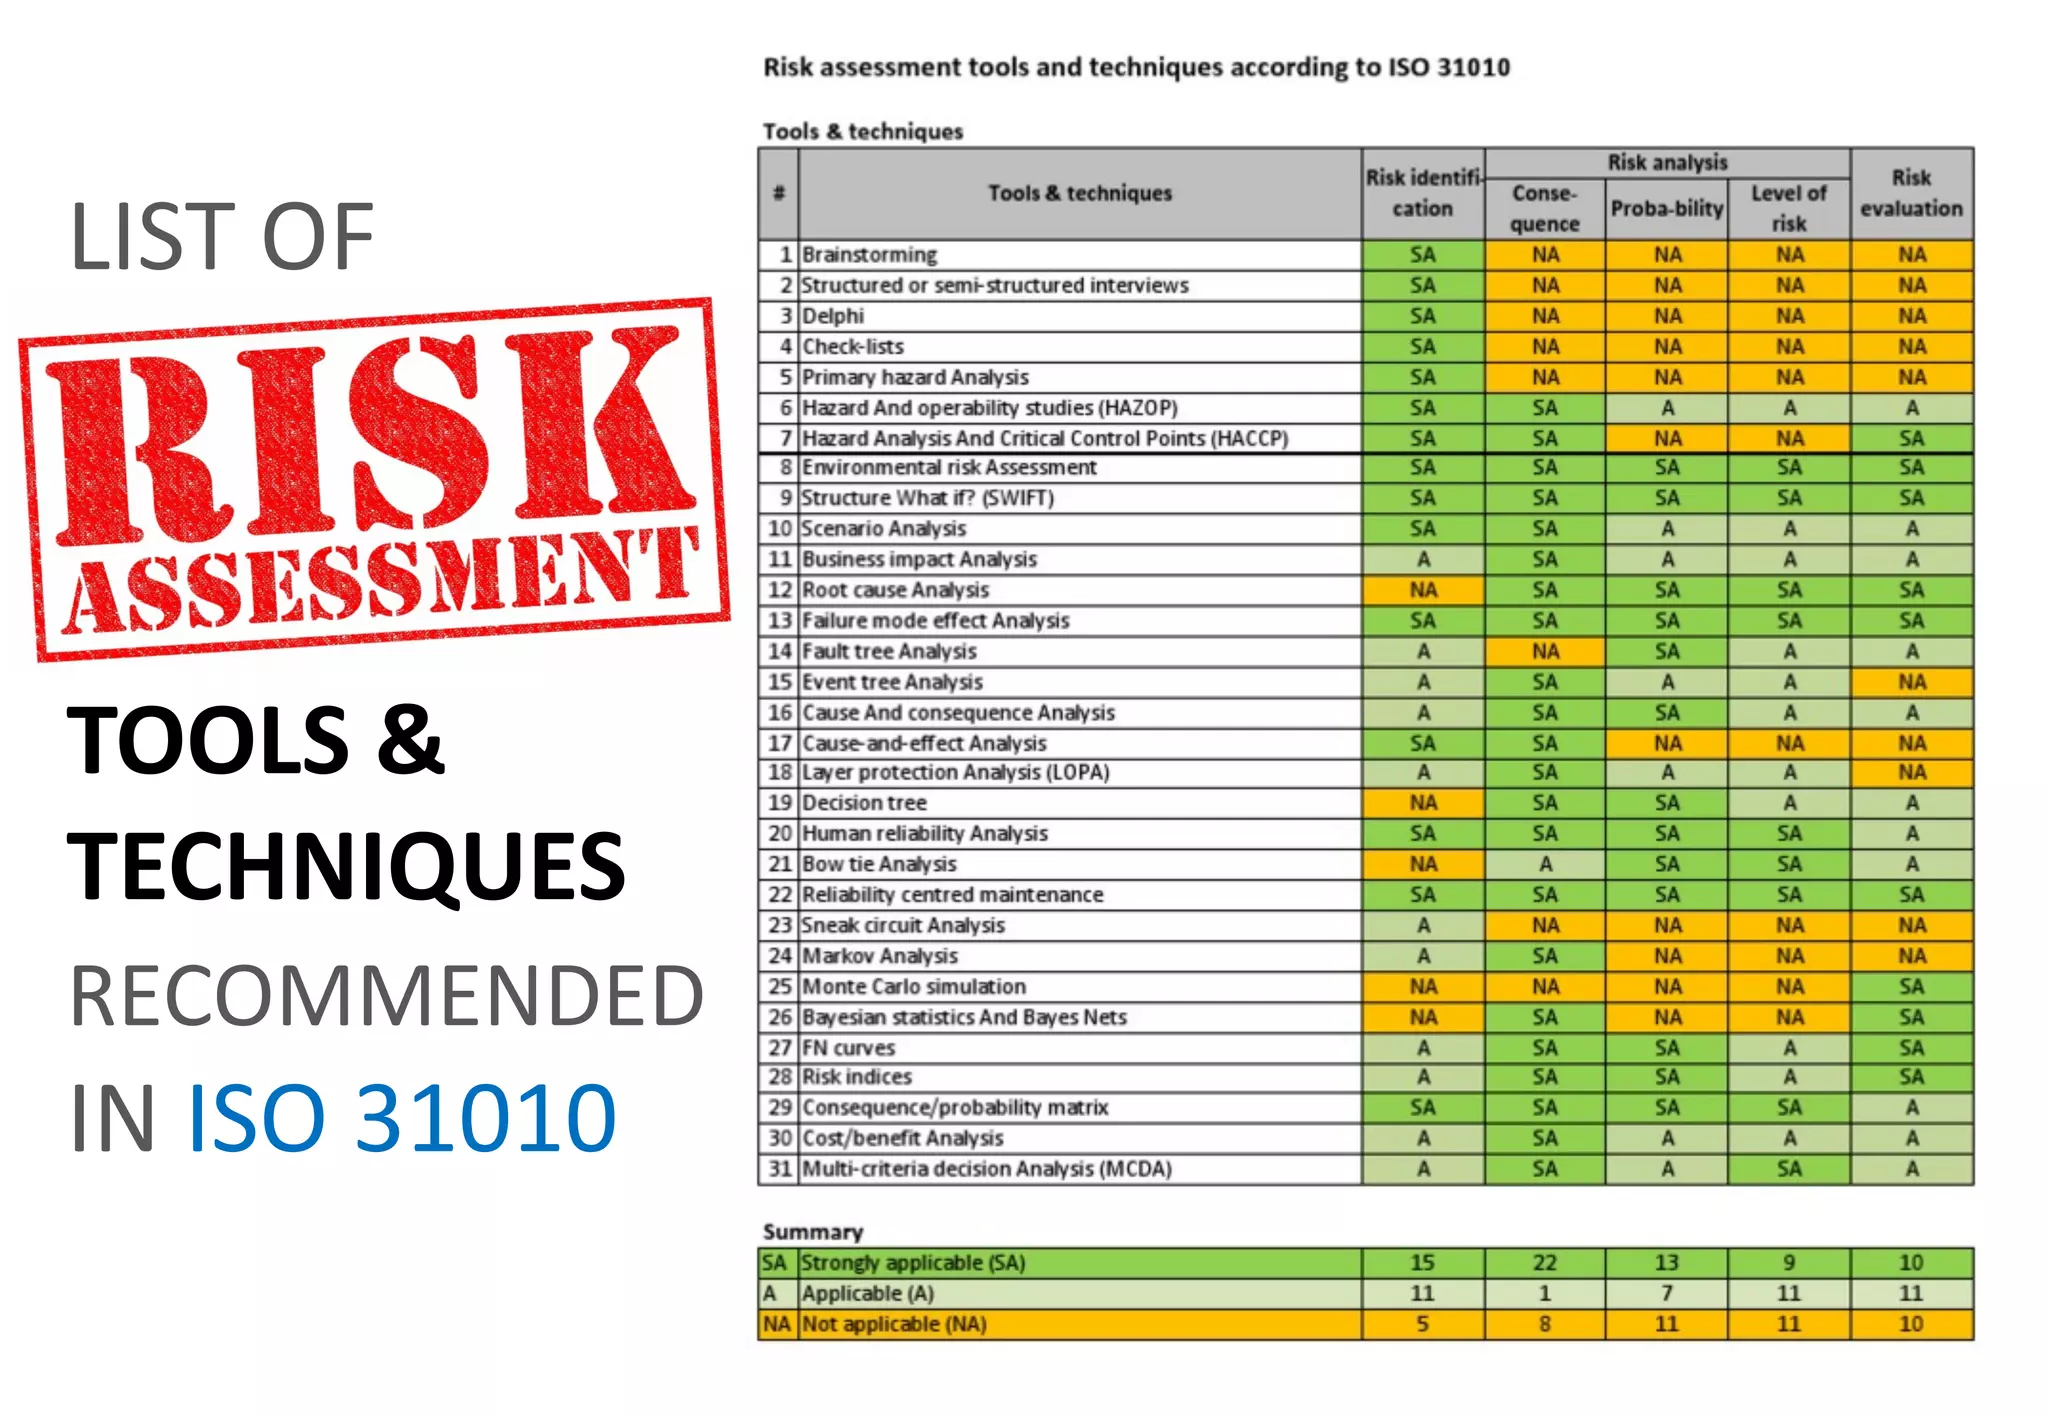
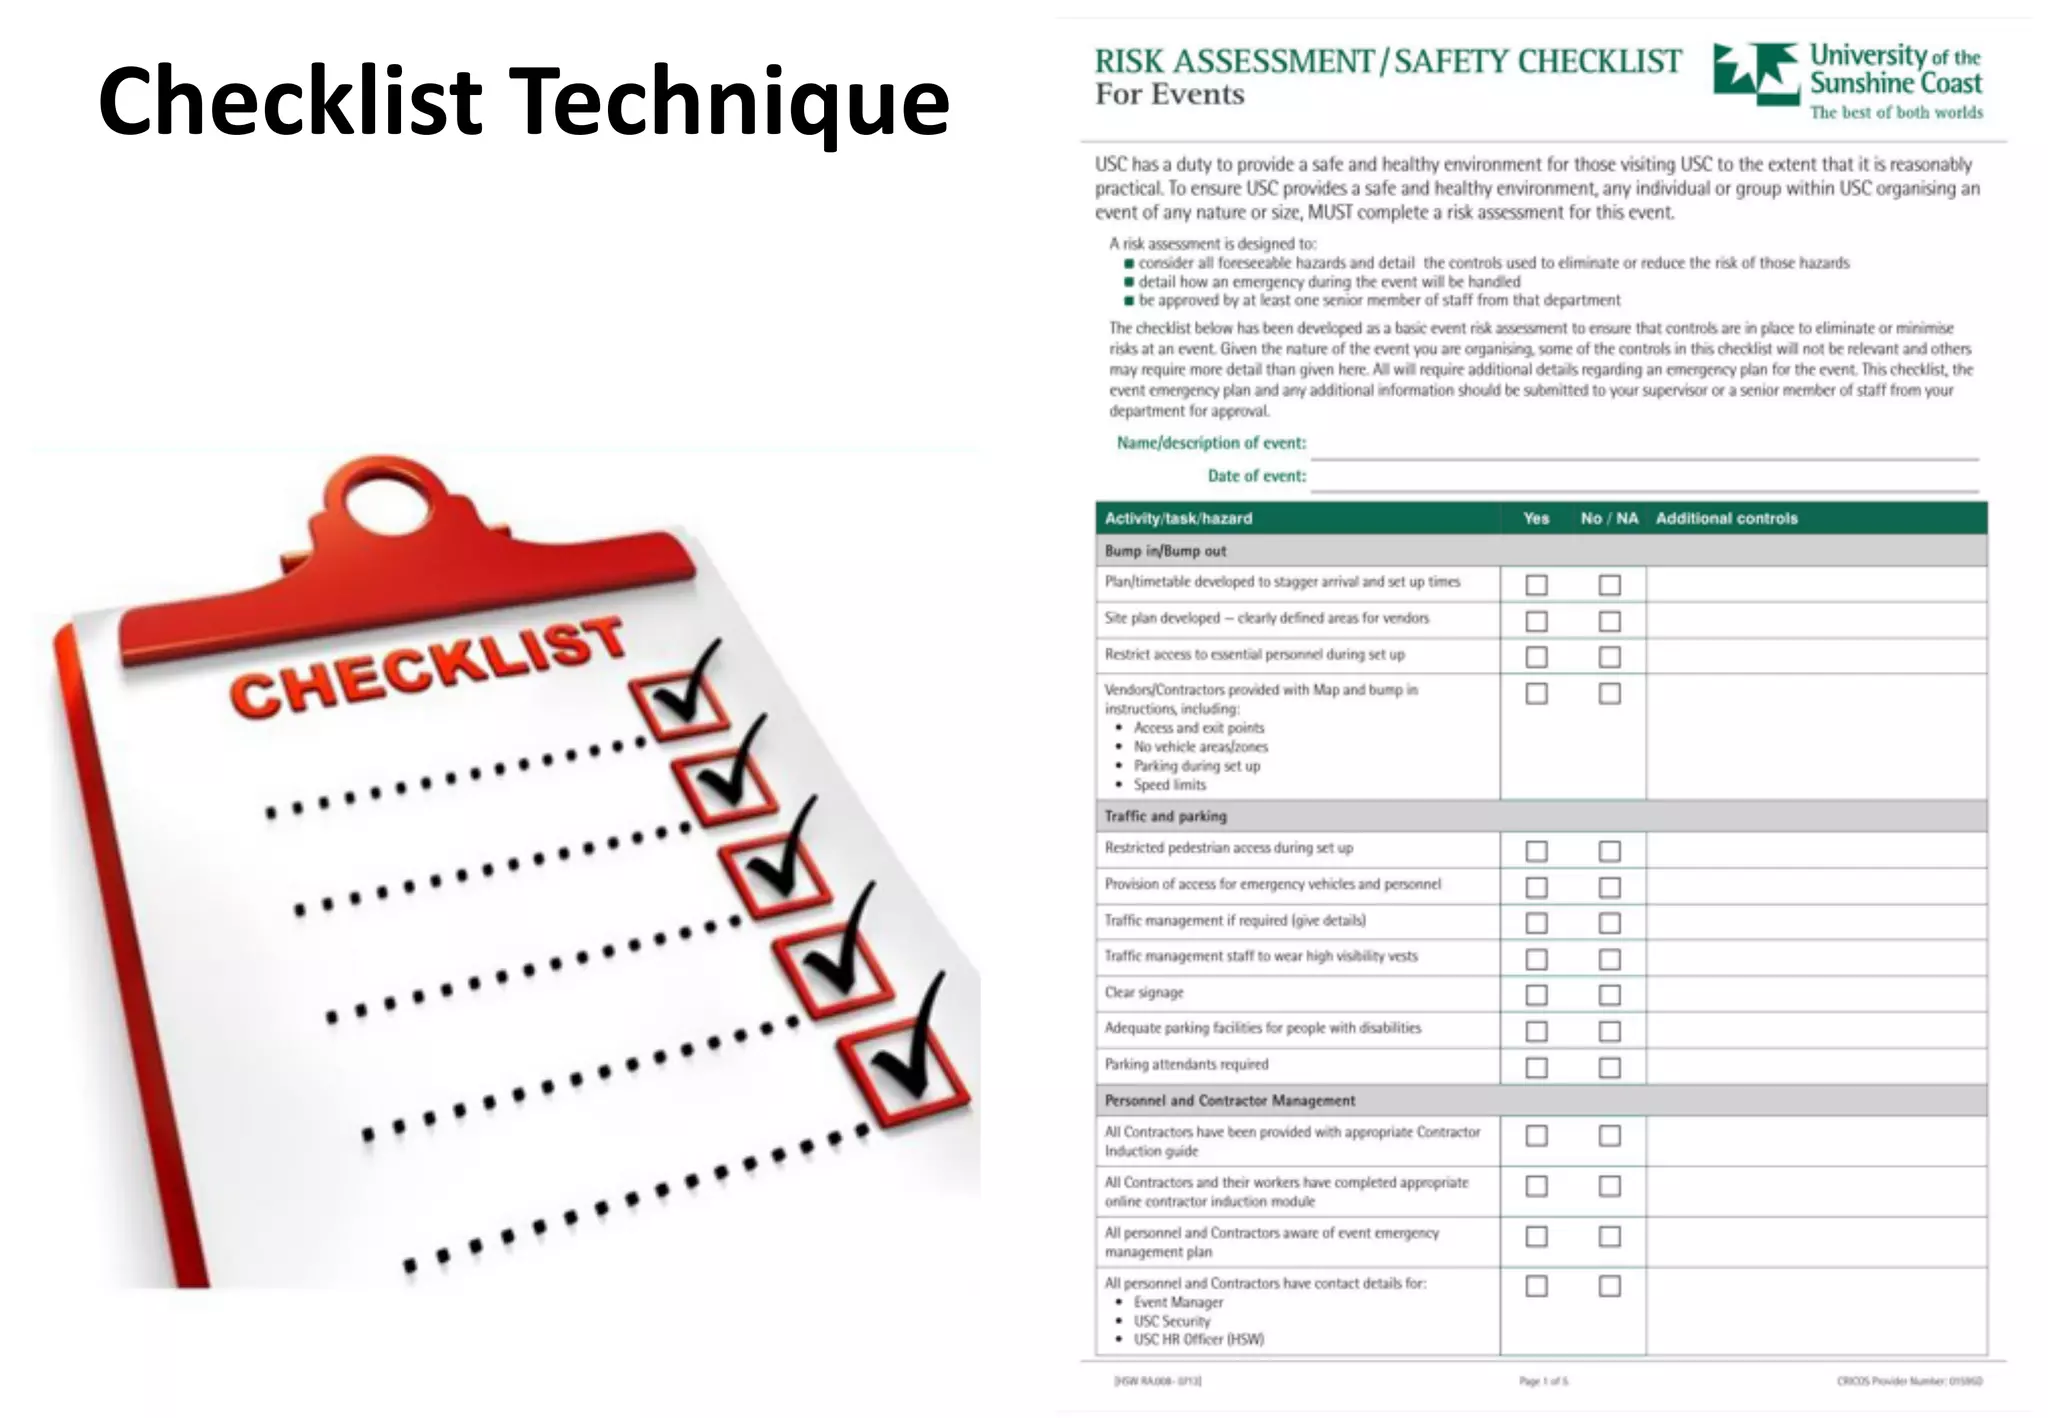
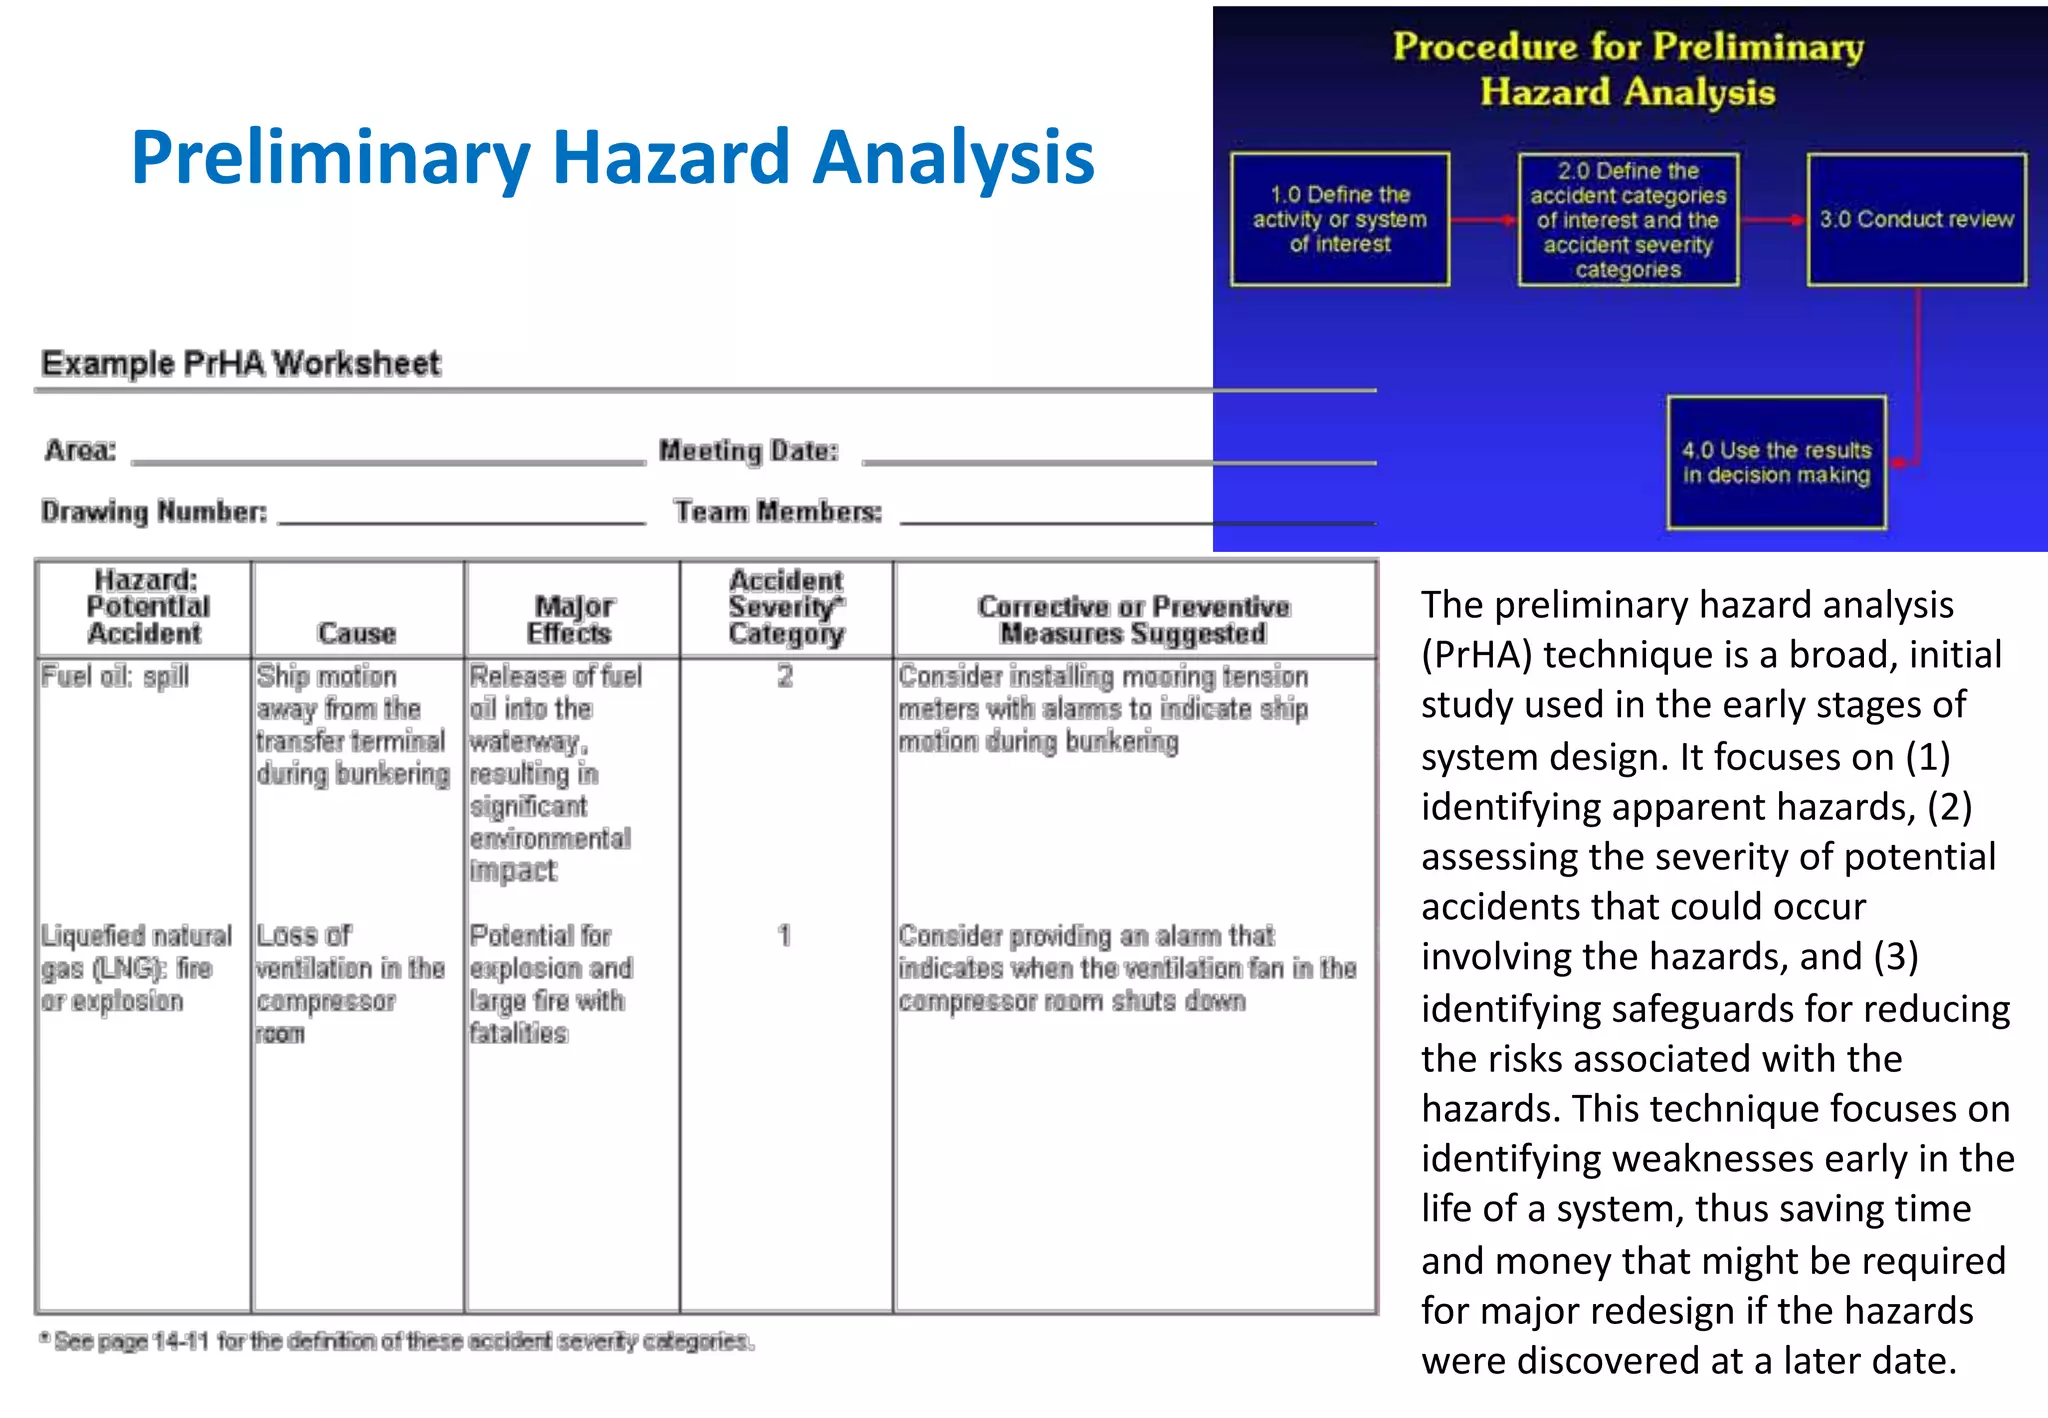
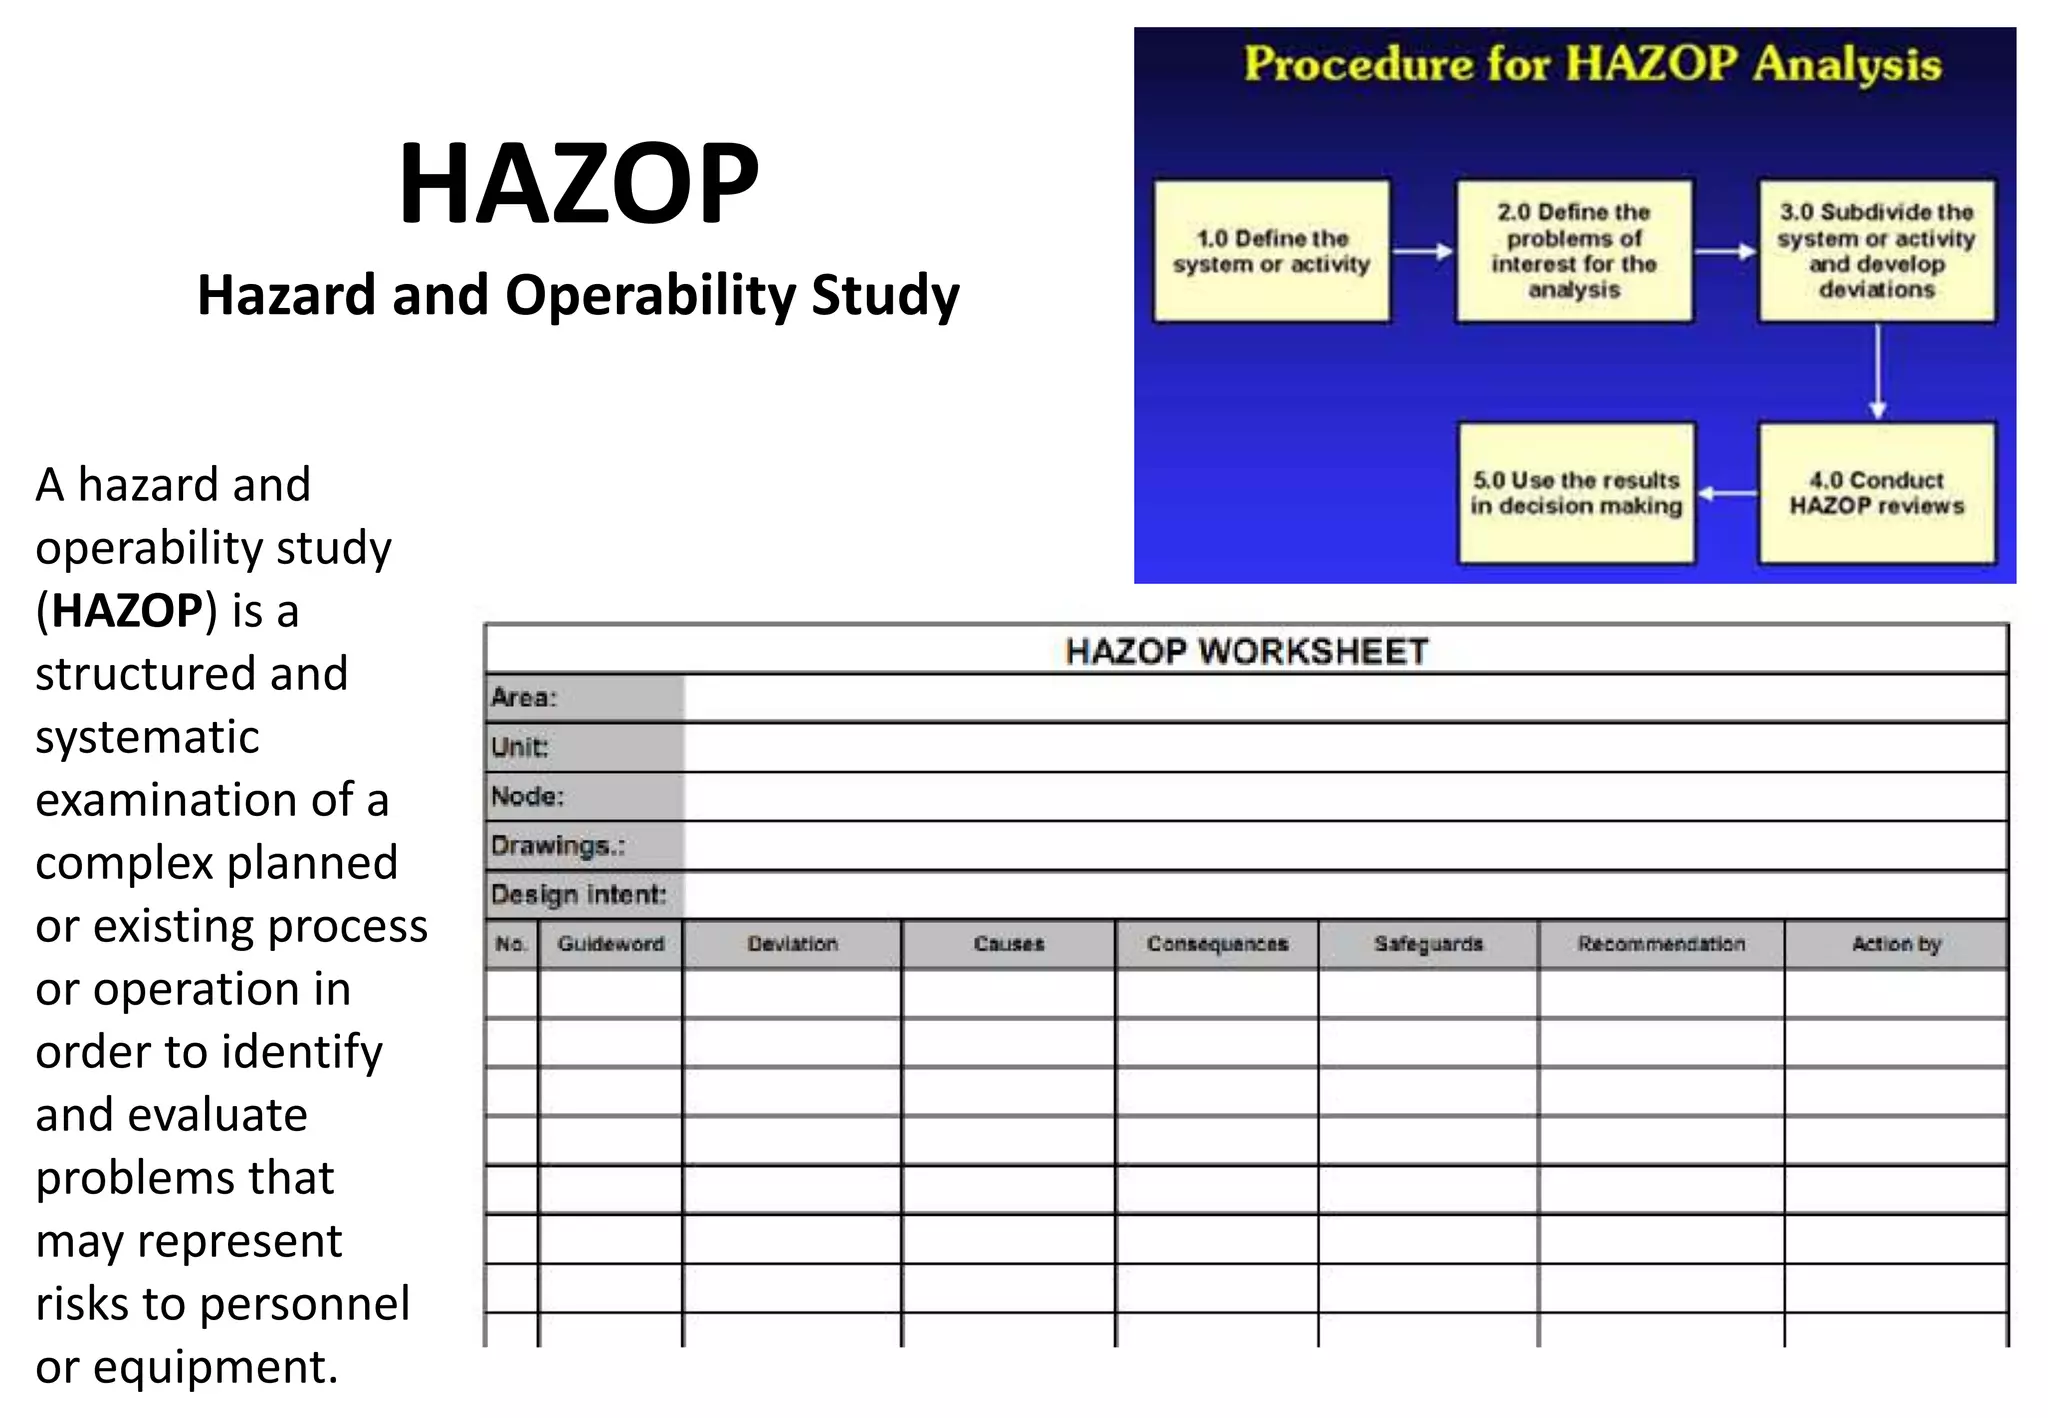
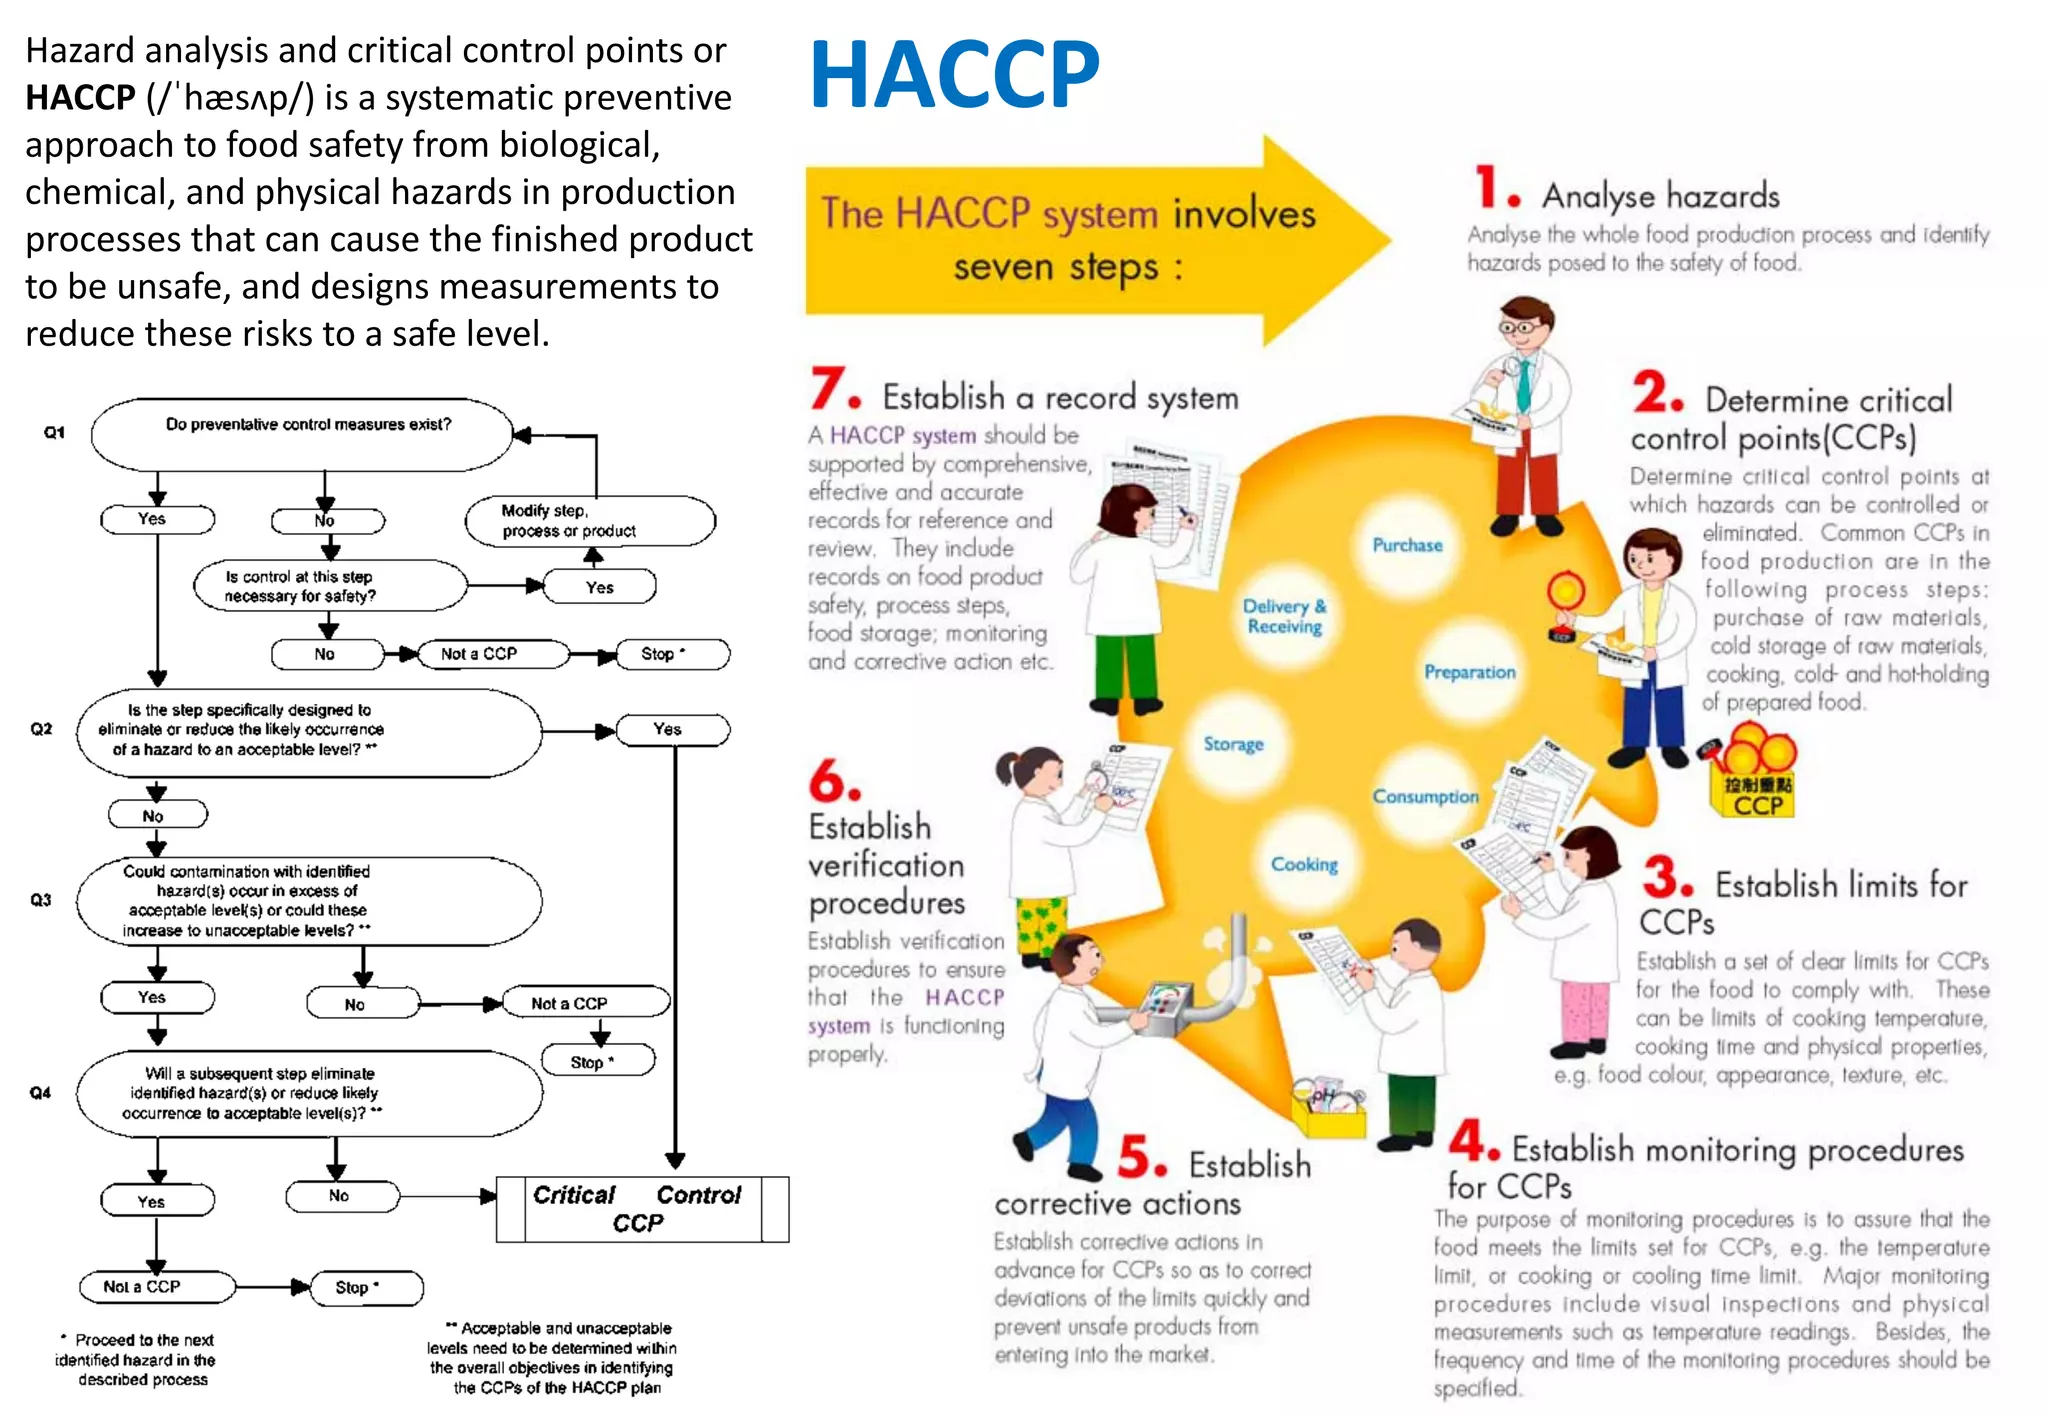
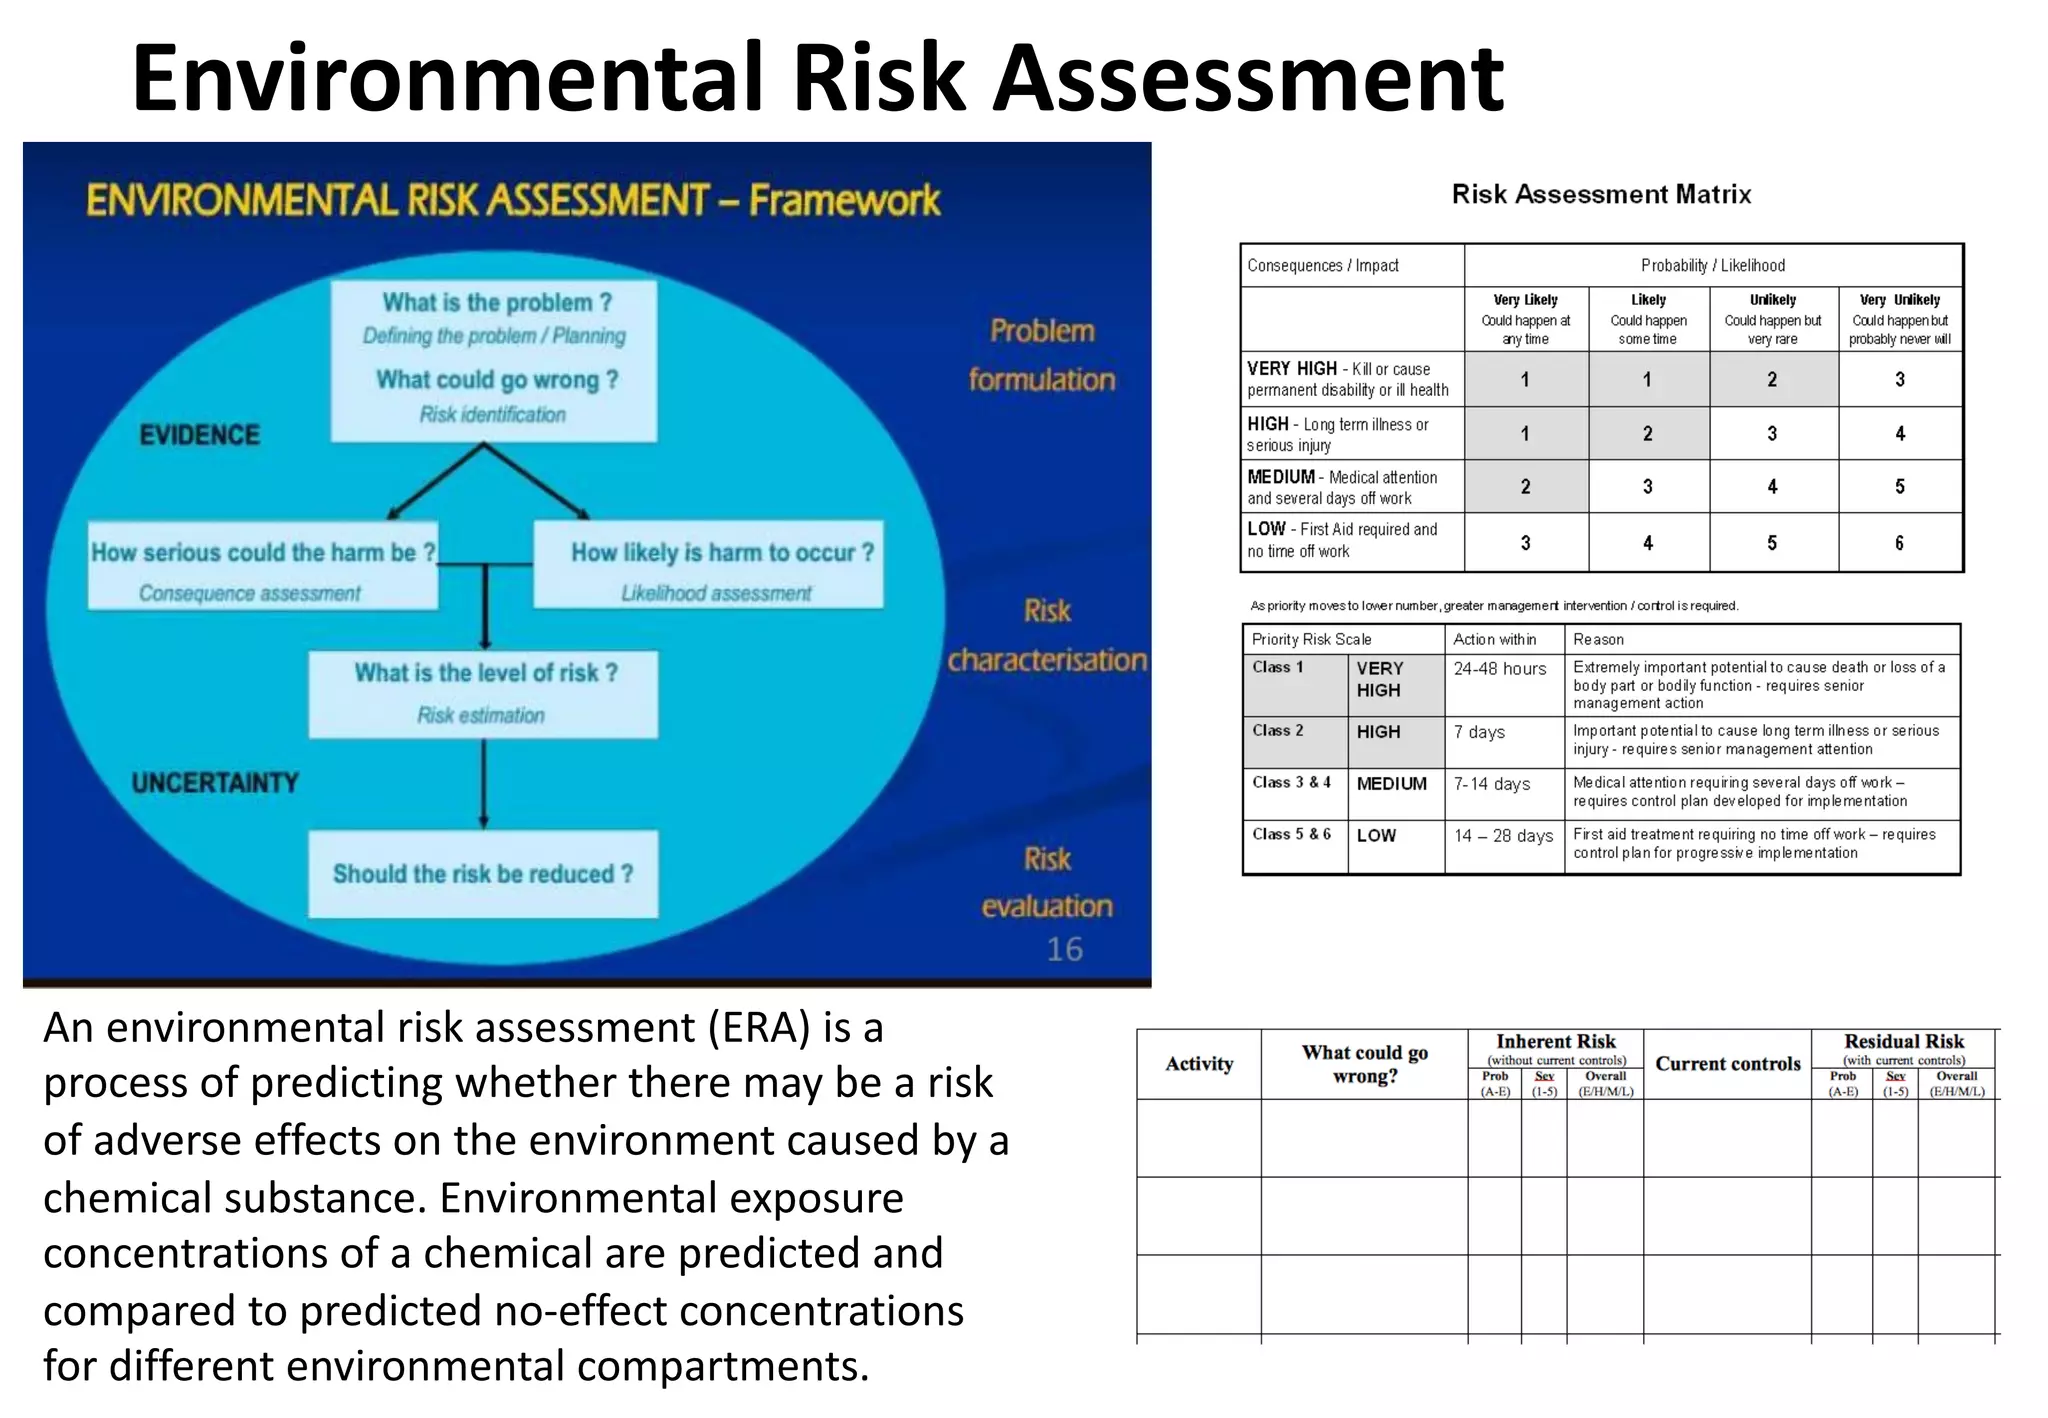
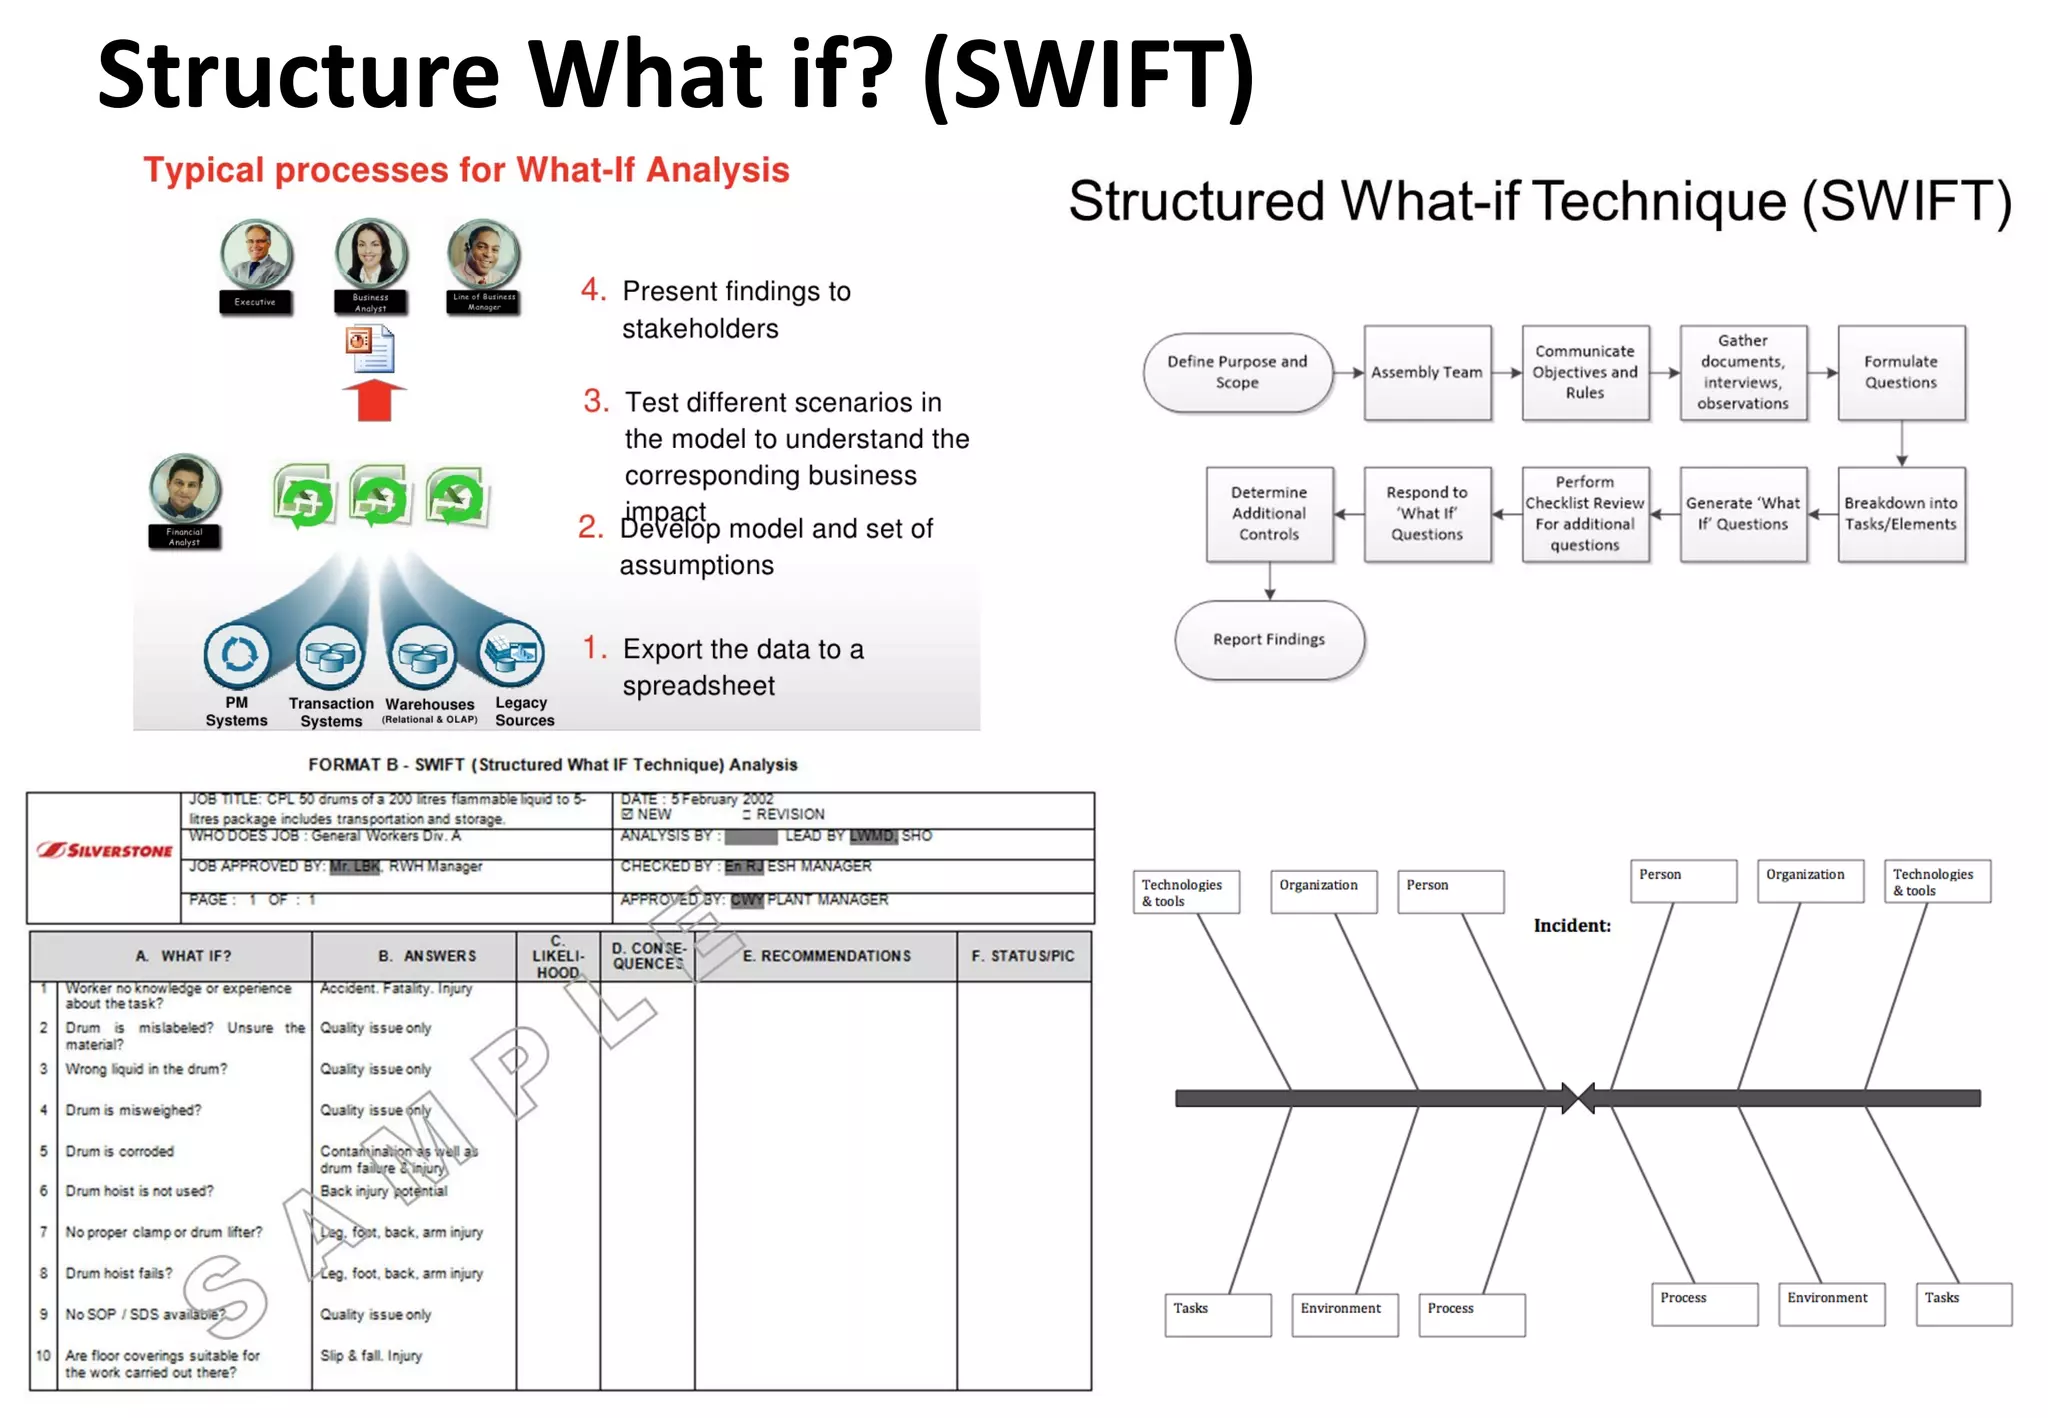
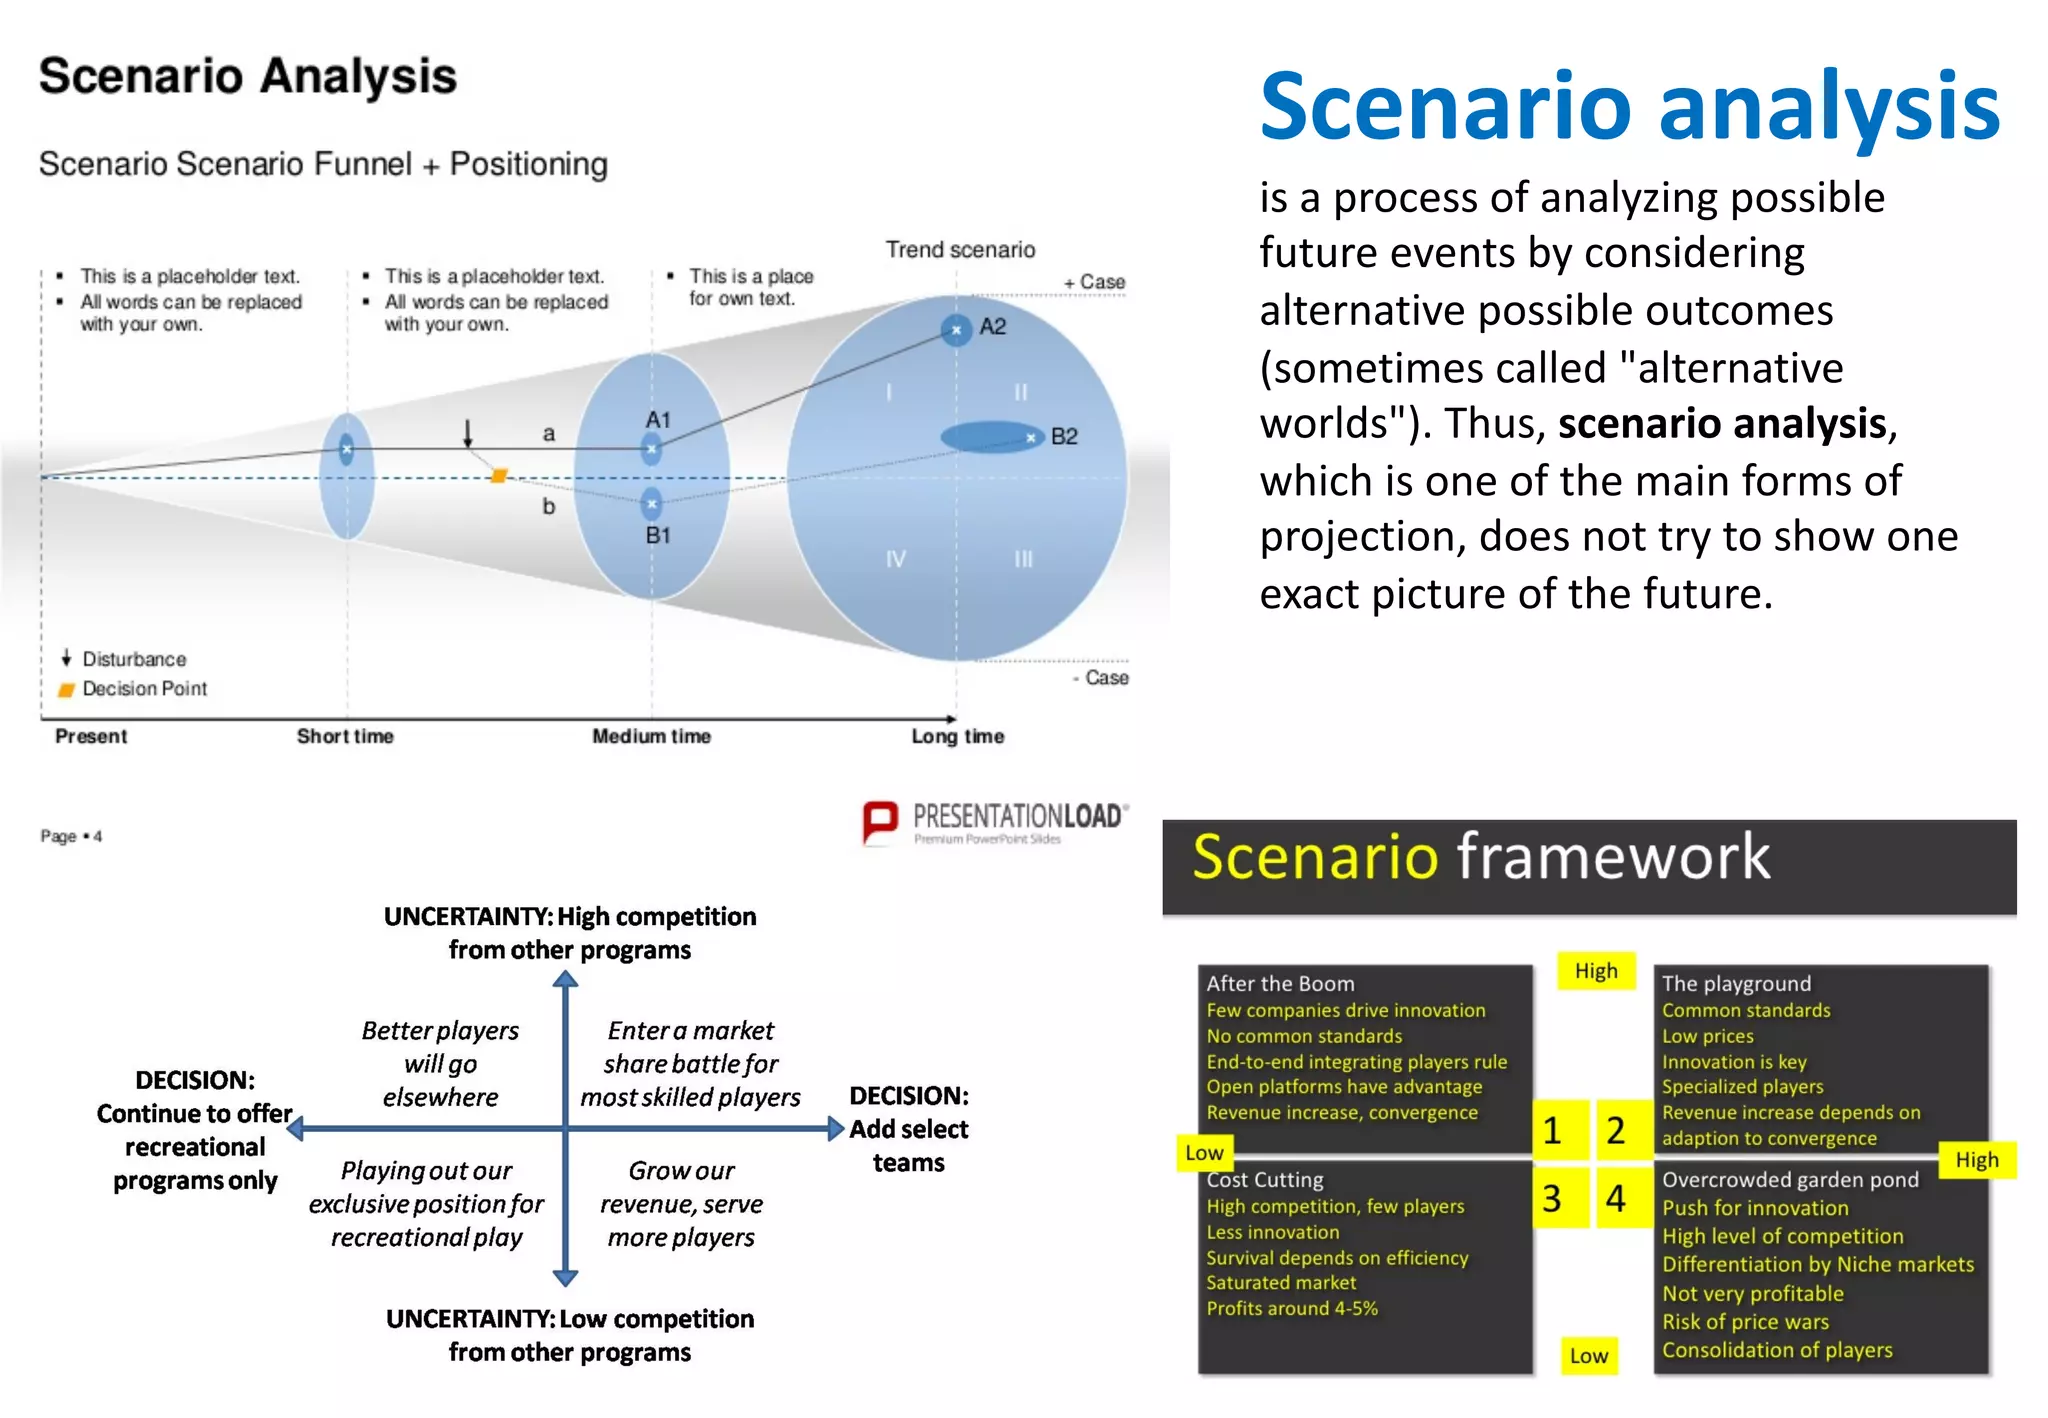
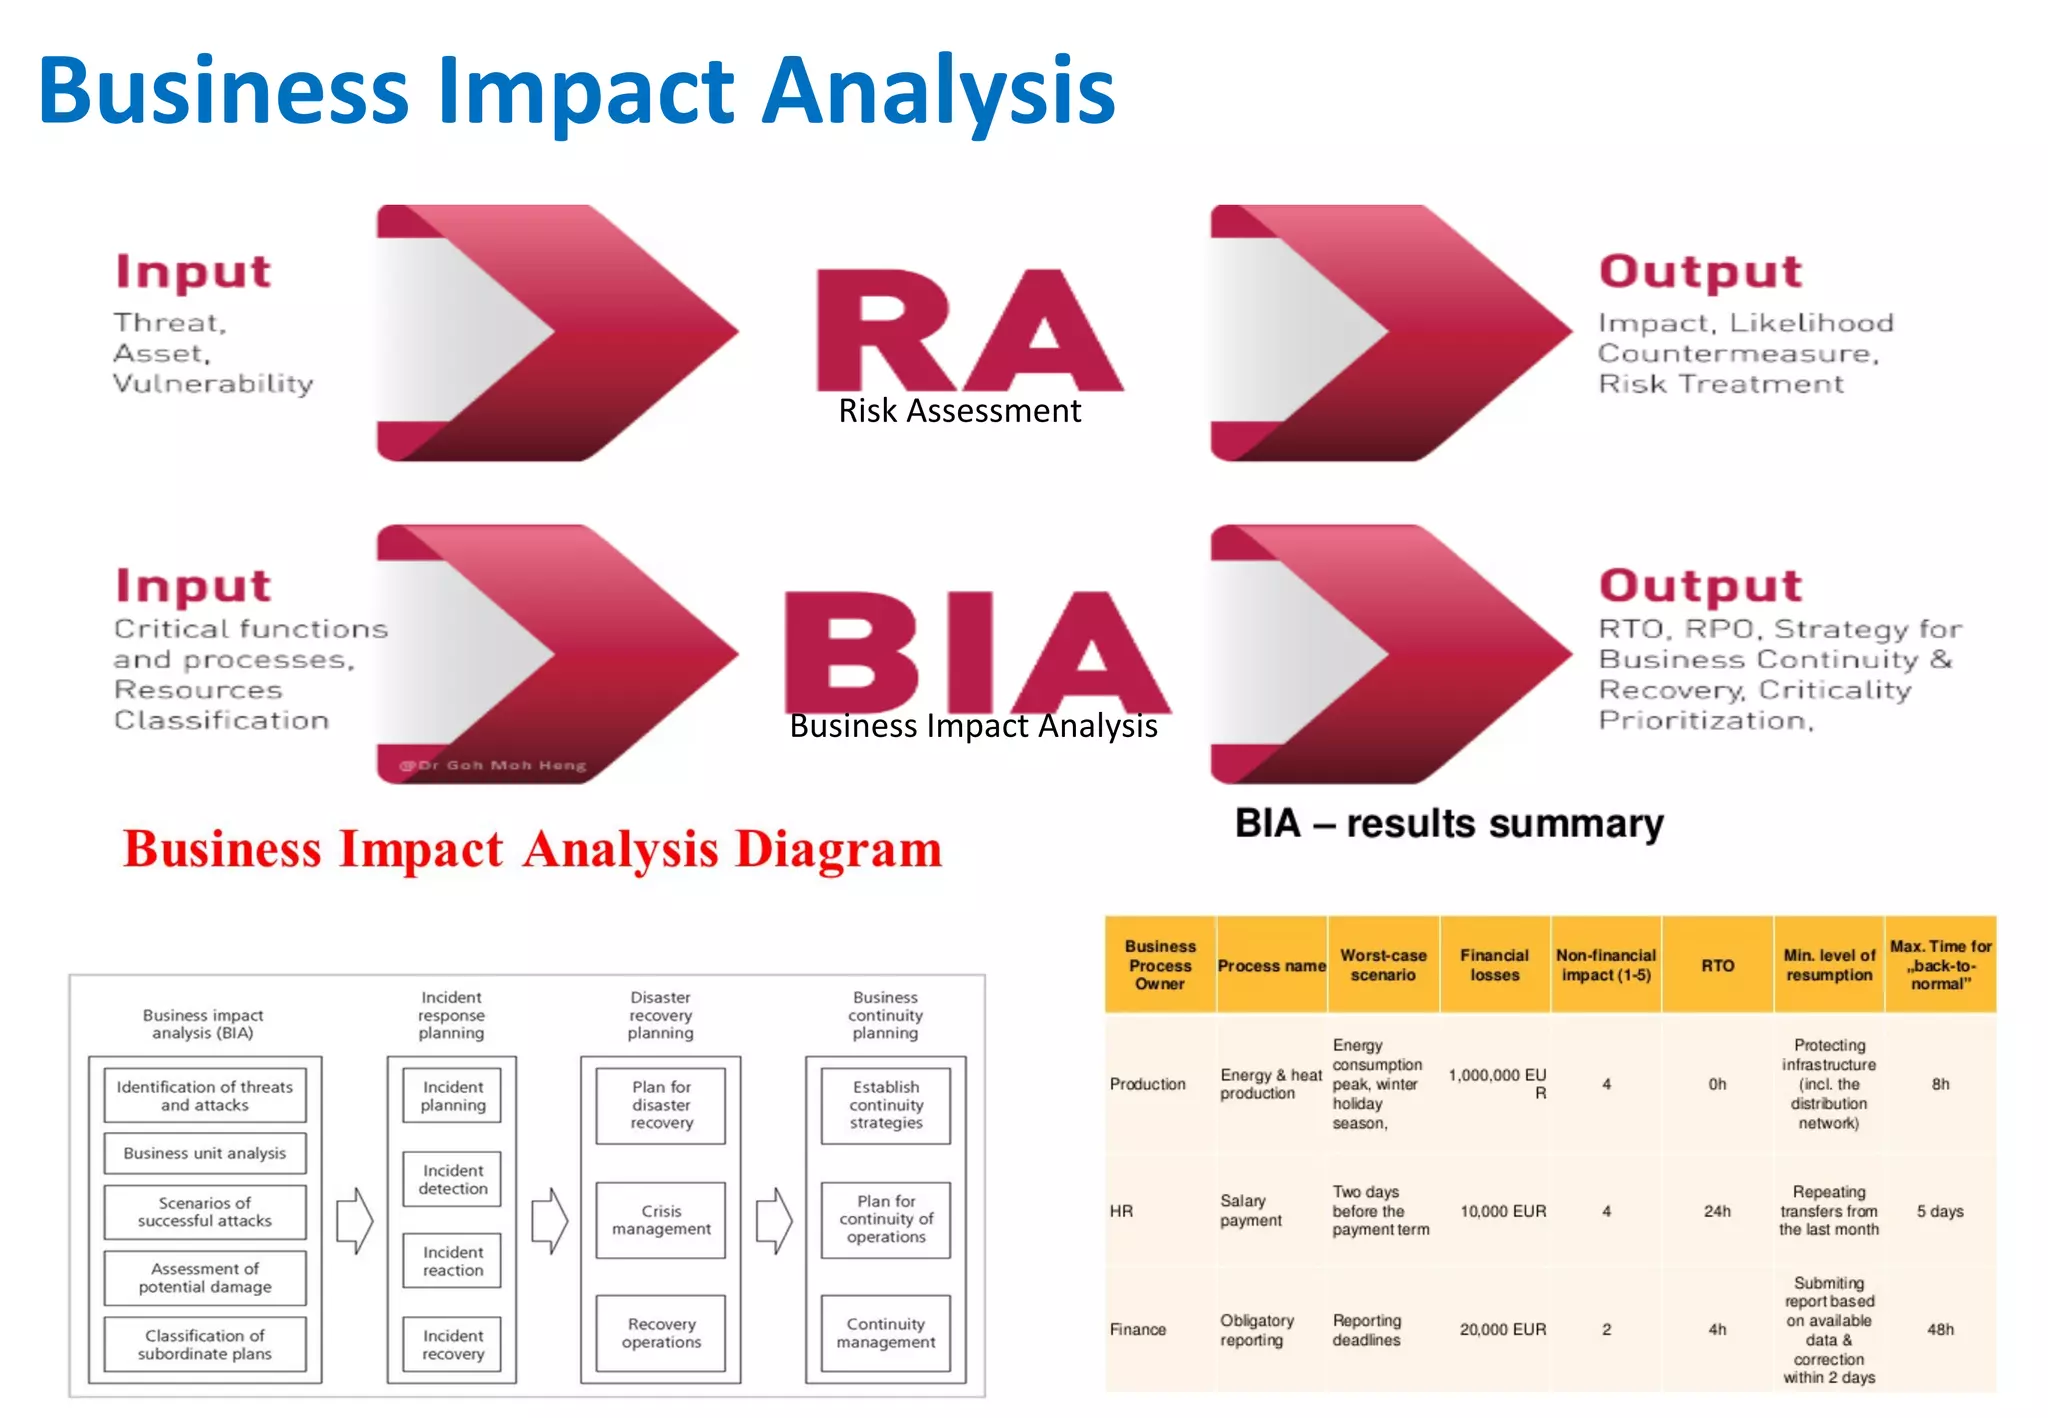
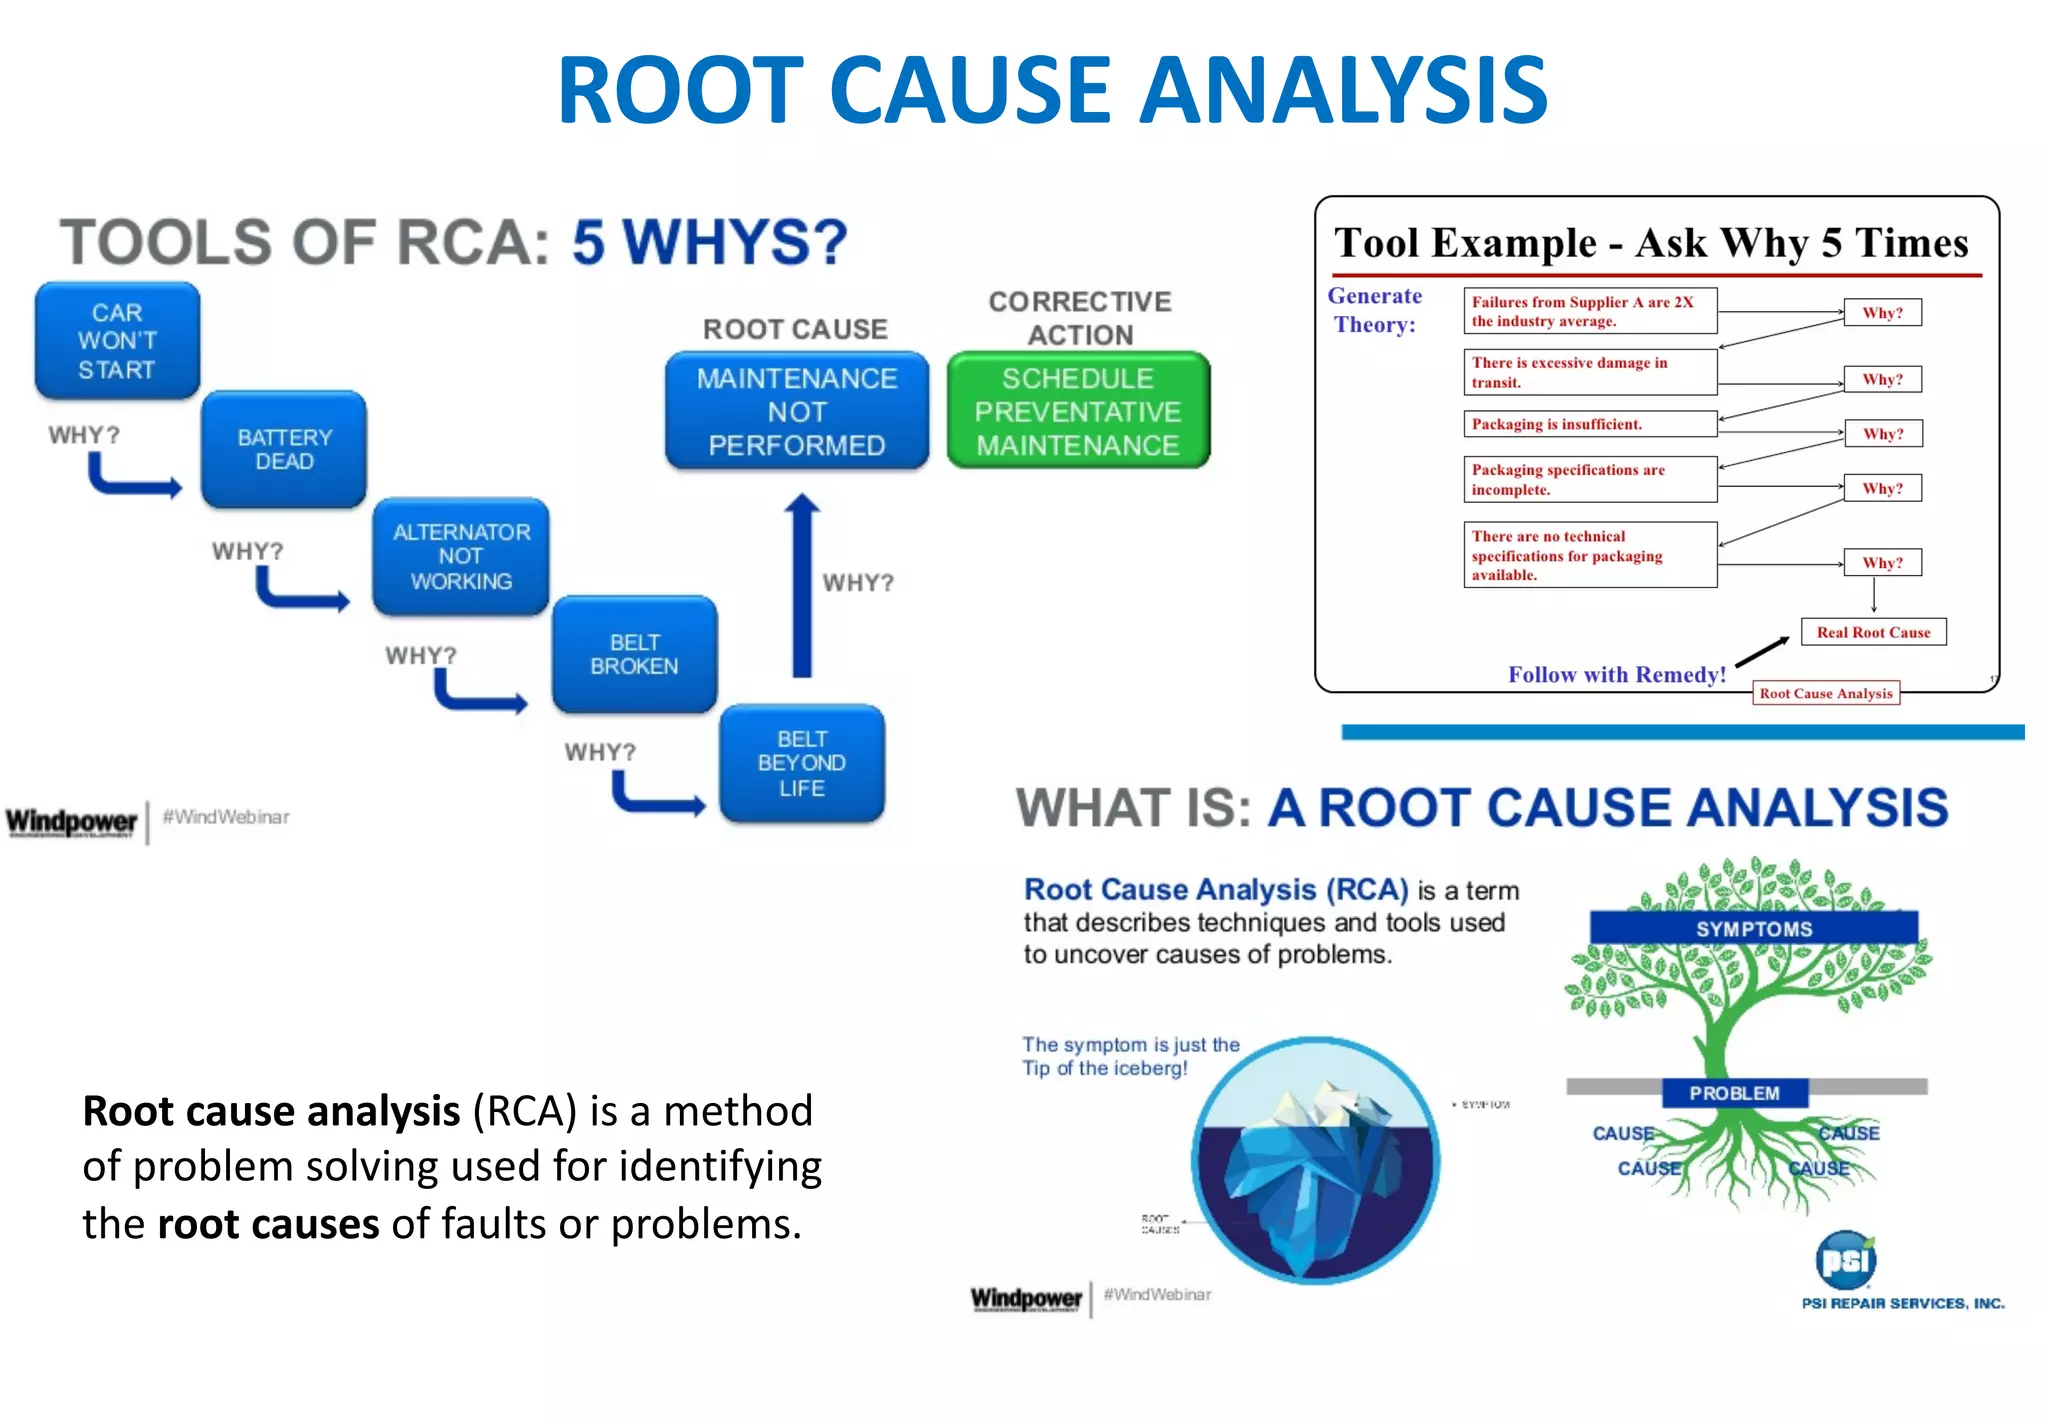
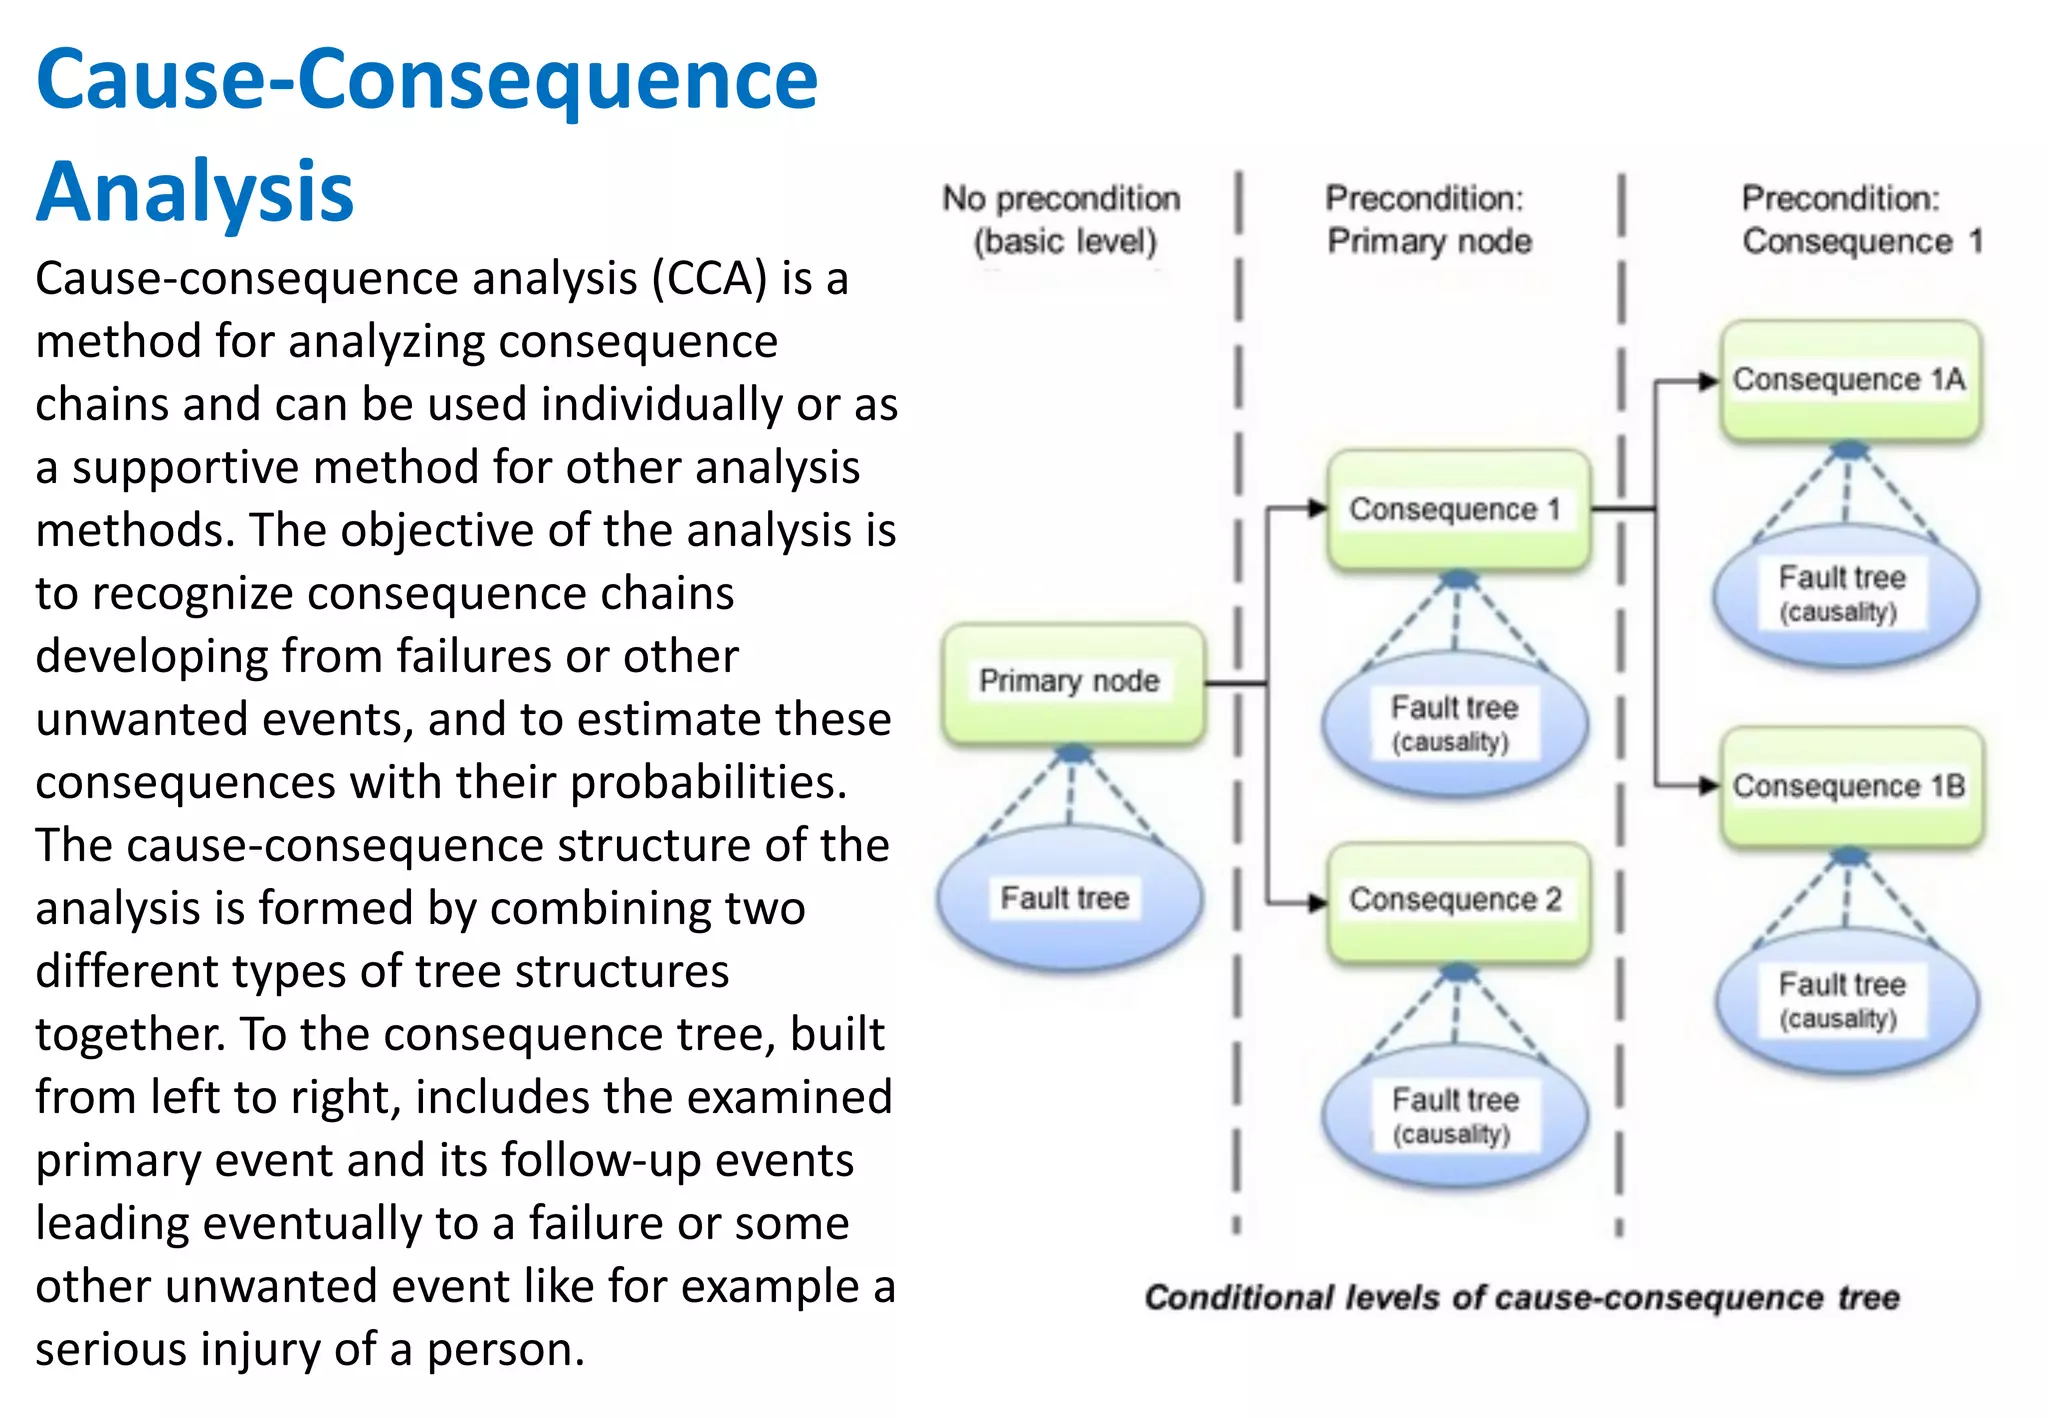
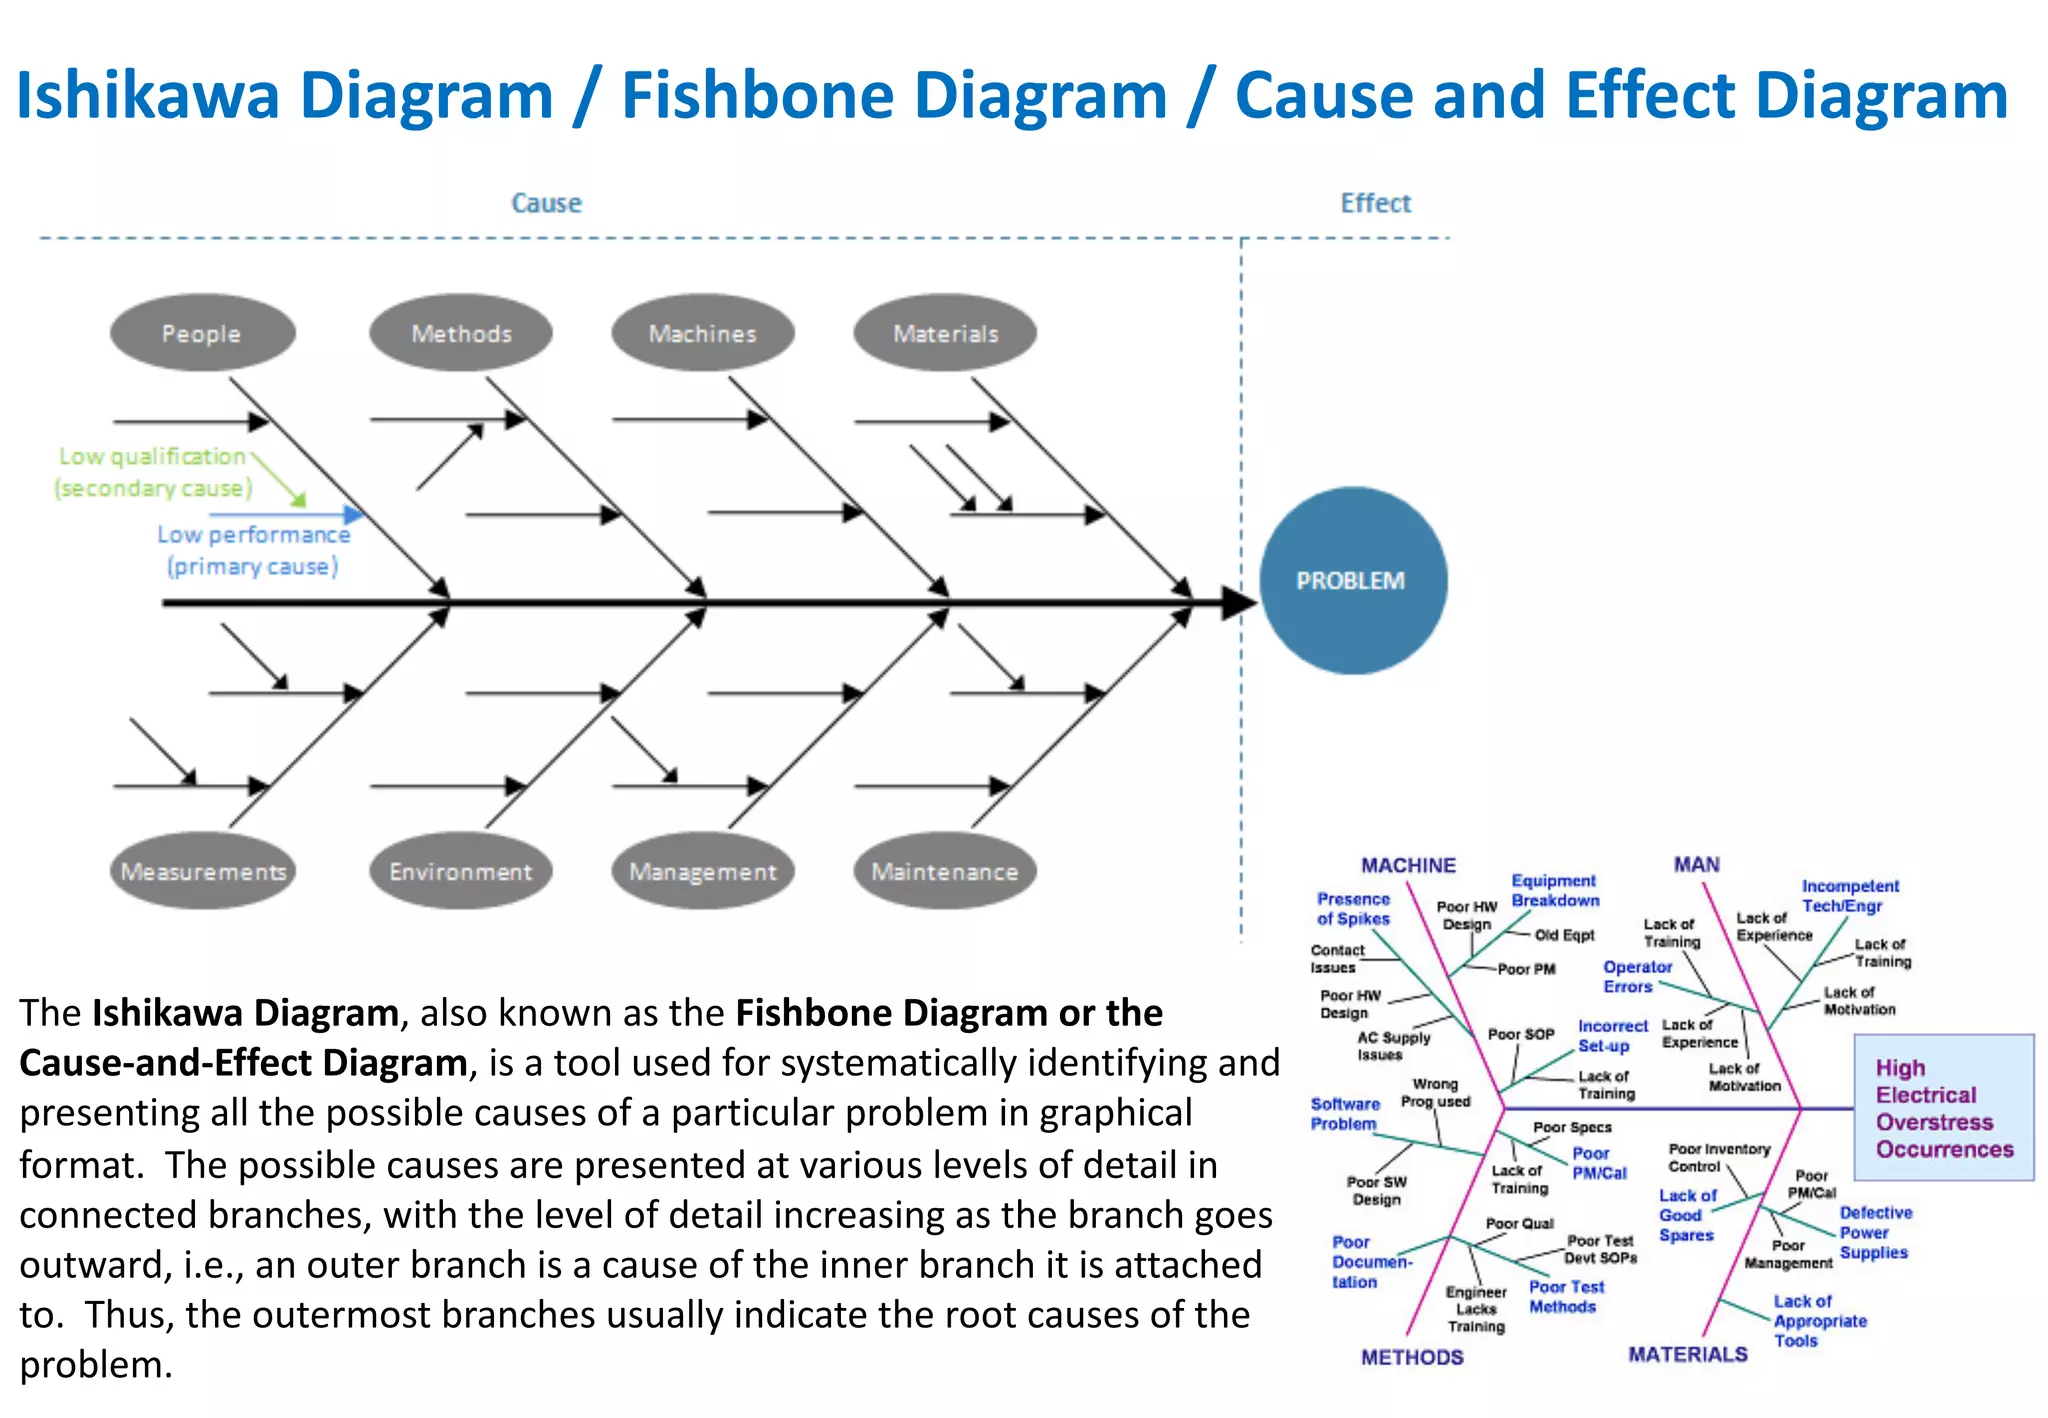
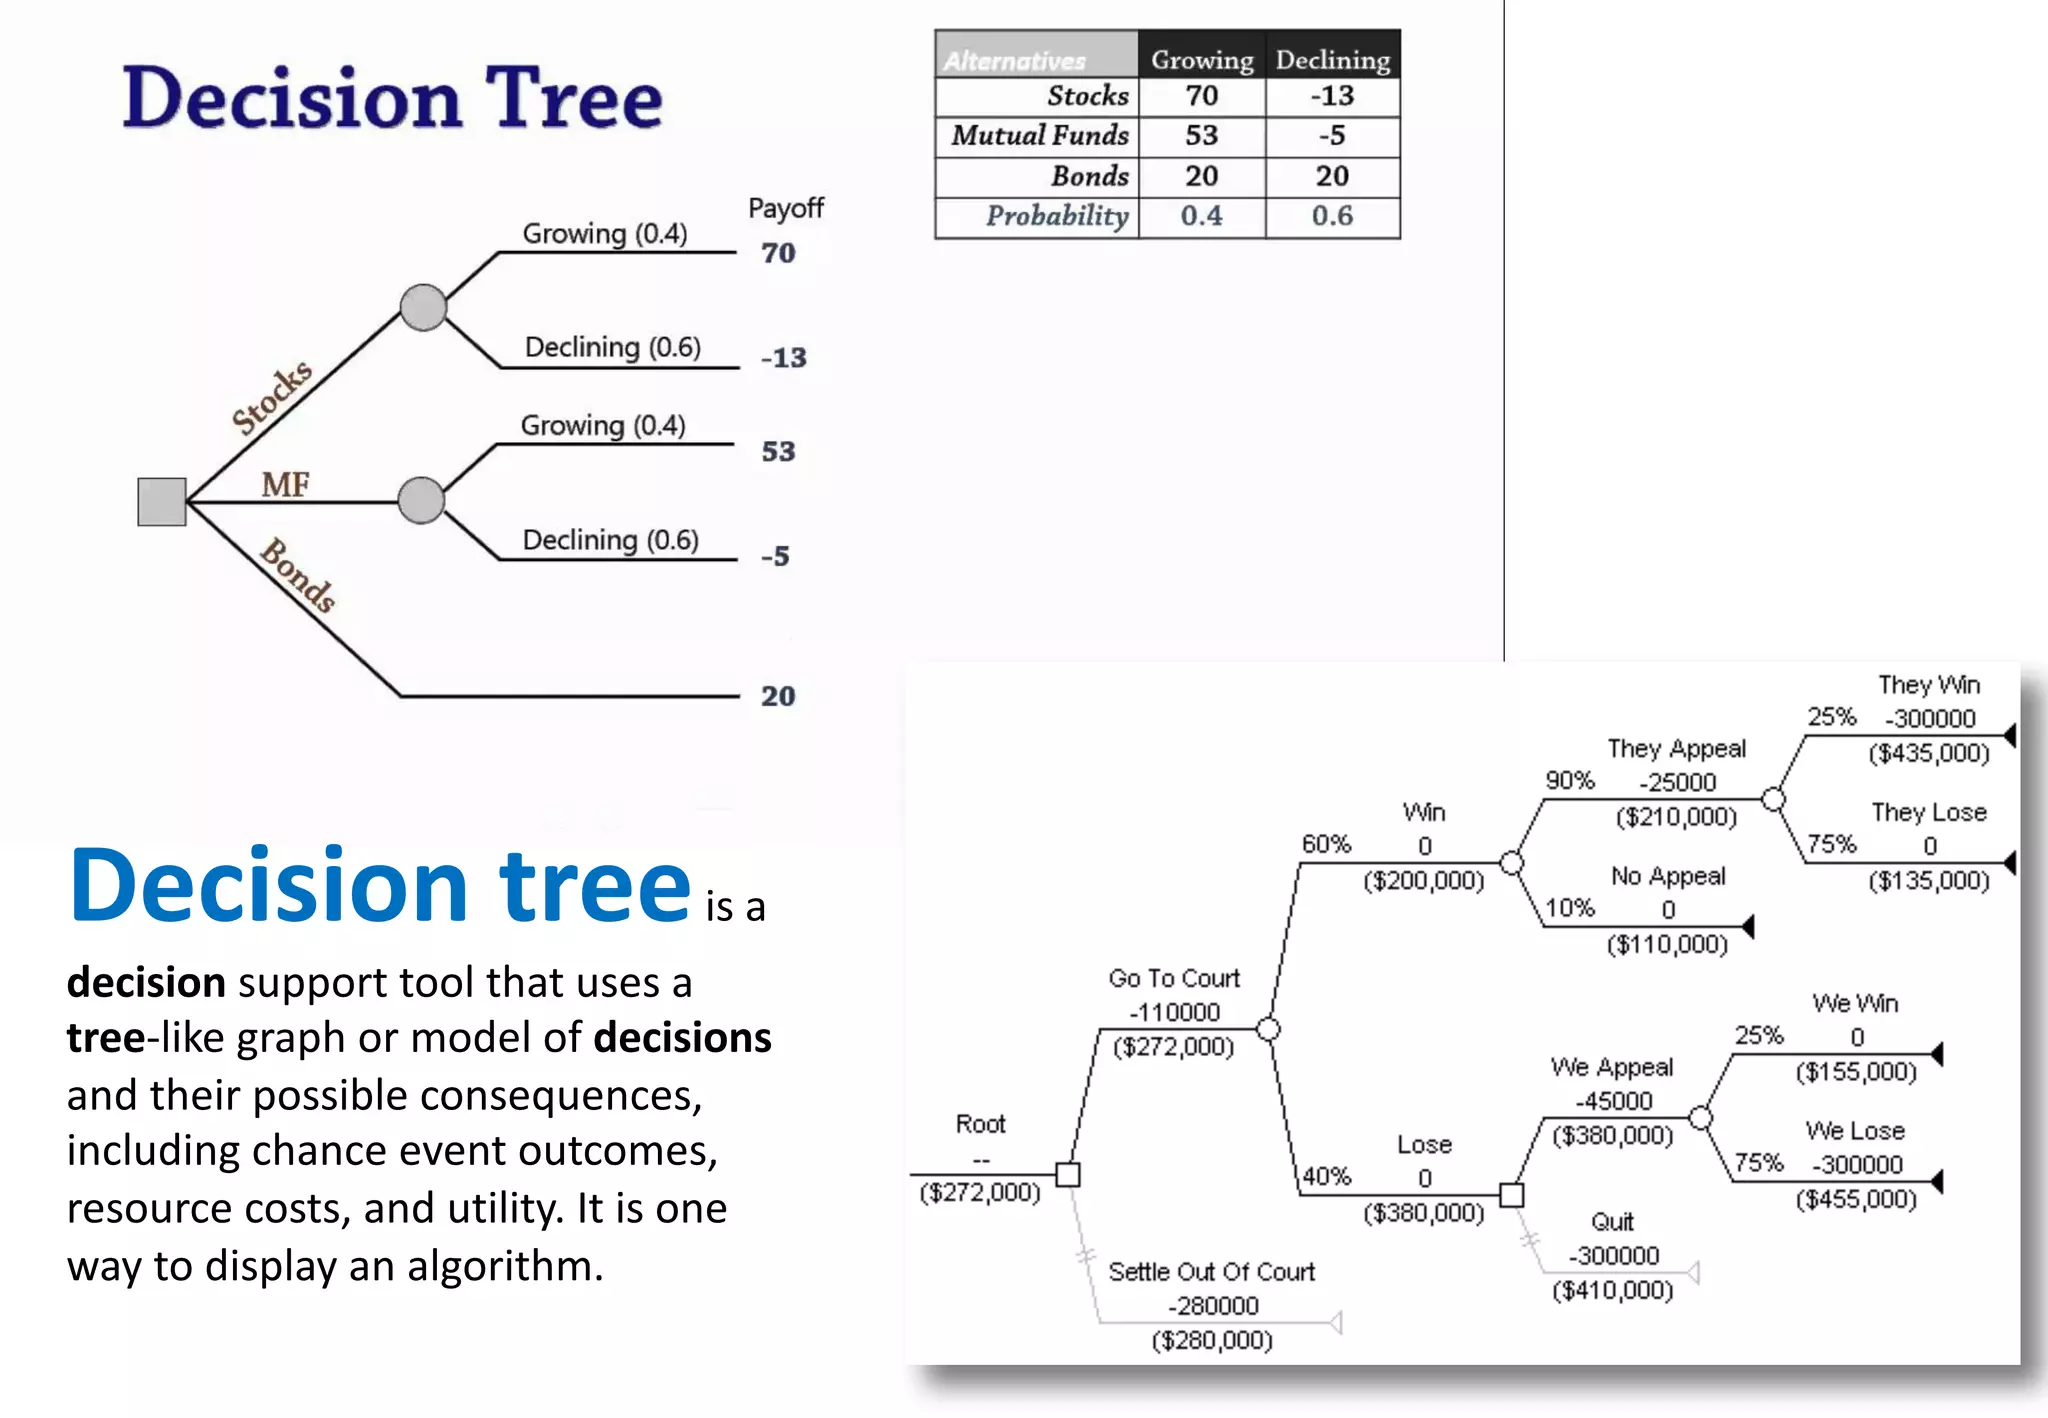
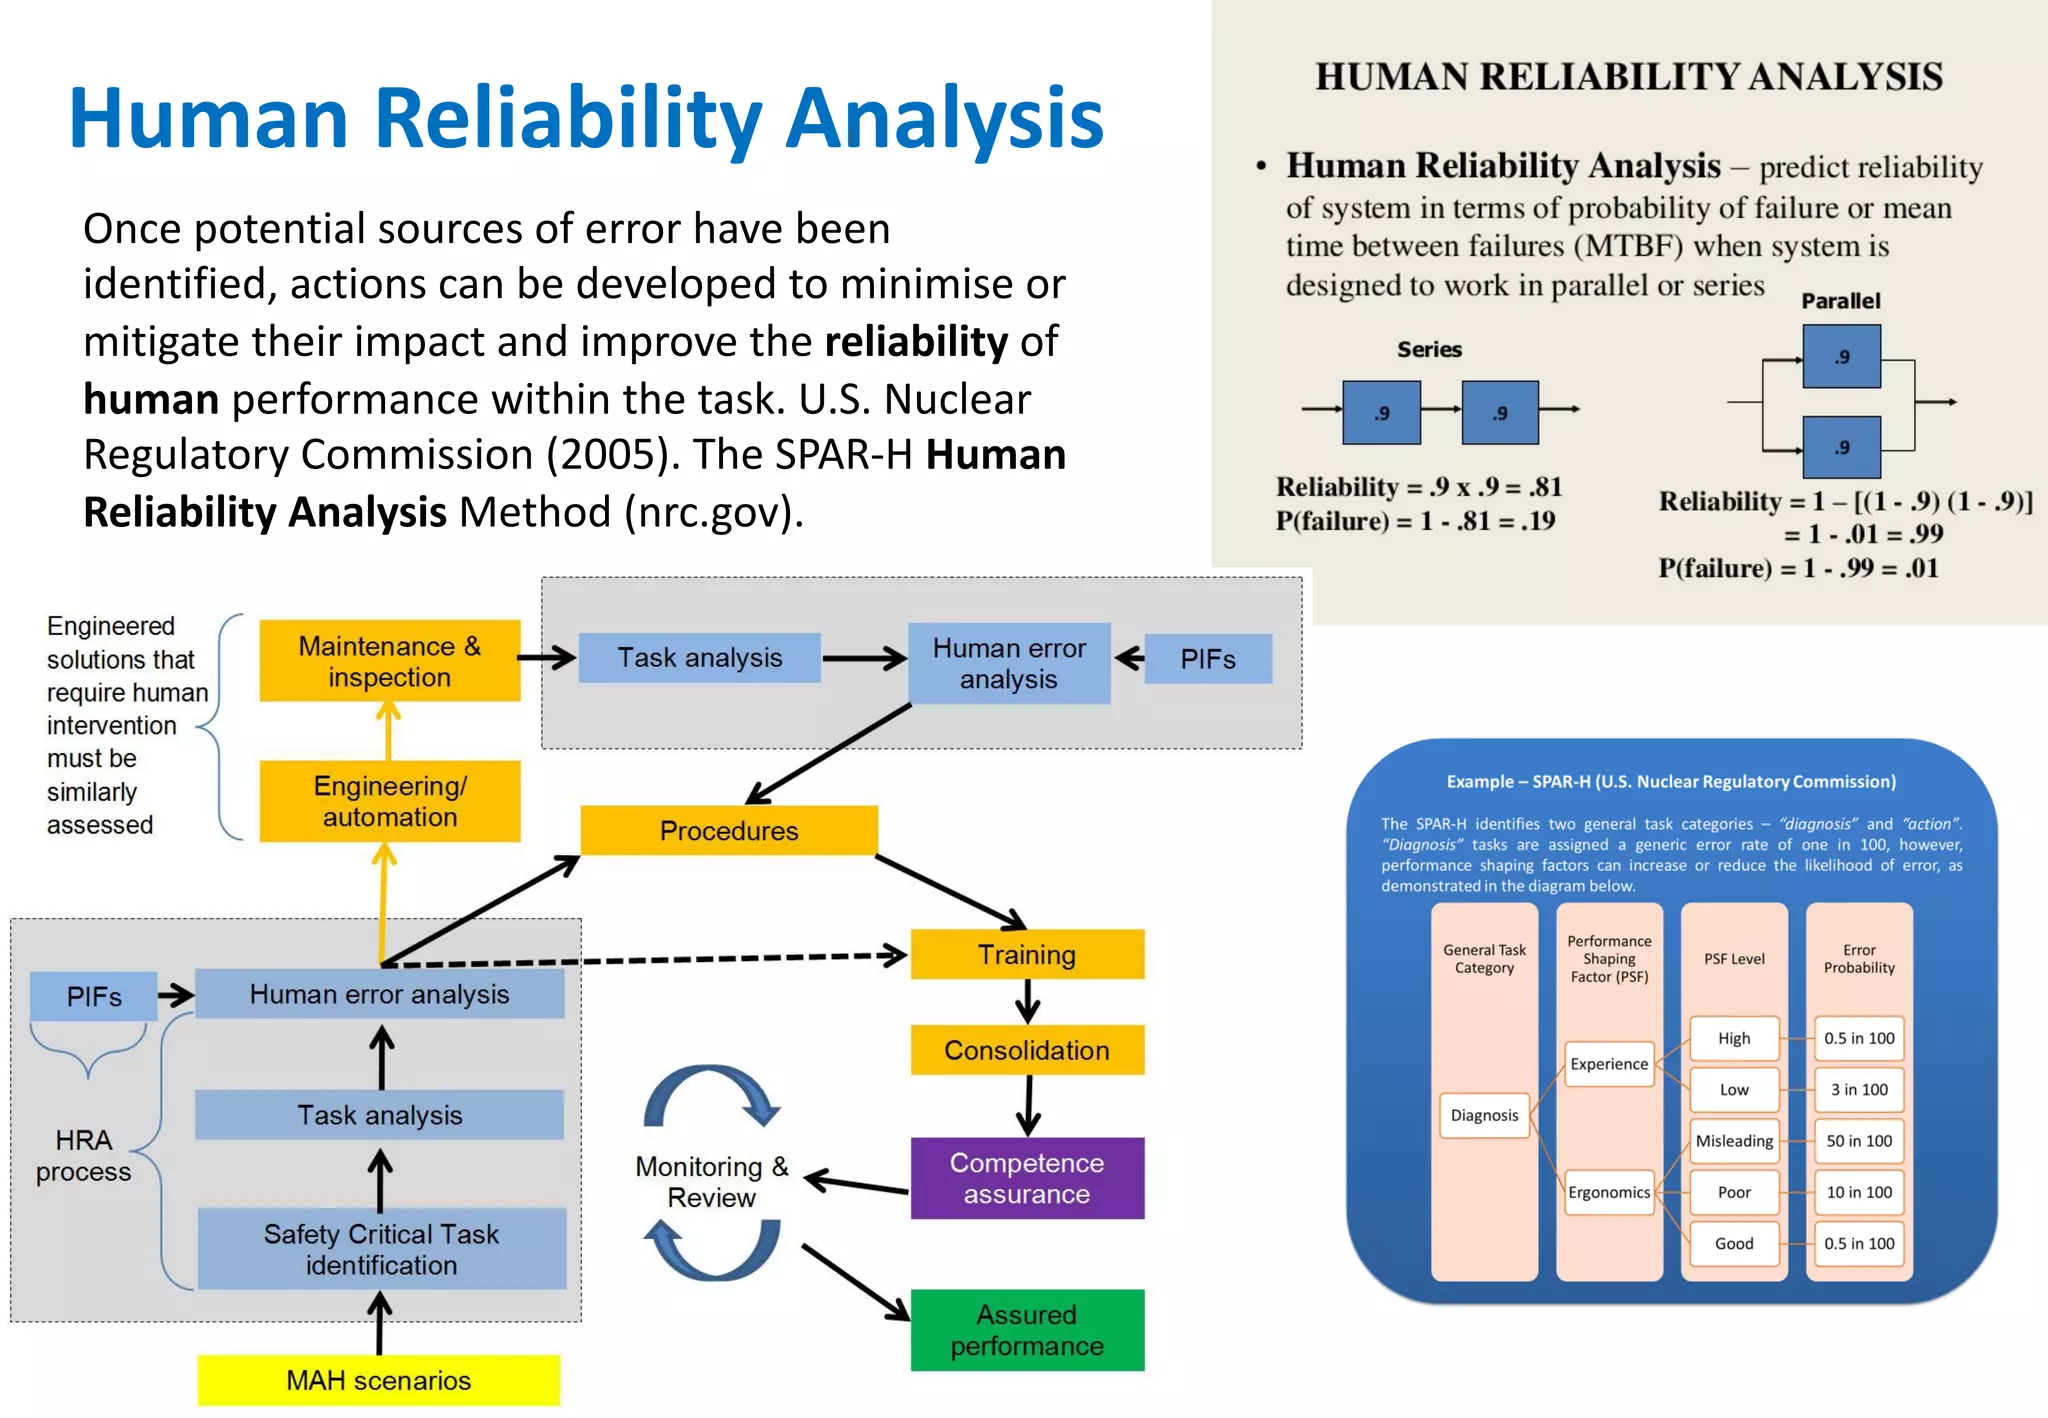
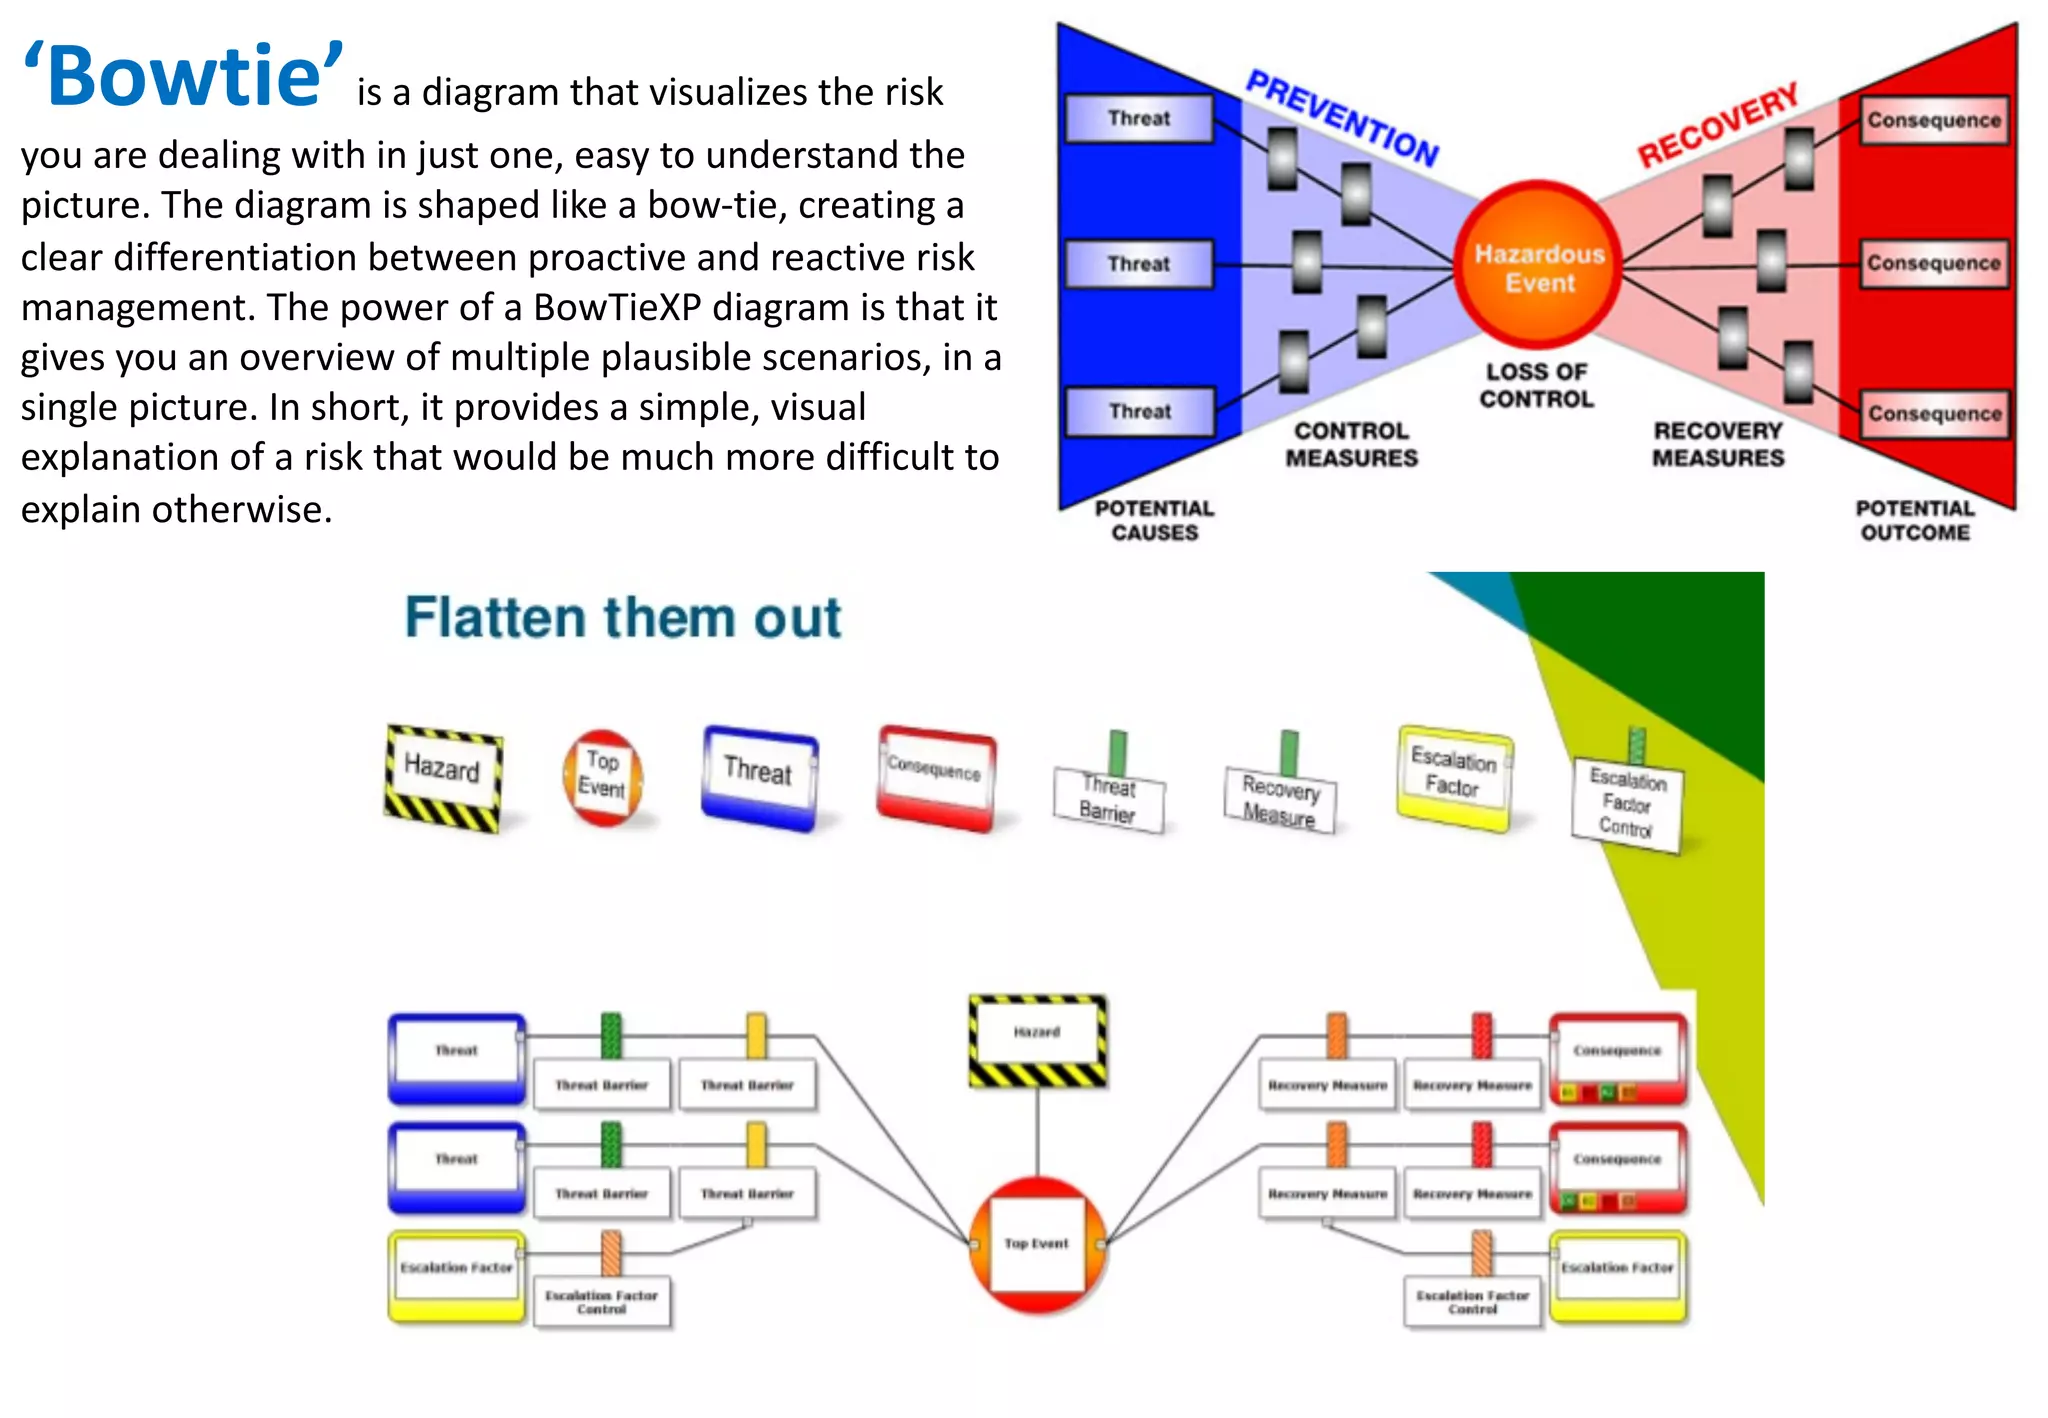
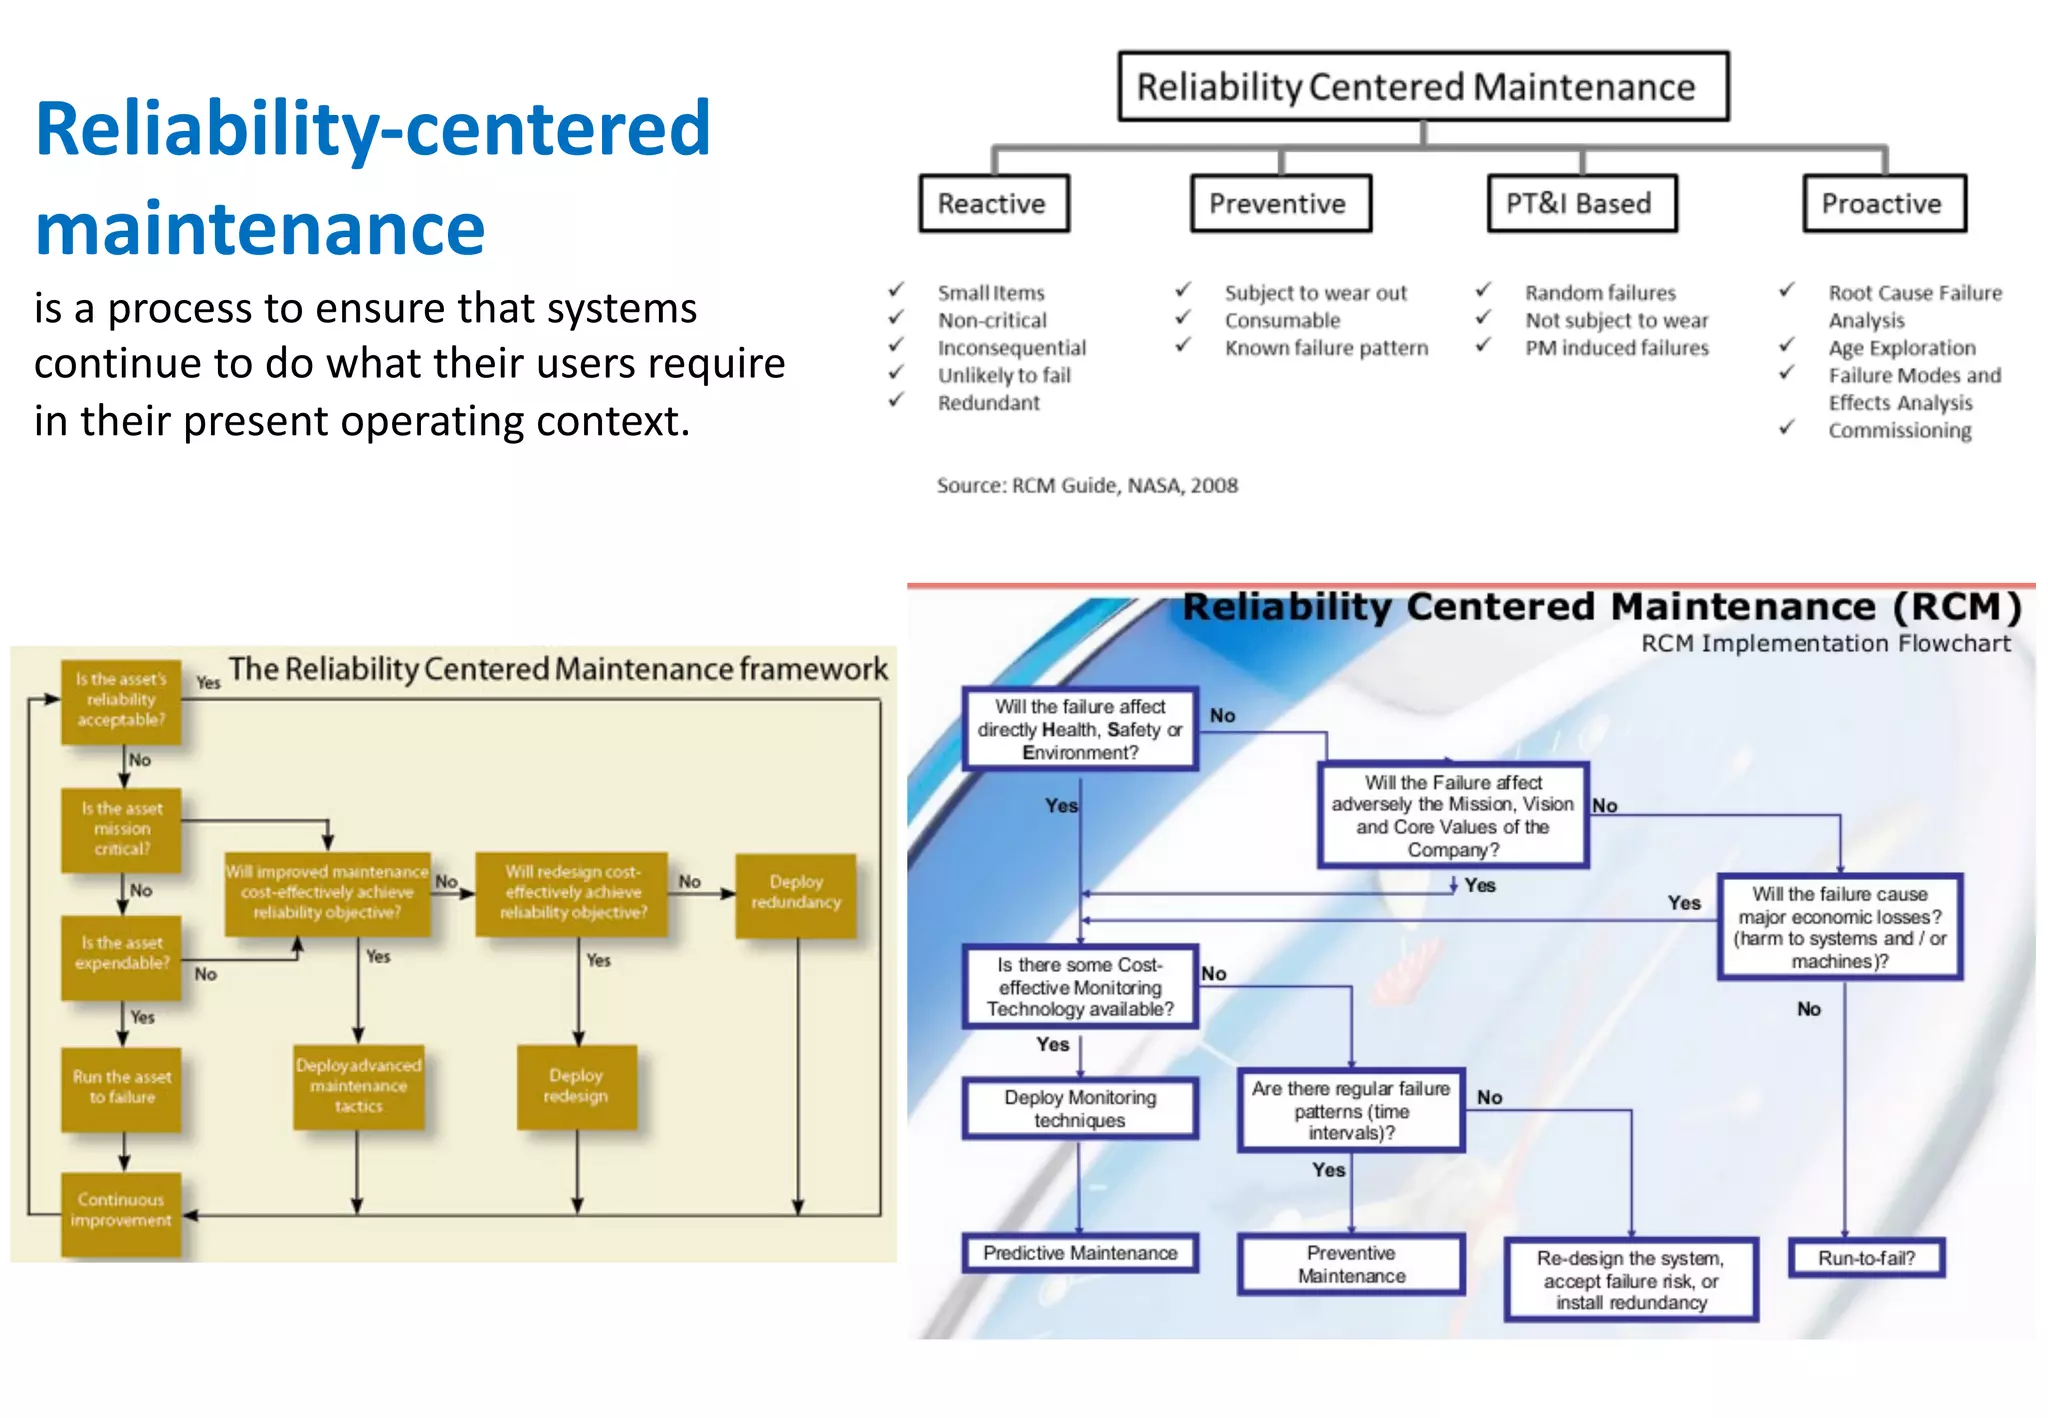
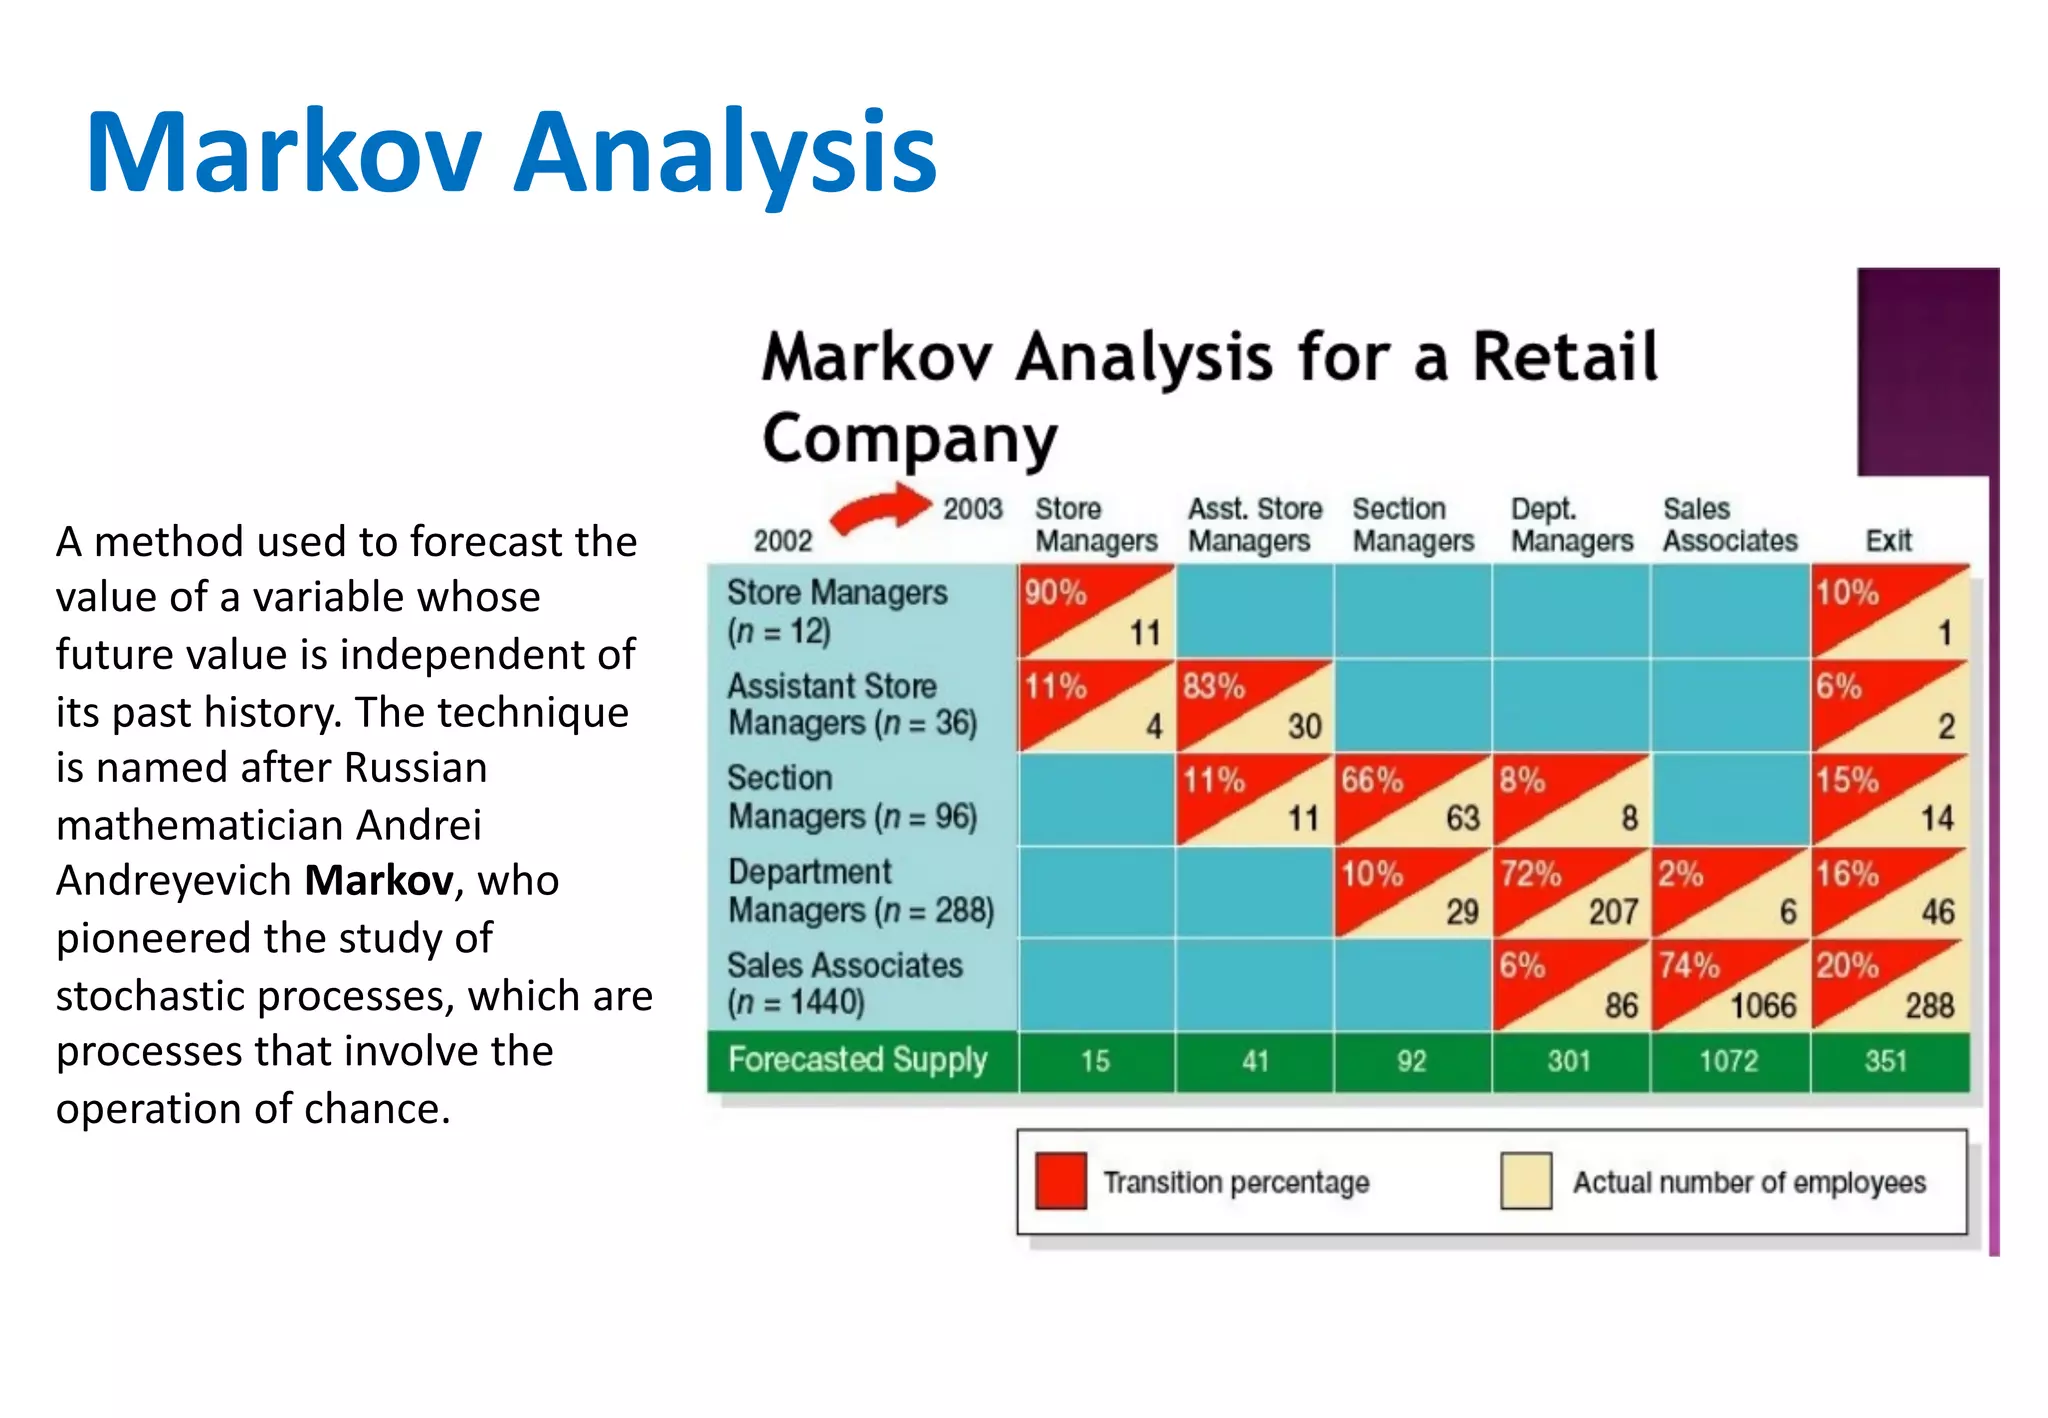
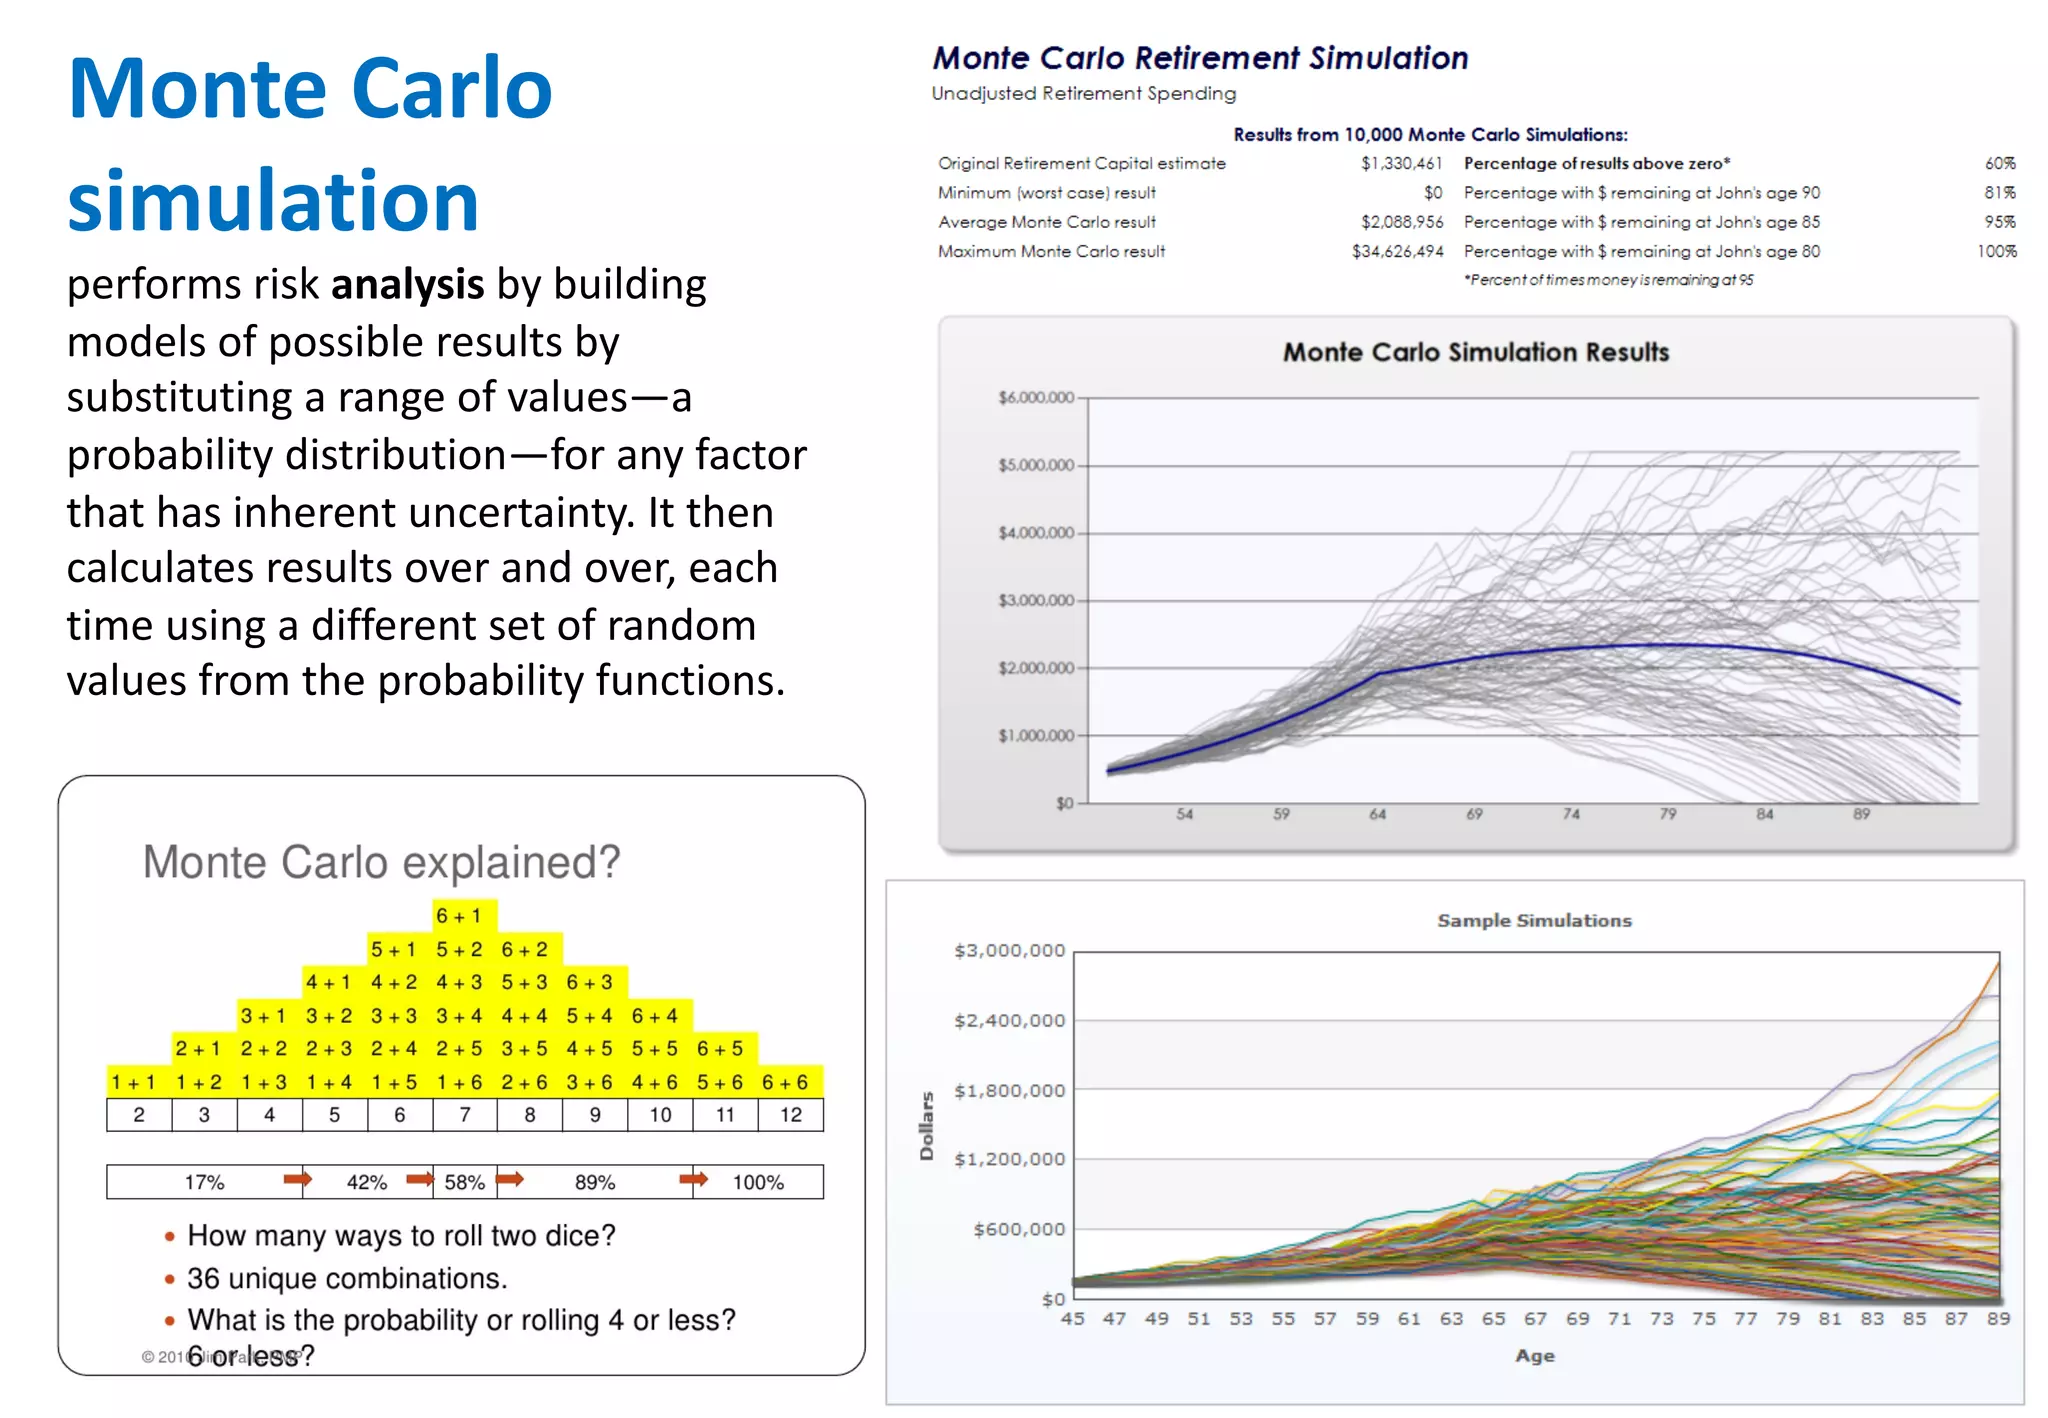
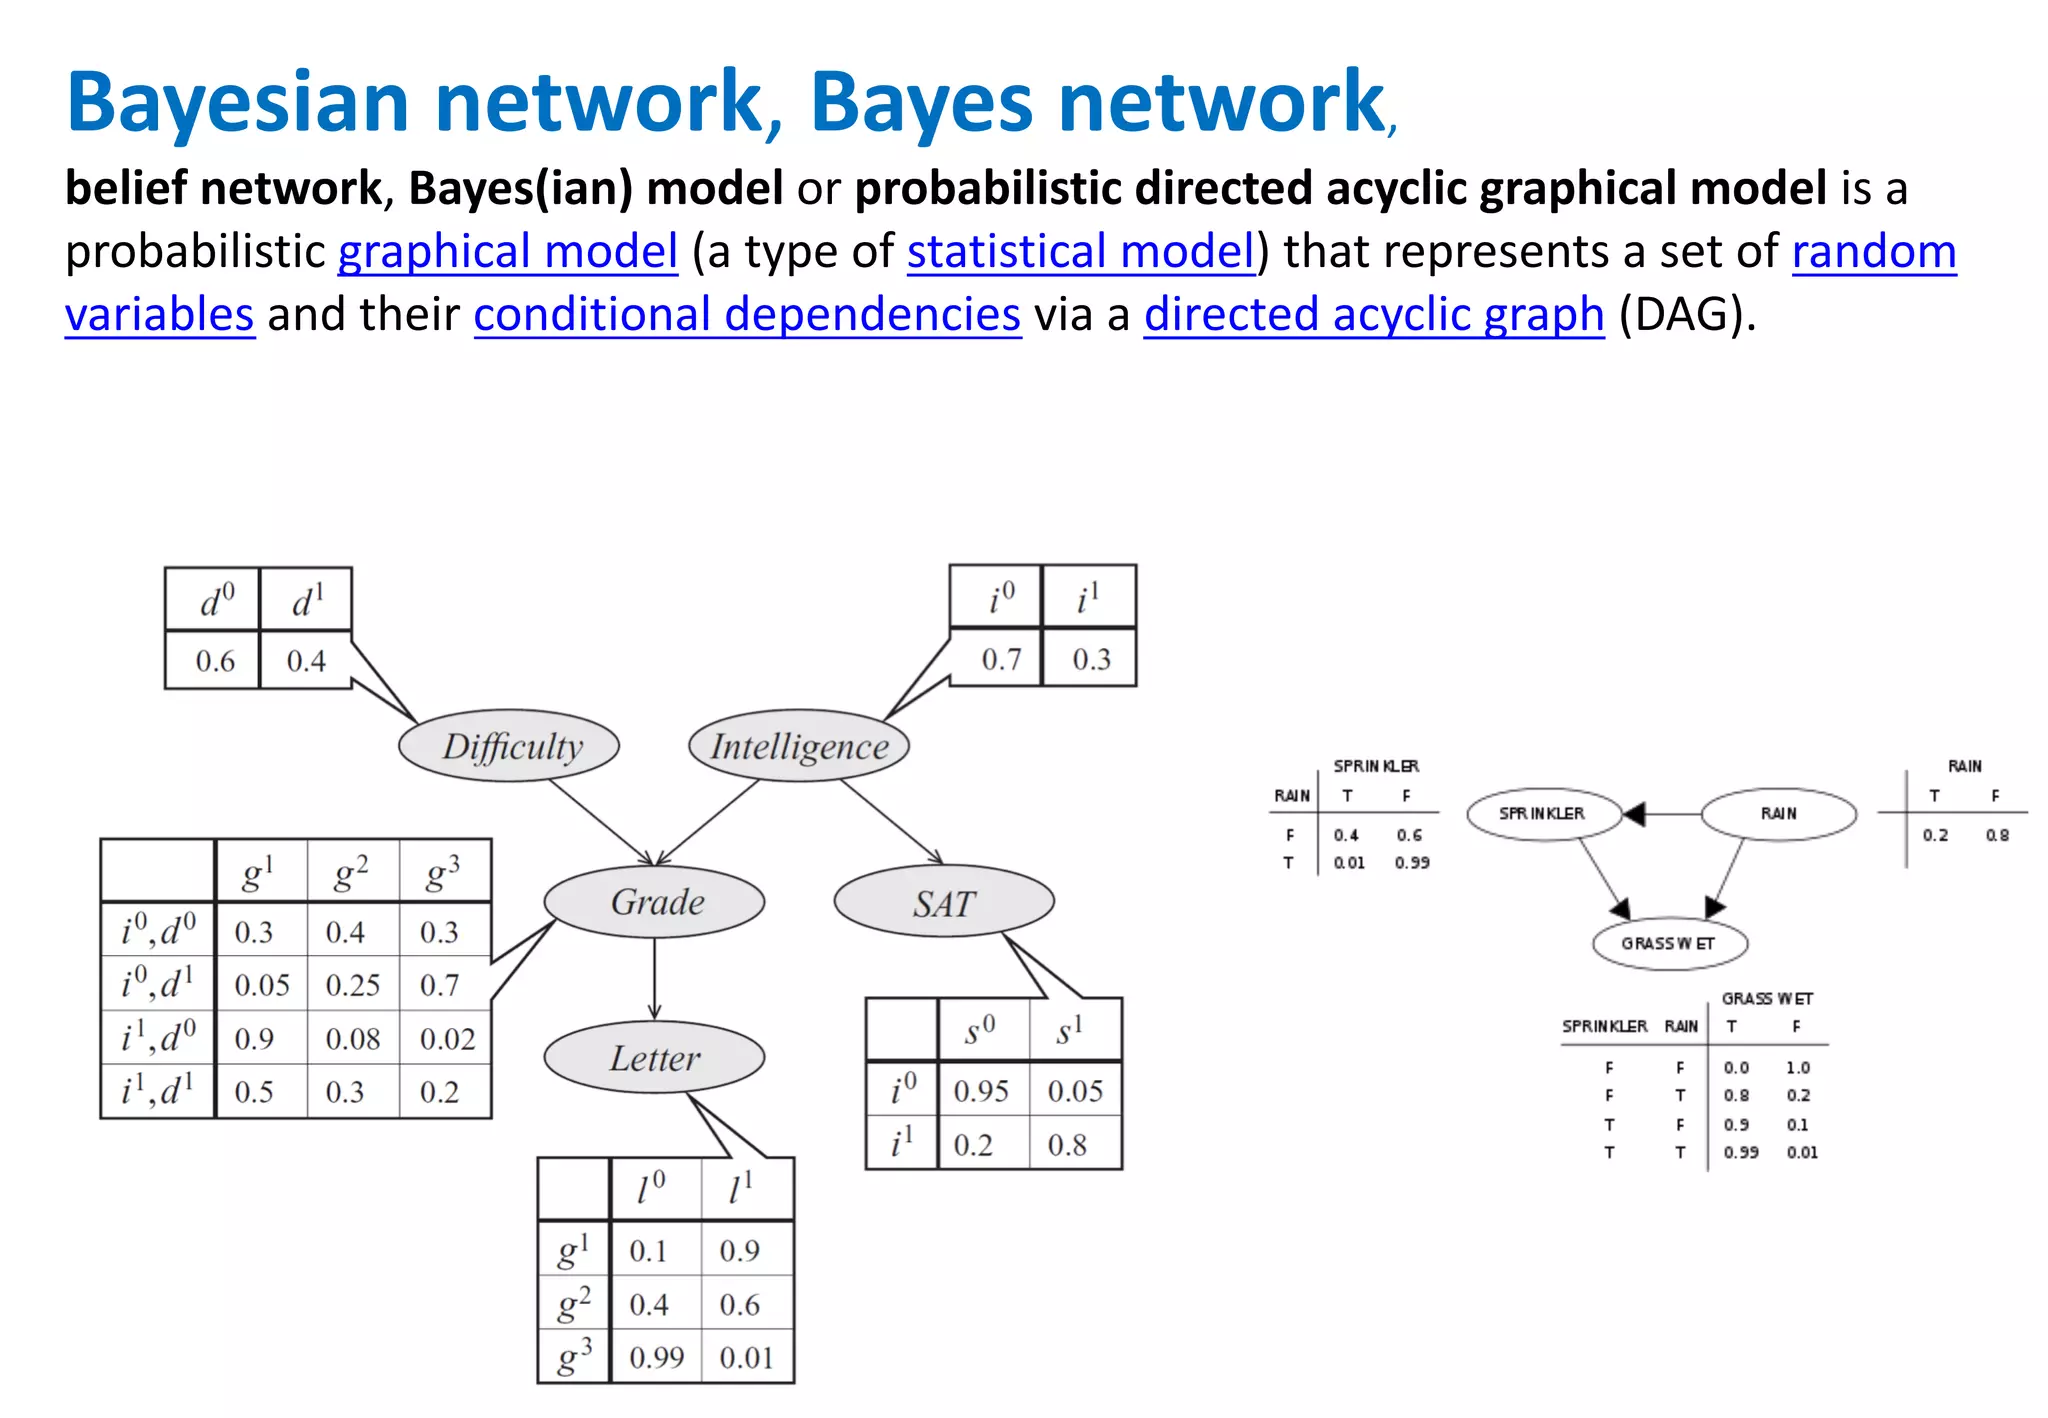
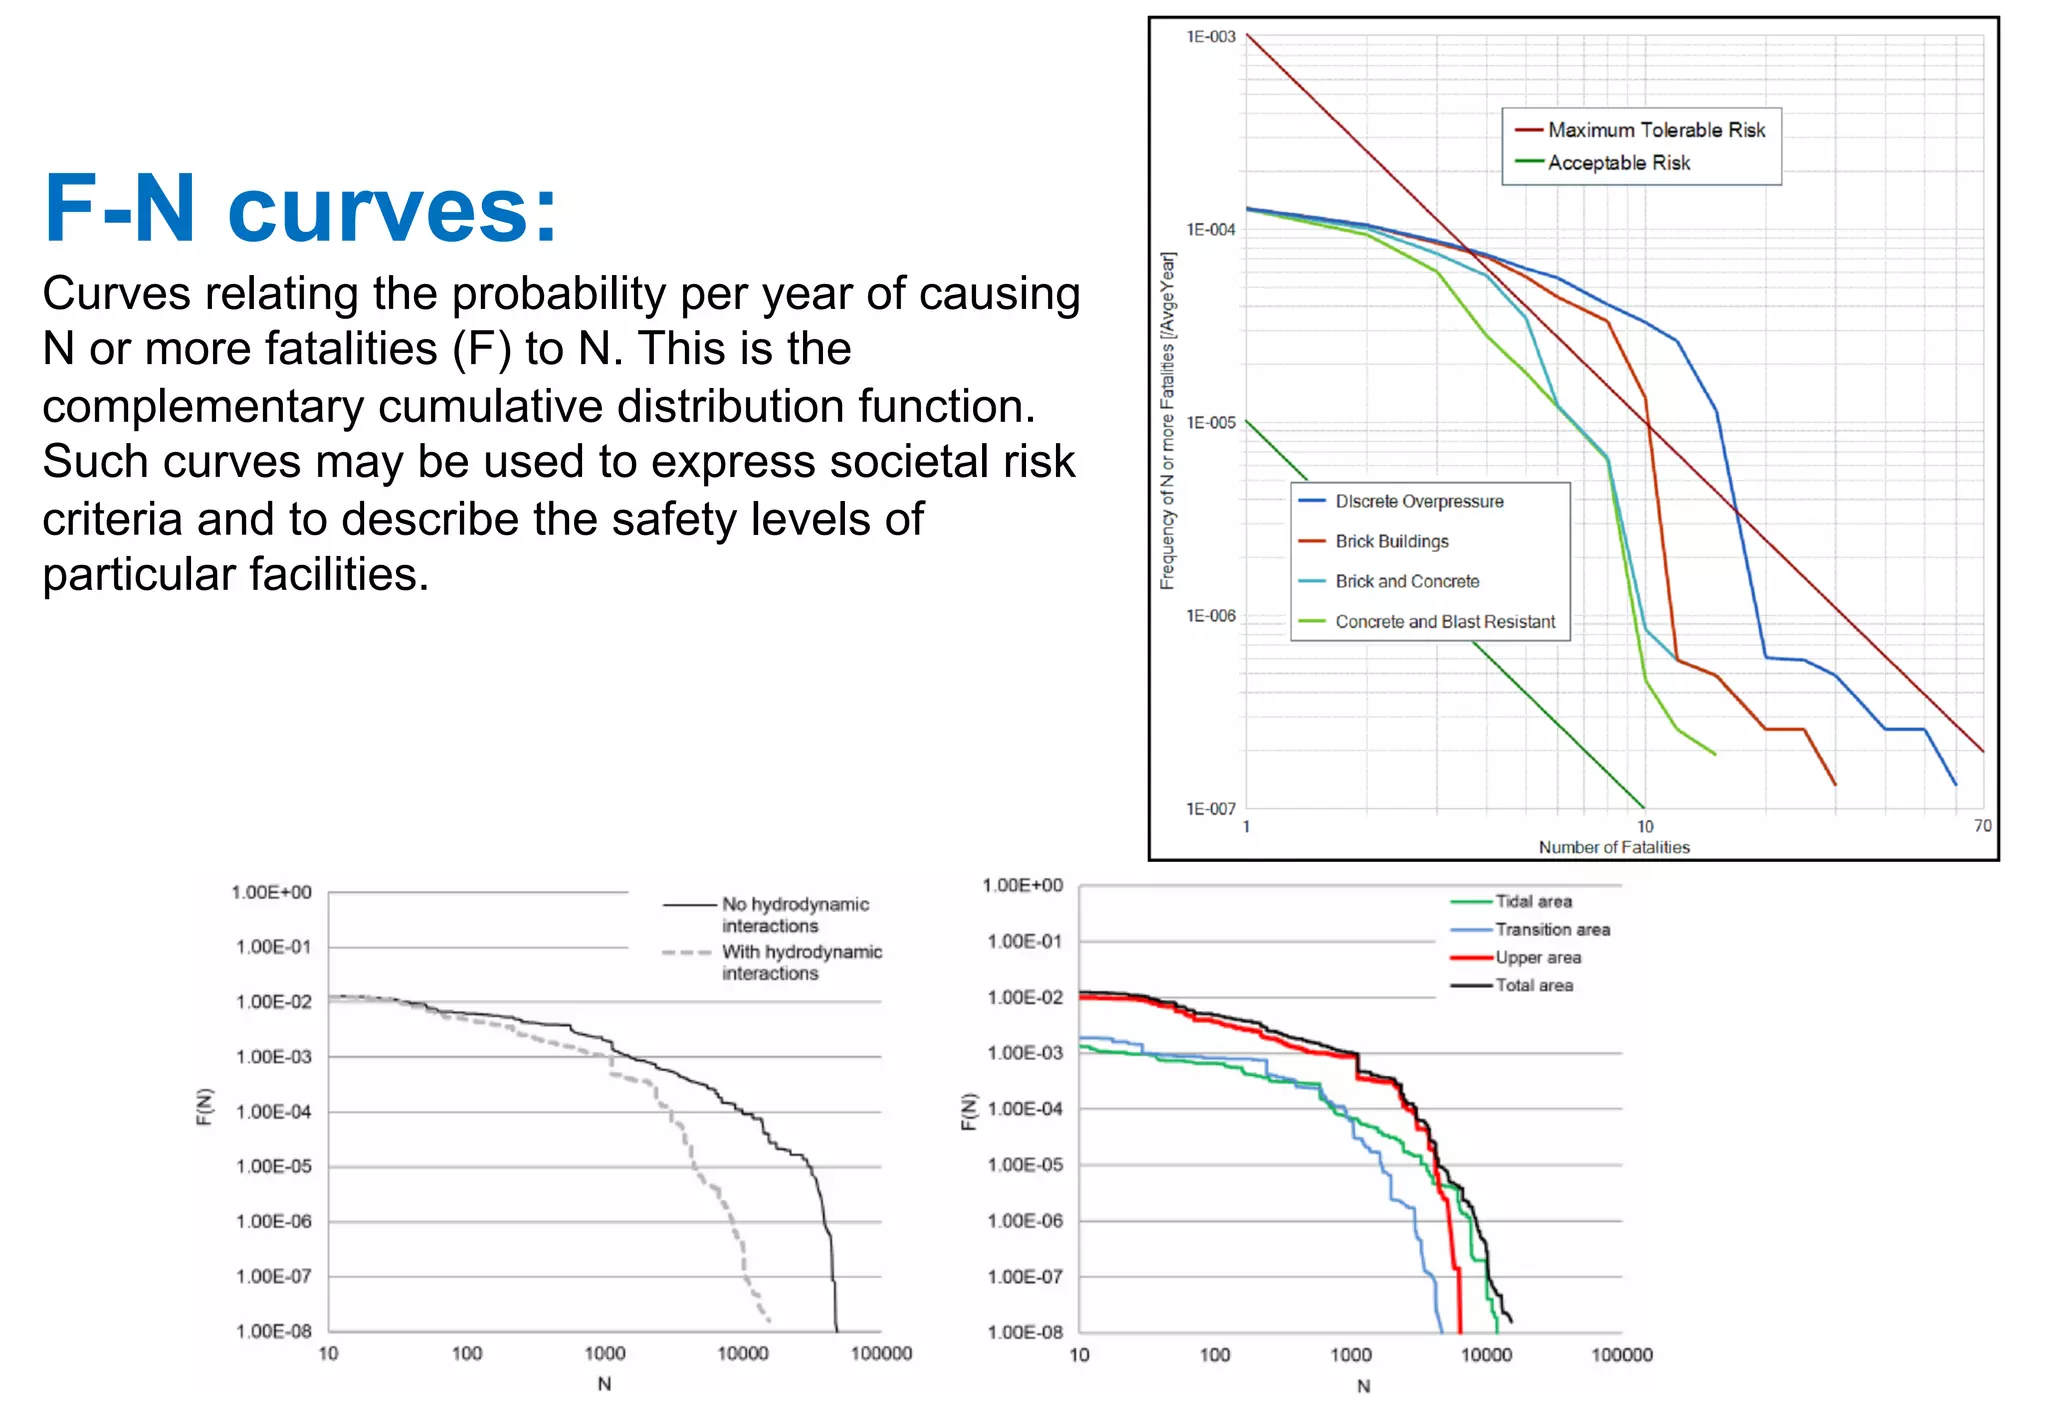
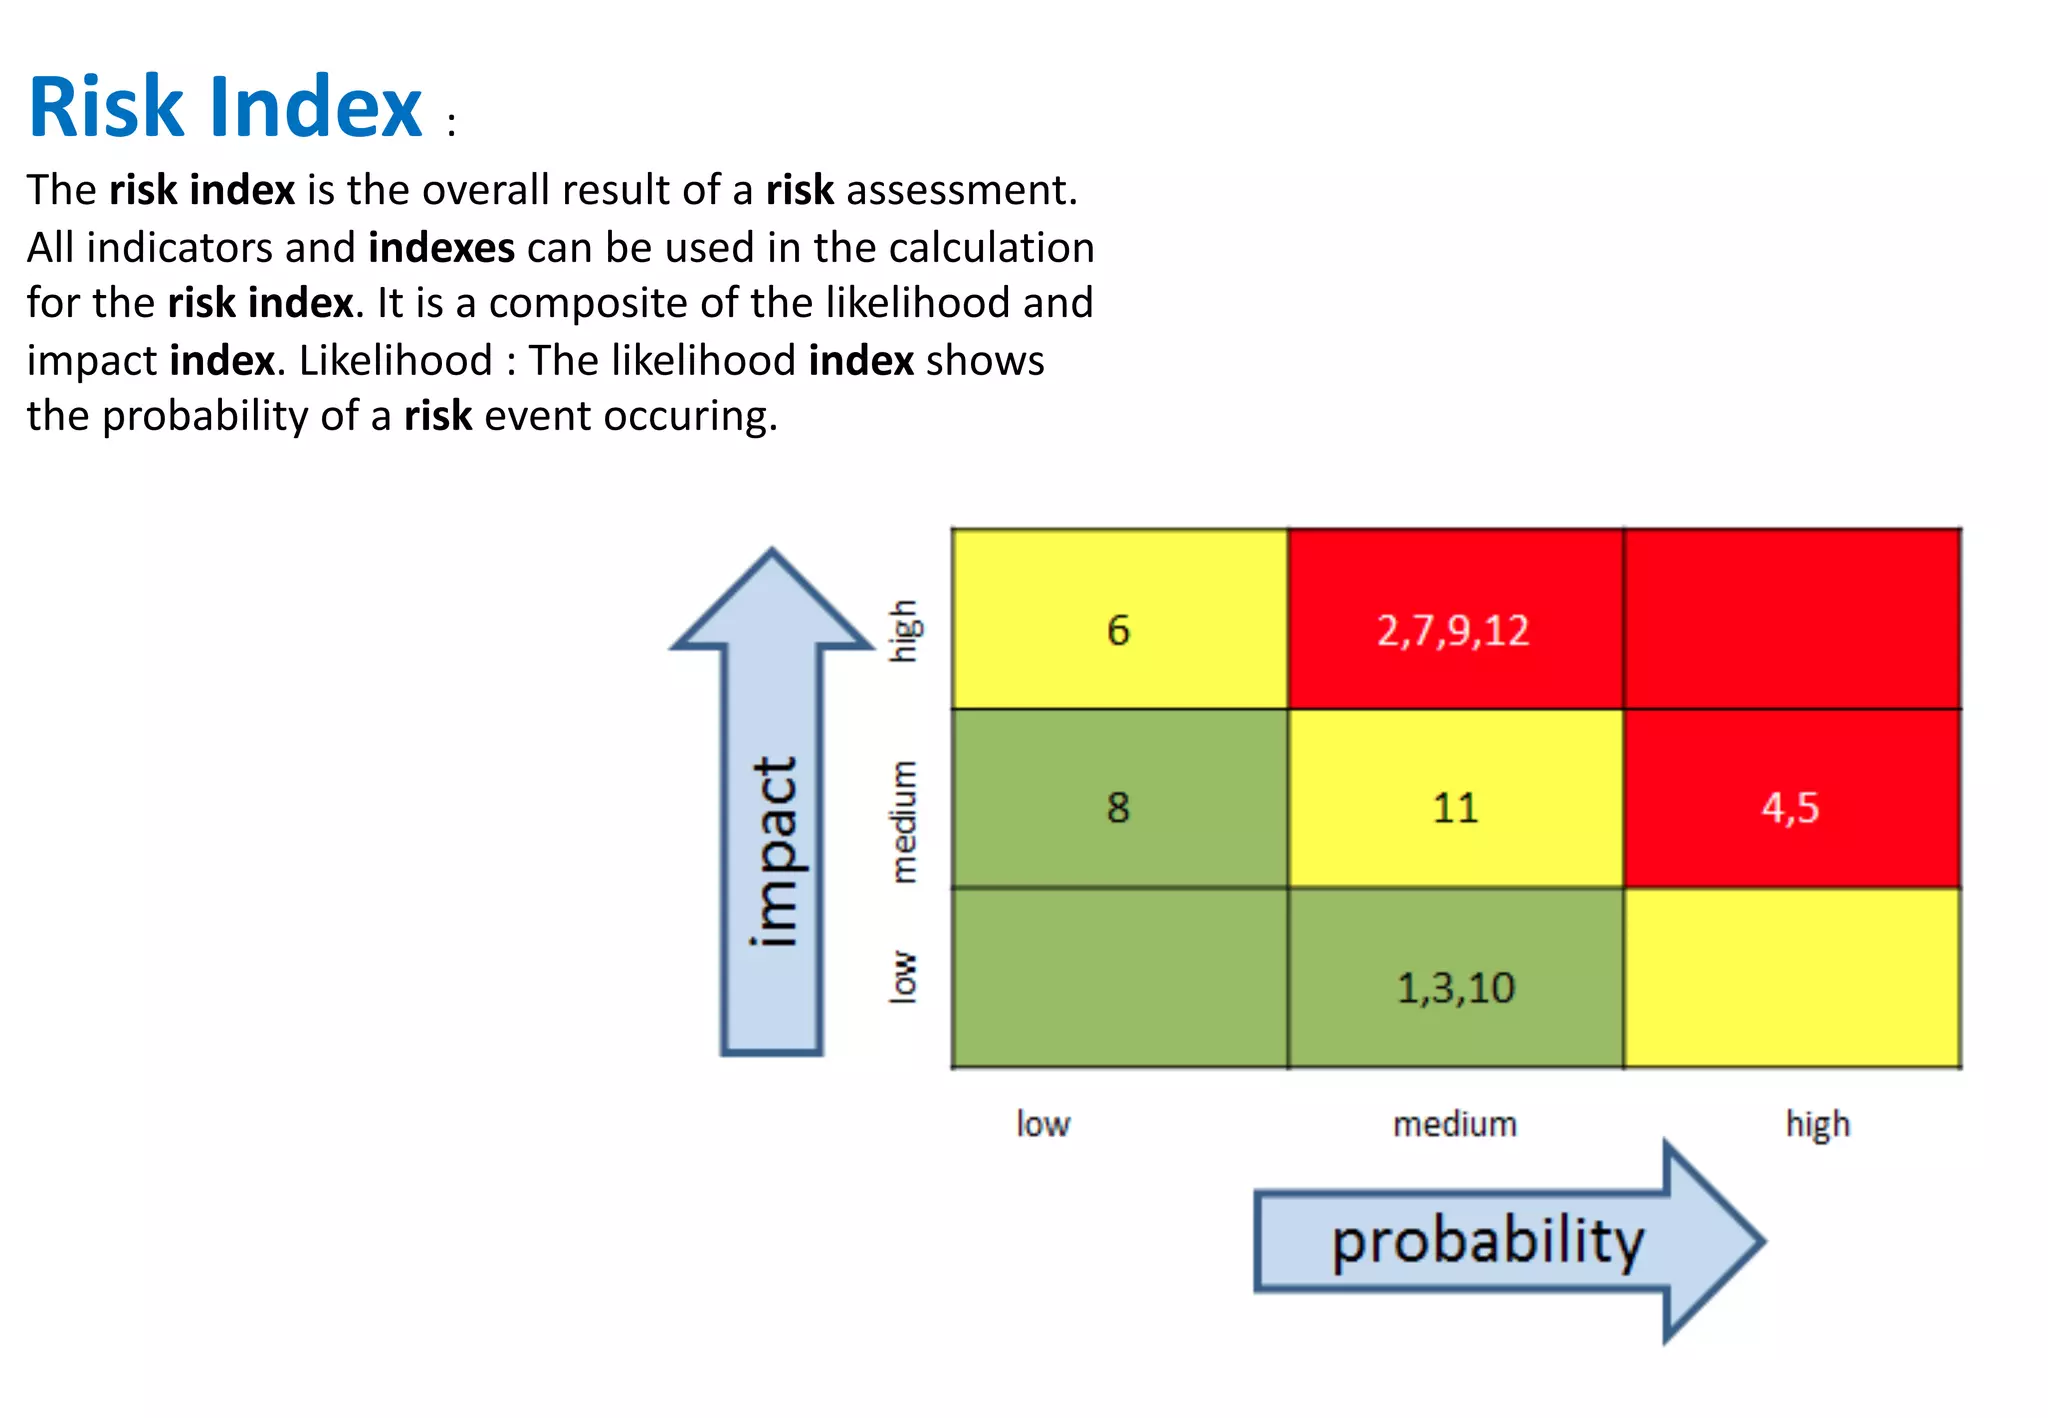
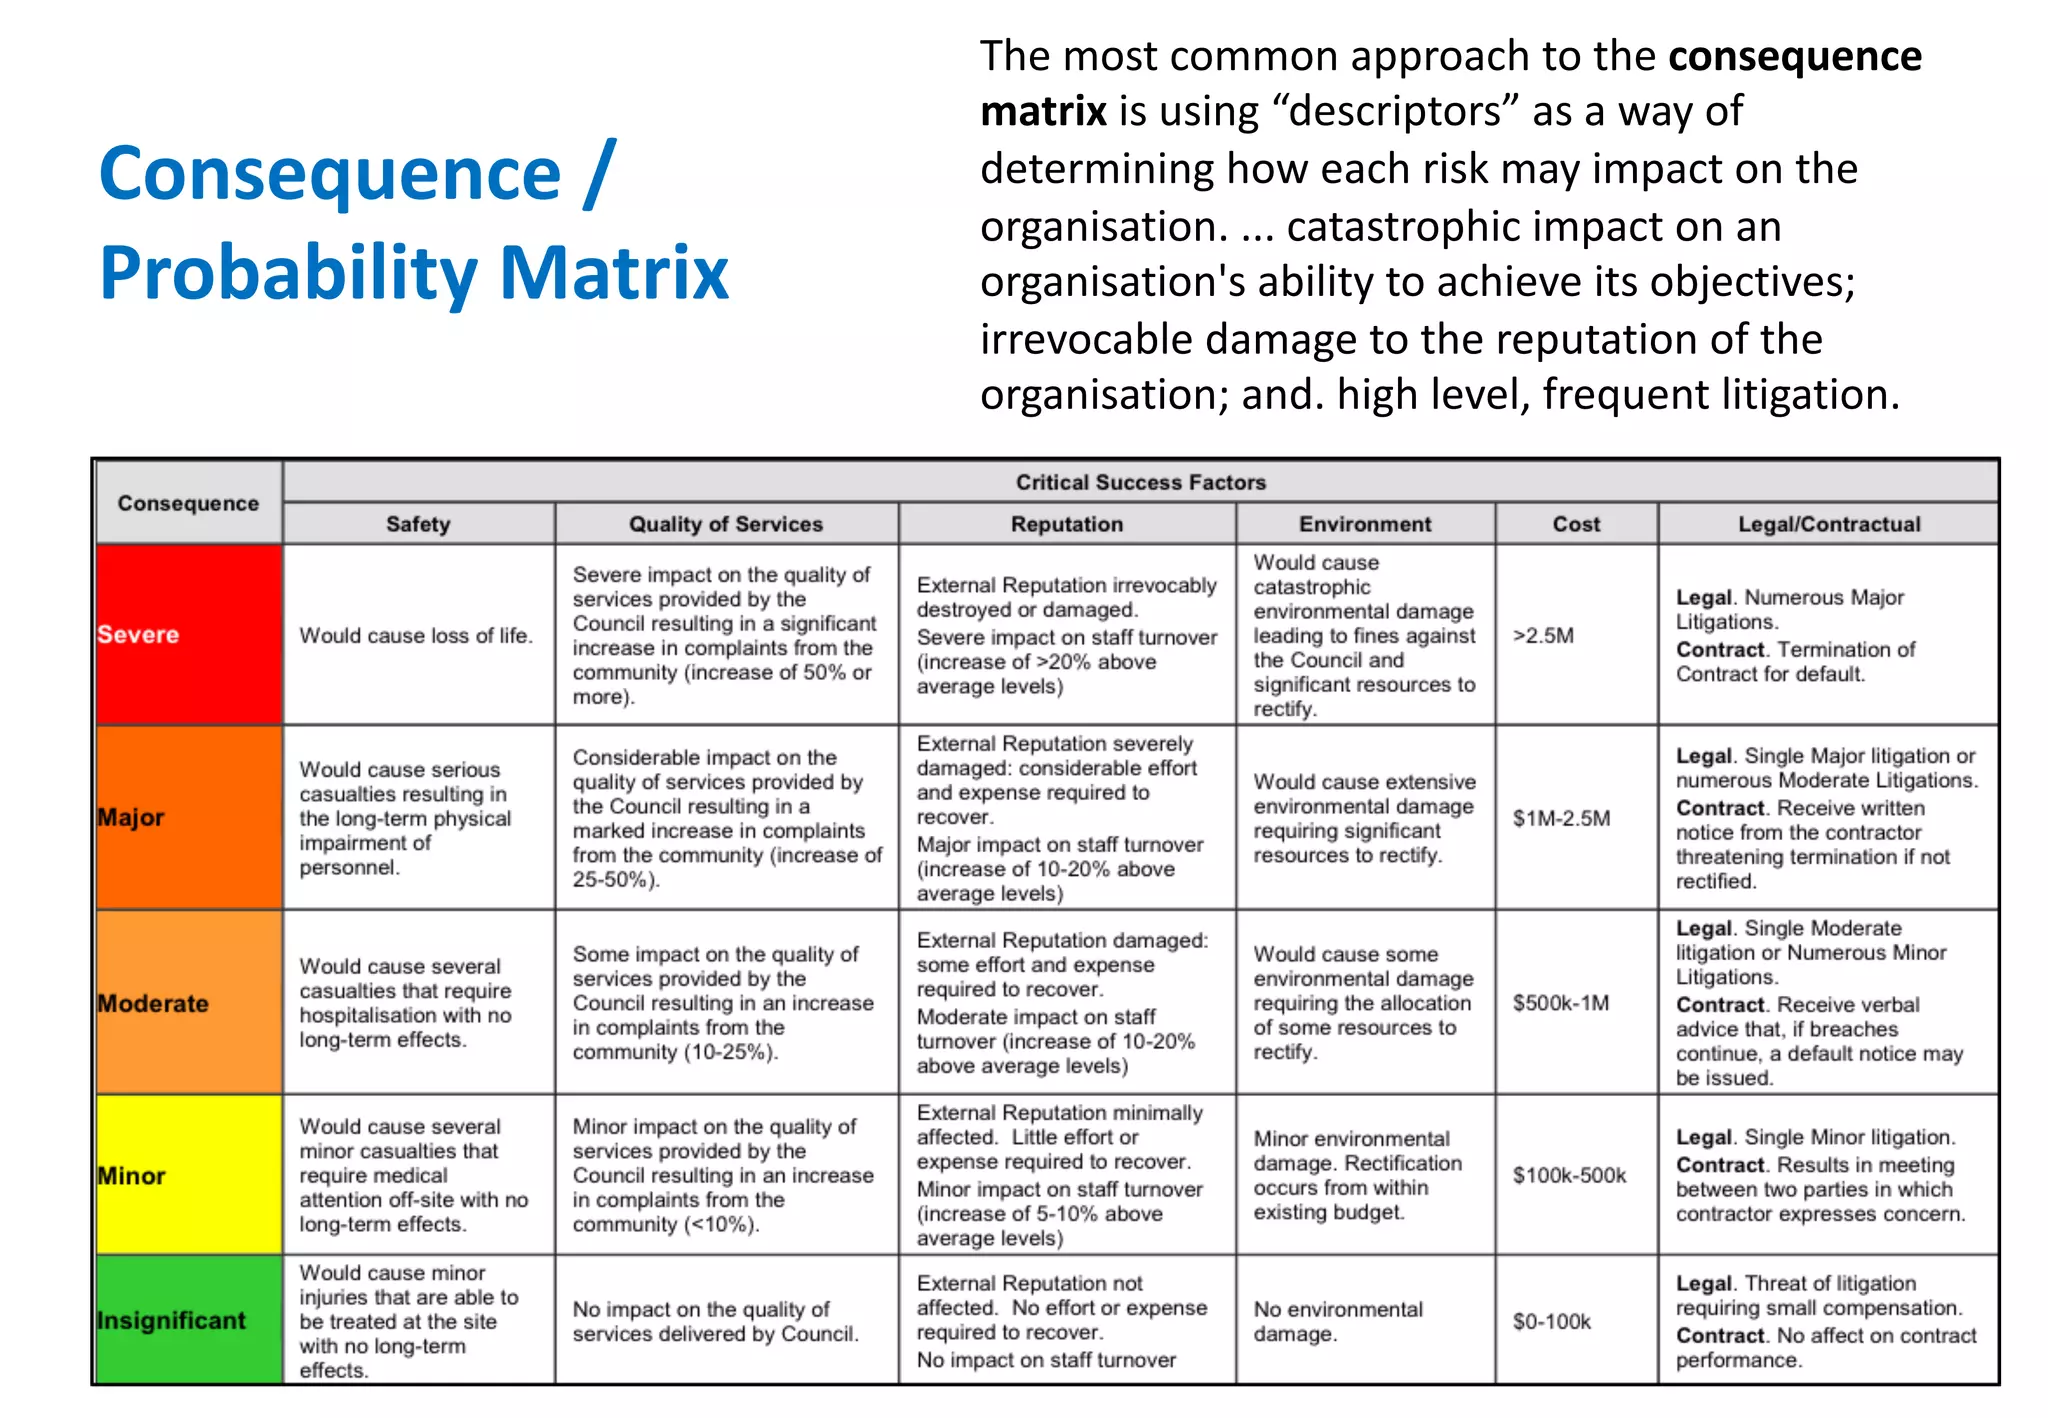
The document outlines various tools and techniques recommended in ISO 31010 for risk assessment and management, including brainstorming, interviews, and the Delphi method. It discusses techniques such as Hazard and Operability Studies (HAZOP), Hazard Analysis and Critical Control Points (HACCP), and various analysis methods like Root Cause Analysis and Multi-Criteria Decision Analysis. Additionally, it covers concepts like risk indexes, Monte Carlo simulations, and cost-benefit analysis, emphasizing their importance in decision-making processes.


![[DSC Europe 25] Milan Zdravkovic - The road less traveled in District Heating...](https://cdn.slidesharecdn.com/ss_thumbnails/nfaboniqwsz4ucyctnmy-2-milan-zdravkovic-dsc2025-the-road-less-traveled-in-district-heating-operation-251208151905-f56388a5-thumbnail.jpg?width=640&height=640&fit=bounds)
![[DSC Europe 25] Vladimir Jelic - The AI-Driven Security Shift From Reactive D...](https://cdn.slidesharecdn.com/ss_thumbnails/6g5gj25mtjwayniqem1t-6-251209104645-7a5a5fc6-thumbnail.jpg?width=640&height=640&fit=bounds)
![[DSC Europe 25] Branko Dzakula - From Defense to Attack: How AI Redefines Cyb...](https://cdn.slidesharecdn.com/ss_thumbnails/80bdzdxpr3ky2g0qvyk9-8-251211083048-ce5fc1ee-thumbnail.jpg?width=640&height=640&fit=bounds)

![[DSC Europe 25] Dobrica Cosic - Savings by the Second: How Dynamic Pricing an...](https://cdn.slidesharecdn.com/ss_thumbnails/znp09f3smtqz3w2sq6wn-1-dobrica-cosic-savings-by-the-second-how-dynamic-pricing-and-smart-data-are-bu-251208151905-26e6f41e-thumbnail.jpg?width=640&height=640&fit=bounds)

![[DSC Europe 25] Jon Dajci - Bridging TradFi and DeFi: Building the Future of ...](https://cdn.slidesharecdn.com/ss_thumbnails/fqmhfvlbqhkihjvqvhmu-7-251211083849-6af7e325-thumbnail.jpg?width=640&height=640&fit=bounds)
![[DSC Europe 25] Hans Kleinsman - The Compliance Gearbox: How Tax Tech Mediate...](https://cdn.slidesharecdn.com/ss_thumbnails/dxdytie1toel0hr90bjs-2-251212103250-174fdbe7-thumbnail.jpg?width=640&height=640&fit=bounds)

![[DSC Europe 25] Milan Sekuloski - Data, Defence, and Development: Cybersecuri...](https://cdn.slidesharecdn.com/ss_thumbnails/dfrkwwx4qly6atqpbl4z-4-251209104645-c3d4b0ca-thumbnail.jpg?width=640&height=640&fit=bounds)


![[DSC Europe 25] Marko Krstic - Understanding the AI Threat Landscape - Risks,...](https://cdn.slidesharecdn.com/ss_thumbnails/tiyim1ins5jvbrvzpzla-2-251209104645-c69d3553-thumbnail.jpg?width=640&height=640&fit=bounds)


![[DSC Europe 25] Sara Polak - The Ancient Operating System: What Archaeology T...](https://cdn.slidesharecdn.com/ss_thumbnails/3vch2p6tttdnwhsgazoz-3-sara-polak-smart-cities-251208152532-64404202-thumbnail.jpg?width=640&height=640&fit=bounds)
![[DSC Europe 25] Marija Vlajkovic & Andrea Radonjanin - Integration of AI tool...](https://cdn.slidesharecdn.com/ss_thumbnails/qf1jrglttoc3bm8s3aop-final-integration-of-ai-tools-251208151905-394f3a6a-thumbnail.jpg?width=640&height=640&fit=bounds)
![[DSC Europe 25] Dusan Nesic - Securing Tomorrow’s Infrastructure: Why Cyber-P...](https://cdn.slidesharecdn.com/ss_thumbnails/qikbszfftyowjm2q6duw-1-251211083848-8f2ead6b-thumbnail.jpg?width=640&height=640&fit=bounds)