Optimal Fertilizer Rates Improve Cassava Nutrient Uptake and Yield
•
0 likes•36 views

Nutrient uptake dynamics and dilution for cassava
Recommended

Recommended
More Related Content
What's hot
What's hot (20)
Similar to Optimal Fertilizer Rates Improve Cassava Nutrient Uptake and Yield
Similar to Optimal Fertilizer Rates Improve Cassava Nutrient Uptake and Yield (20)
More from African Cassava Agronomy Initiative
More from African Cassava Agronomy Initiative (20)
Recently uploaded
Recently uploaded (20)
Optimal Fertilizer Rates Improve Cassava Nutrient Uptake and Yield
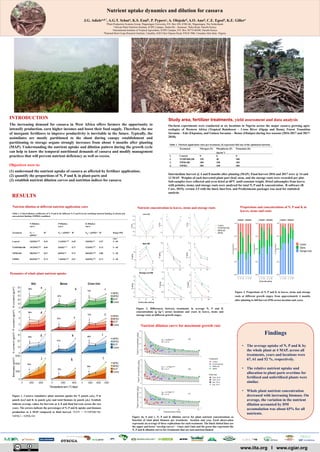
- 1. OYSCGA Study area, fertilizer treatments, yield assessment and data analysis On-farm experiments were conducted at six locations in Nigeria across the major cassava growing agro- ecologies of Western Africa (Tropical Rainforest – Cross River (Ogoja and Ikom), Forest Transition Savanna – Edo (Ekpoma), and Guinea Savanna – Benue (Otukpo) during two seasons (2016-2017 and 2017- 2018). RESULTS www.iita.org I www.cgiar.org Nutrient uptake dynamics and dilution for cassava J.G. Adielea,d,*, A.G.T. Schuta, K.S. Ezuib, P. Pypersc, A. Olojeded, A.O. Anod, C.E. Egesid, K.E. Gillera aPlant Production Systems Group, Wageningen University, P.O. Box 430, 6700 AK, Wageningen, The Netherlands bAfrican Plant Nutrition Institute, ICIPE Campus, Duduville – Kasarani, Thika Road, Nairobi Kenya cInternational Institute of Tropical Agriculture, ICIPE Campus, P.O. Box 30772-00100, Nairobi Kenya dNational Root Crops Research Institute, Umudike, KM 8 Ikot Ekpene Road, P.M.B 7006, Umuahia Abia State, Nigeria Intermediate harvest @ 4 and 8 months after planting (MAP). Final harvest 2016 and 2017 were @ 14 and 12 MAP. Weights of each harvested plant part (leaf, stem, and the storage root) were recorded per plot. Sub-samples were collected and oven dried at 60°C until constant weight. Dried subsamples from leaves with petioles, stems, and storage roots were analysed for total N, P and K concentration. R software (R Core, 2019), version 3.5 with the lme4, lmerTest, and Predictmeans packages was used for statistical analysis. Findings • The average uptake of N, P and K by the whole plant at 4 MAP, across all treatments, years and locations were 67, 61 and 52 %, respectively. • The relative nutrient uptake and allocation to plant parts overtime for fertilized and unfertilized plants were similar. • Whole plant nutrient concentration decreased with increasing biomass. On average, the variation in the nutrient dilution accounted by DM accumulation was about 65% for all nutrients. Table 1. Nutrient application rates per treatment, (f) represents full rate of the optimized nutrient. Treatment Nitrogen (N) Phosphorus (P) Potassium (K) (kg ha-1) 1. Control 0 0 0 2. N150P40K180 150 40 180 3. NfPfK180 300 100 180 4. NfPfKf 300 100 300 Figure 1. Cassava cumulative plant nutrient uptake for N panels a,b,c, P in panels d,e,f and K in panels g,h,i and total biomass in panels j,k,l. Symbols indicate average values for harvests at 4, 8 and final harvests across the two years. The arrows indicate the percentages of N, P and K uptake and biomass production at 4 MAP compared to final harvest. NOTF = N150P40K180, NfPfK2 = NfPfK180 Dynamics of whole plant nutrient uptake Table 2. Critical dilution coefficients of N, P and K for different N, P and K levels, including nutrient limiting (Control) and non-nutrient limiting (NfPfKf) conditions N Dilution curve P Dilution curve K Dilution curve Treatment NC = a(DM)-b R2 NP = a(DM)-b R2 NK = a(DM)-b R2 Range DM t ha-1 Control 32(DM)-0.55 0.53 3.1(DM)-0.48 0.45 19(DM)-0.6 0.57 5 - 60 N150P40K180 107(DM)-0.82 0.84 9(DM)-0.73 0.77 47(DM)-0.67 0.74 5 - 60 NfPfK180 90(DM)-0.67 0.67 8(DM)-0.6 0.72 40(DM)-0.58 0.80 5 - 60 NfPfKf 82(DM)-0.61 0.73 7.4(DM)-0.54 0.57 43(DM)-0.54 0.71 5 - 60 Nutrient dilution at different nutrient application rates INTRODUCTION The increasing demand for cassava in West Africa offers farmers the opportunity to intensify production, earn higher incomes and boost their food supply. Therefore, the use of inorganic fertilizers to improve productivity is inevitable in the future. Typically, the assimilates are mostly partitioned to the shoot during canopy establishment and partitioning to storage organs strongly increases from about 4 months after planting (MAP). Understanding the nutrient uptake and dilution pattern during the growth cycle can help to know the temporal nutritional demands of cassava and modify management practices that will prevent nutrient deficiency as well as excess. Objectives were to: (1) understand the nutrient uptake of cassava as affected by fertilizer application; (2) quantify the proportions of N, P and K in plant-parts and (3) establish nutrient dilution curves and nutrition indices for cassava. Nutrient dilution curve for maximum growth rate Proportions and concentrations of N, P and K in leaves, stems and roots Figure 3. Proportions of N, P and K in leaves, stems and storage roots at different growth stages, from approximately 4 months after planting to full harvest (FH) across location and years. Figure 4a, b and c. N, P and K dilution curves for plant nutrient concentrations as function of total plant biomass per treatment, location and year. Each observation represents an average of three replications for each treatment. The black dotted lines are the upper and lower ‘envelop curves’ – Cmax and Cmin and the green line represents the N, P and K dilution curves for treatments that are non-nutrient limited. Figure 2. Differences between treatments in average N, P and K concentrations (g kg-1) across locations and years in leaves, stems and storage roots at different growth stages. Nutrient concentration in leaves, stems and storage roots