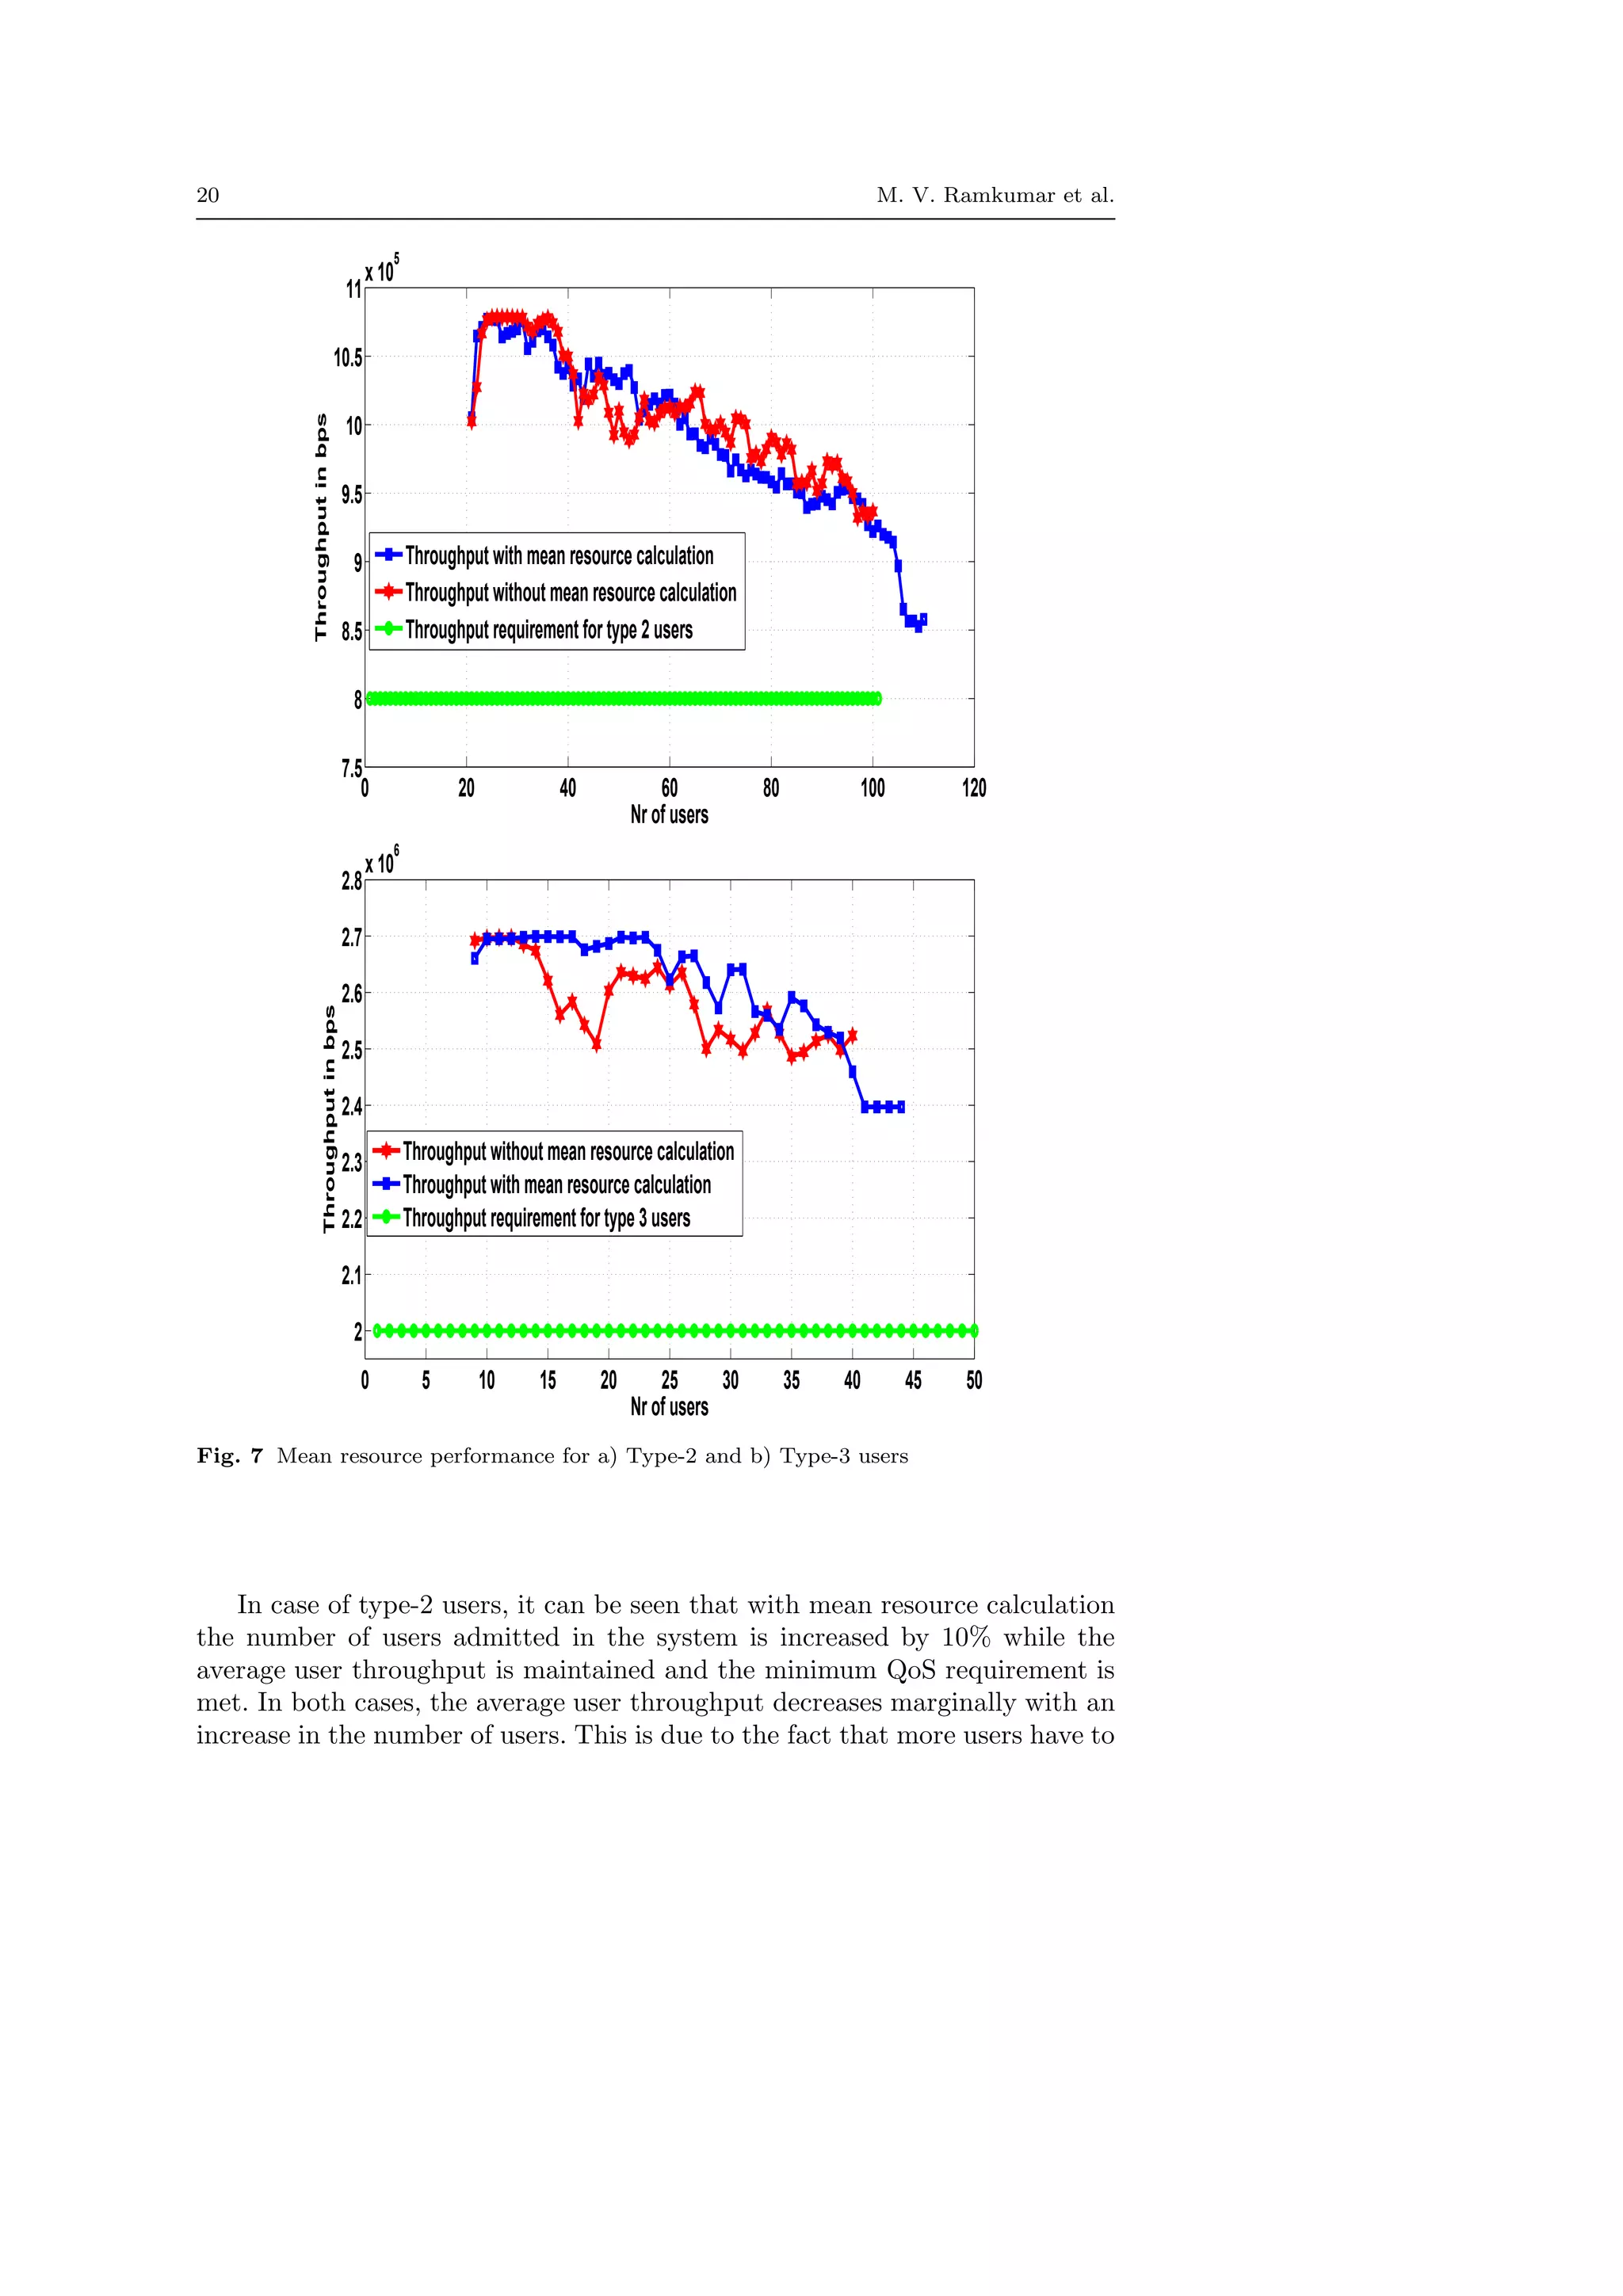
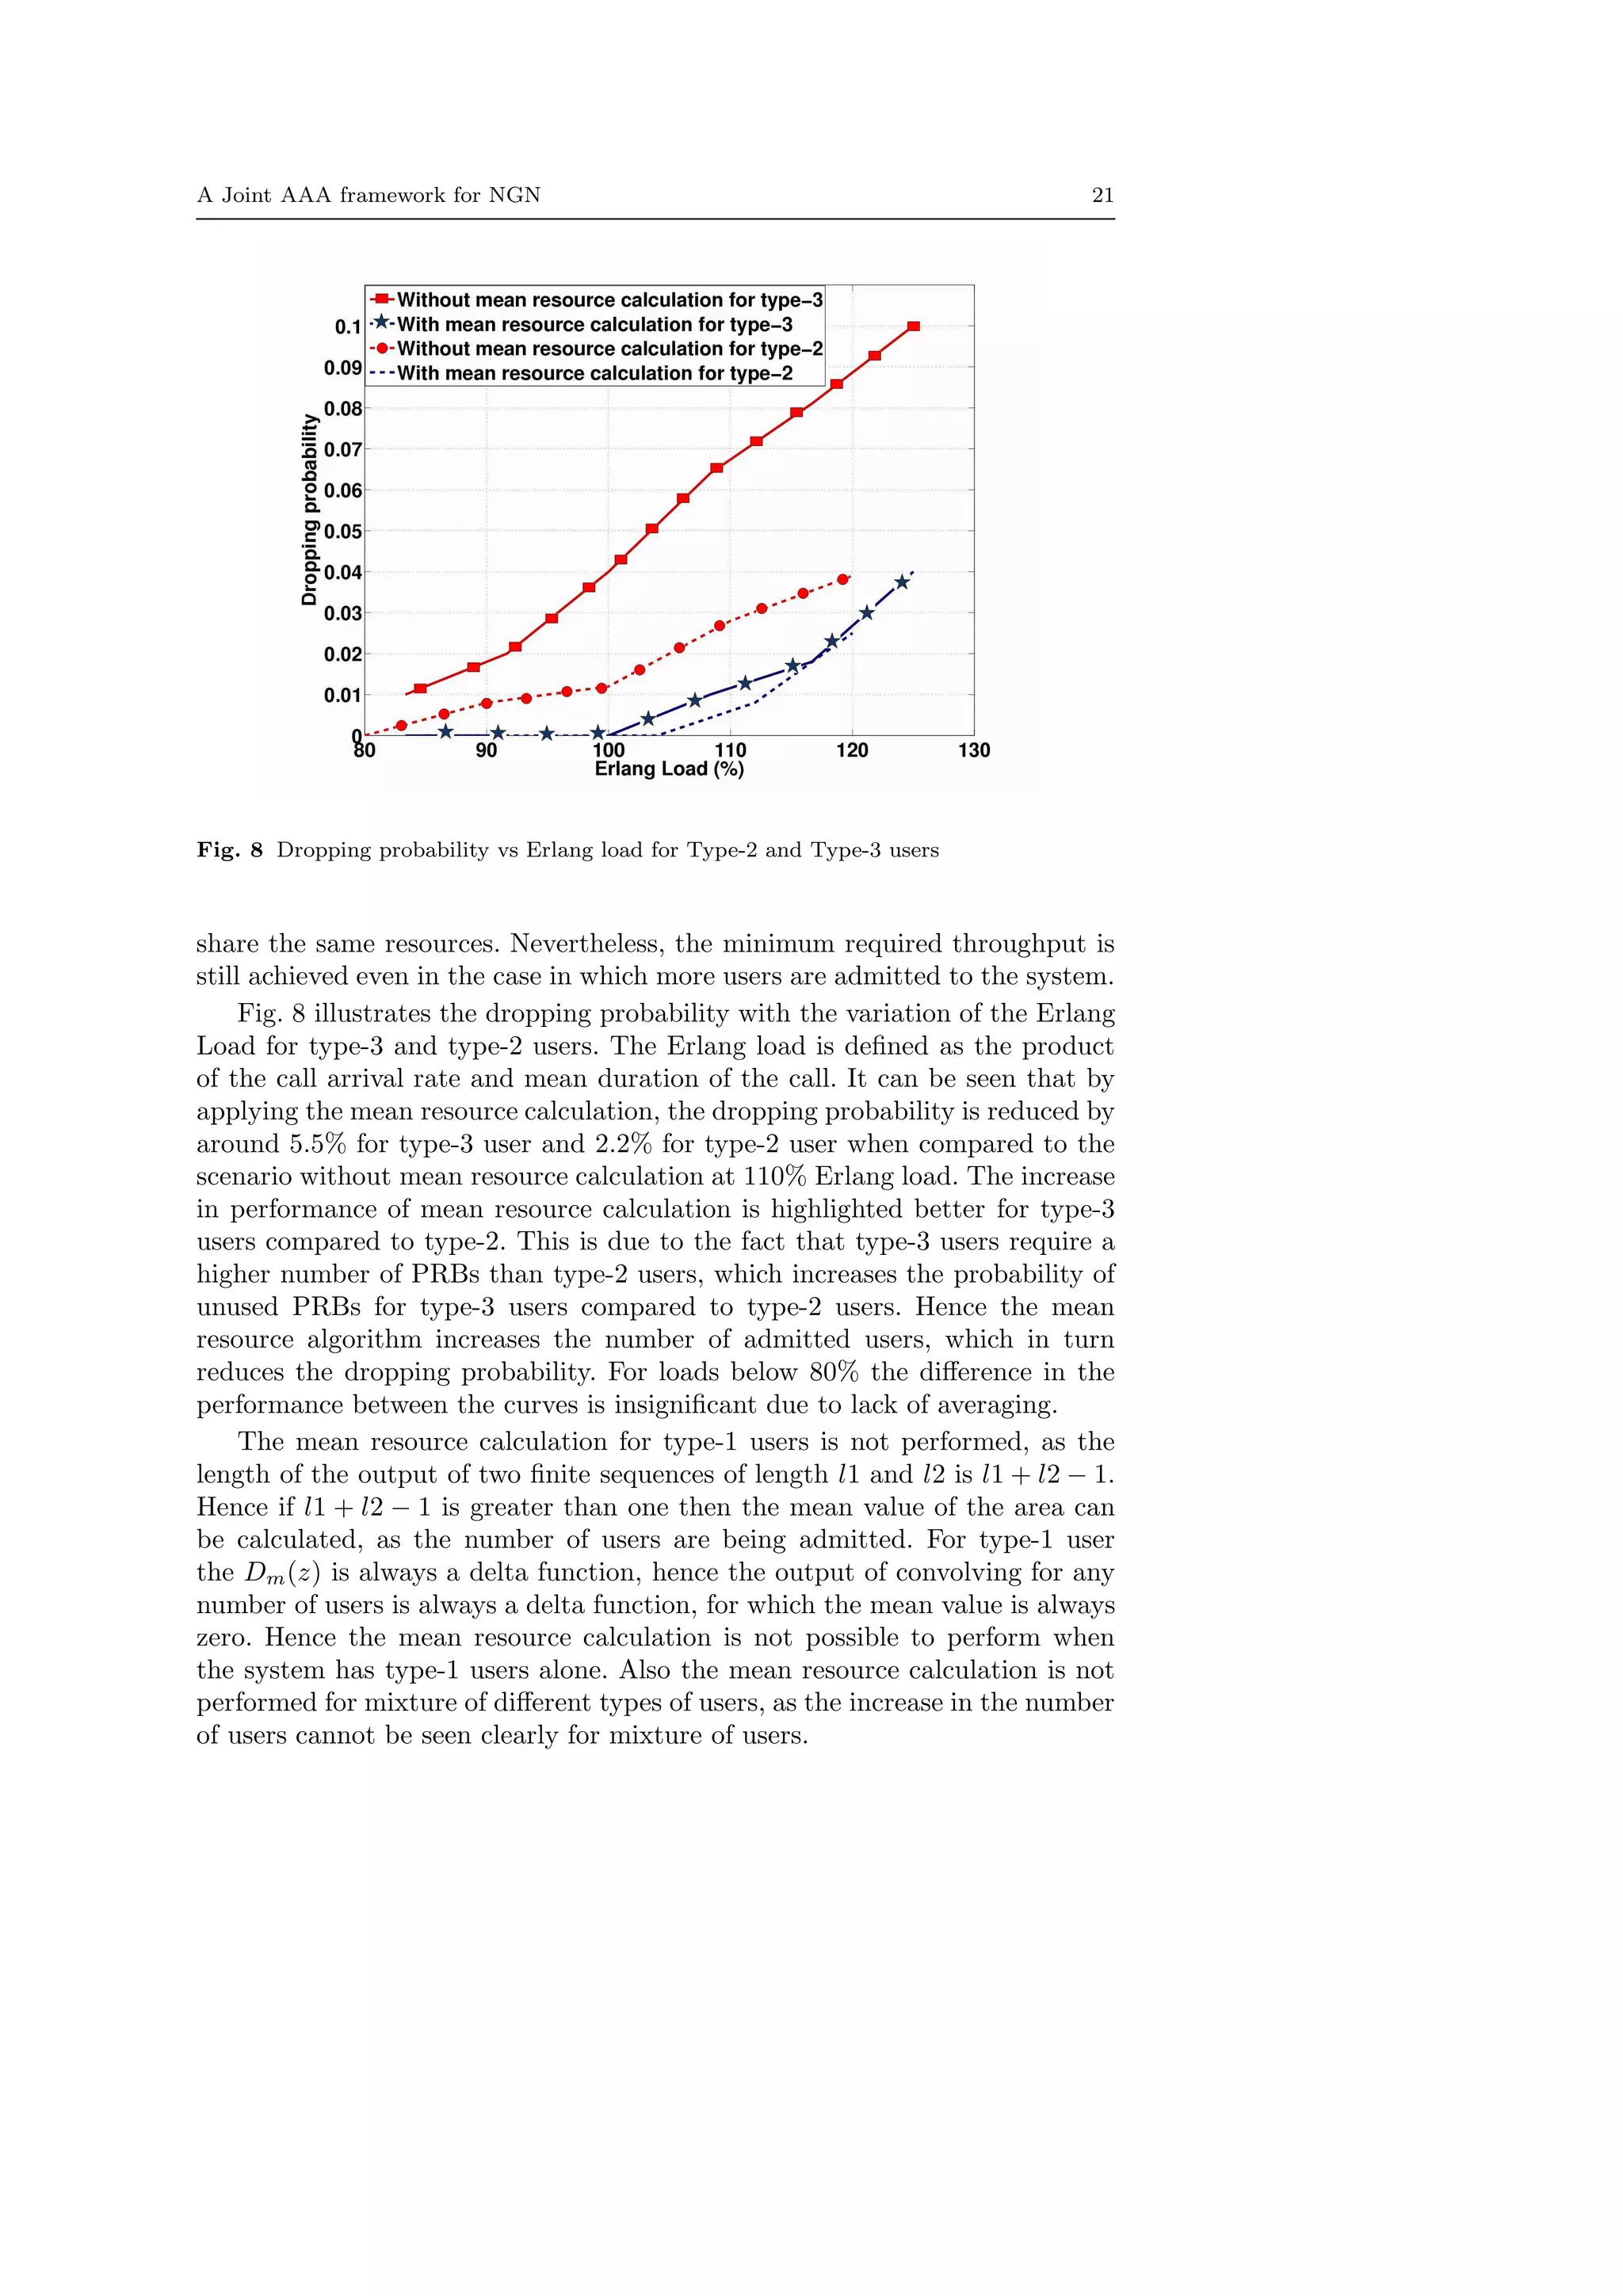
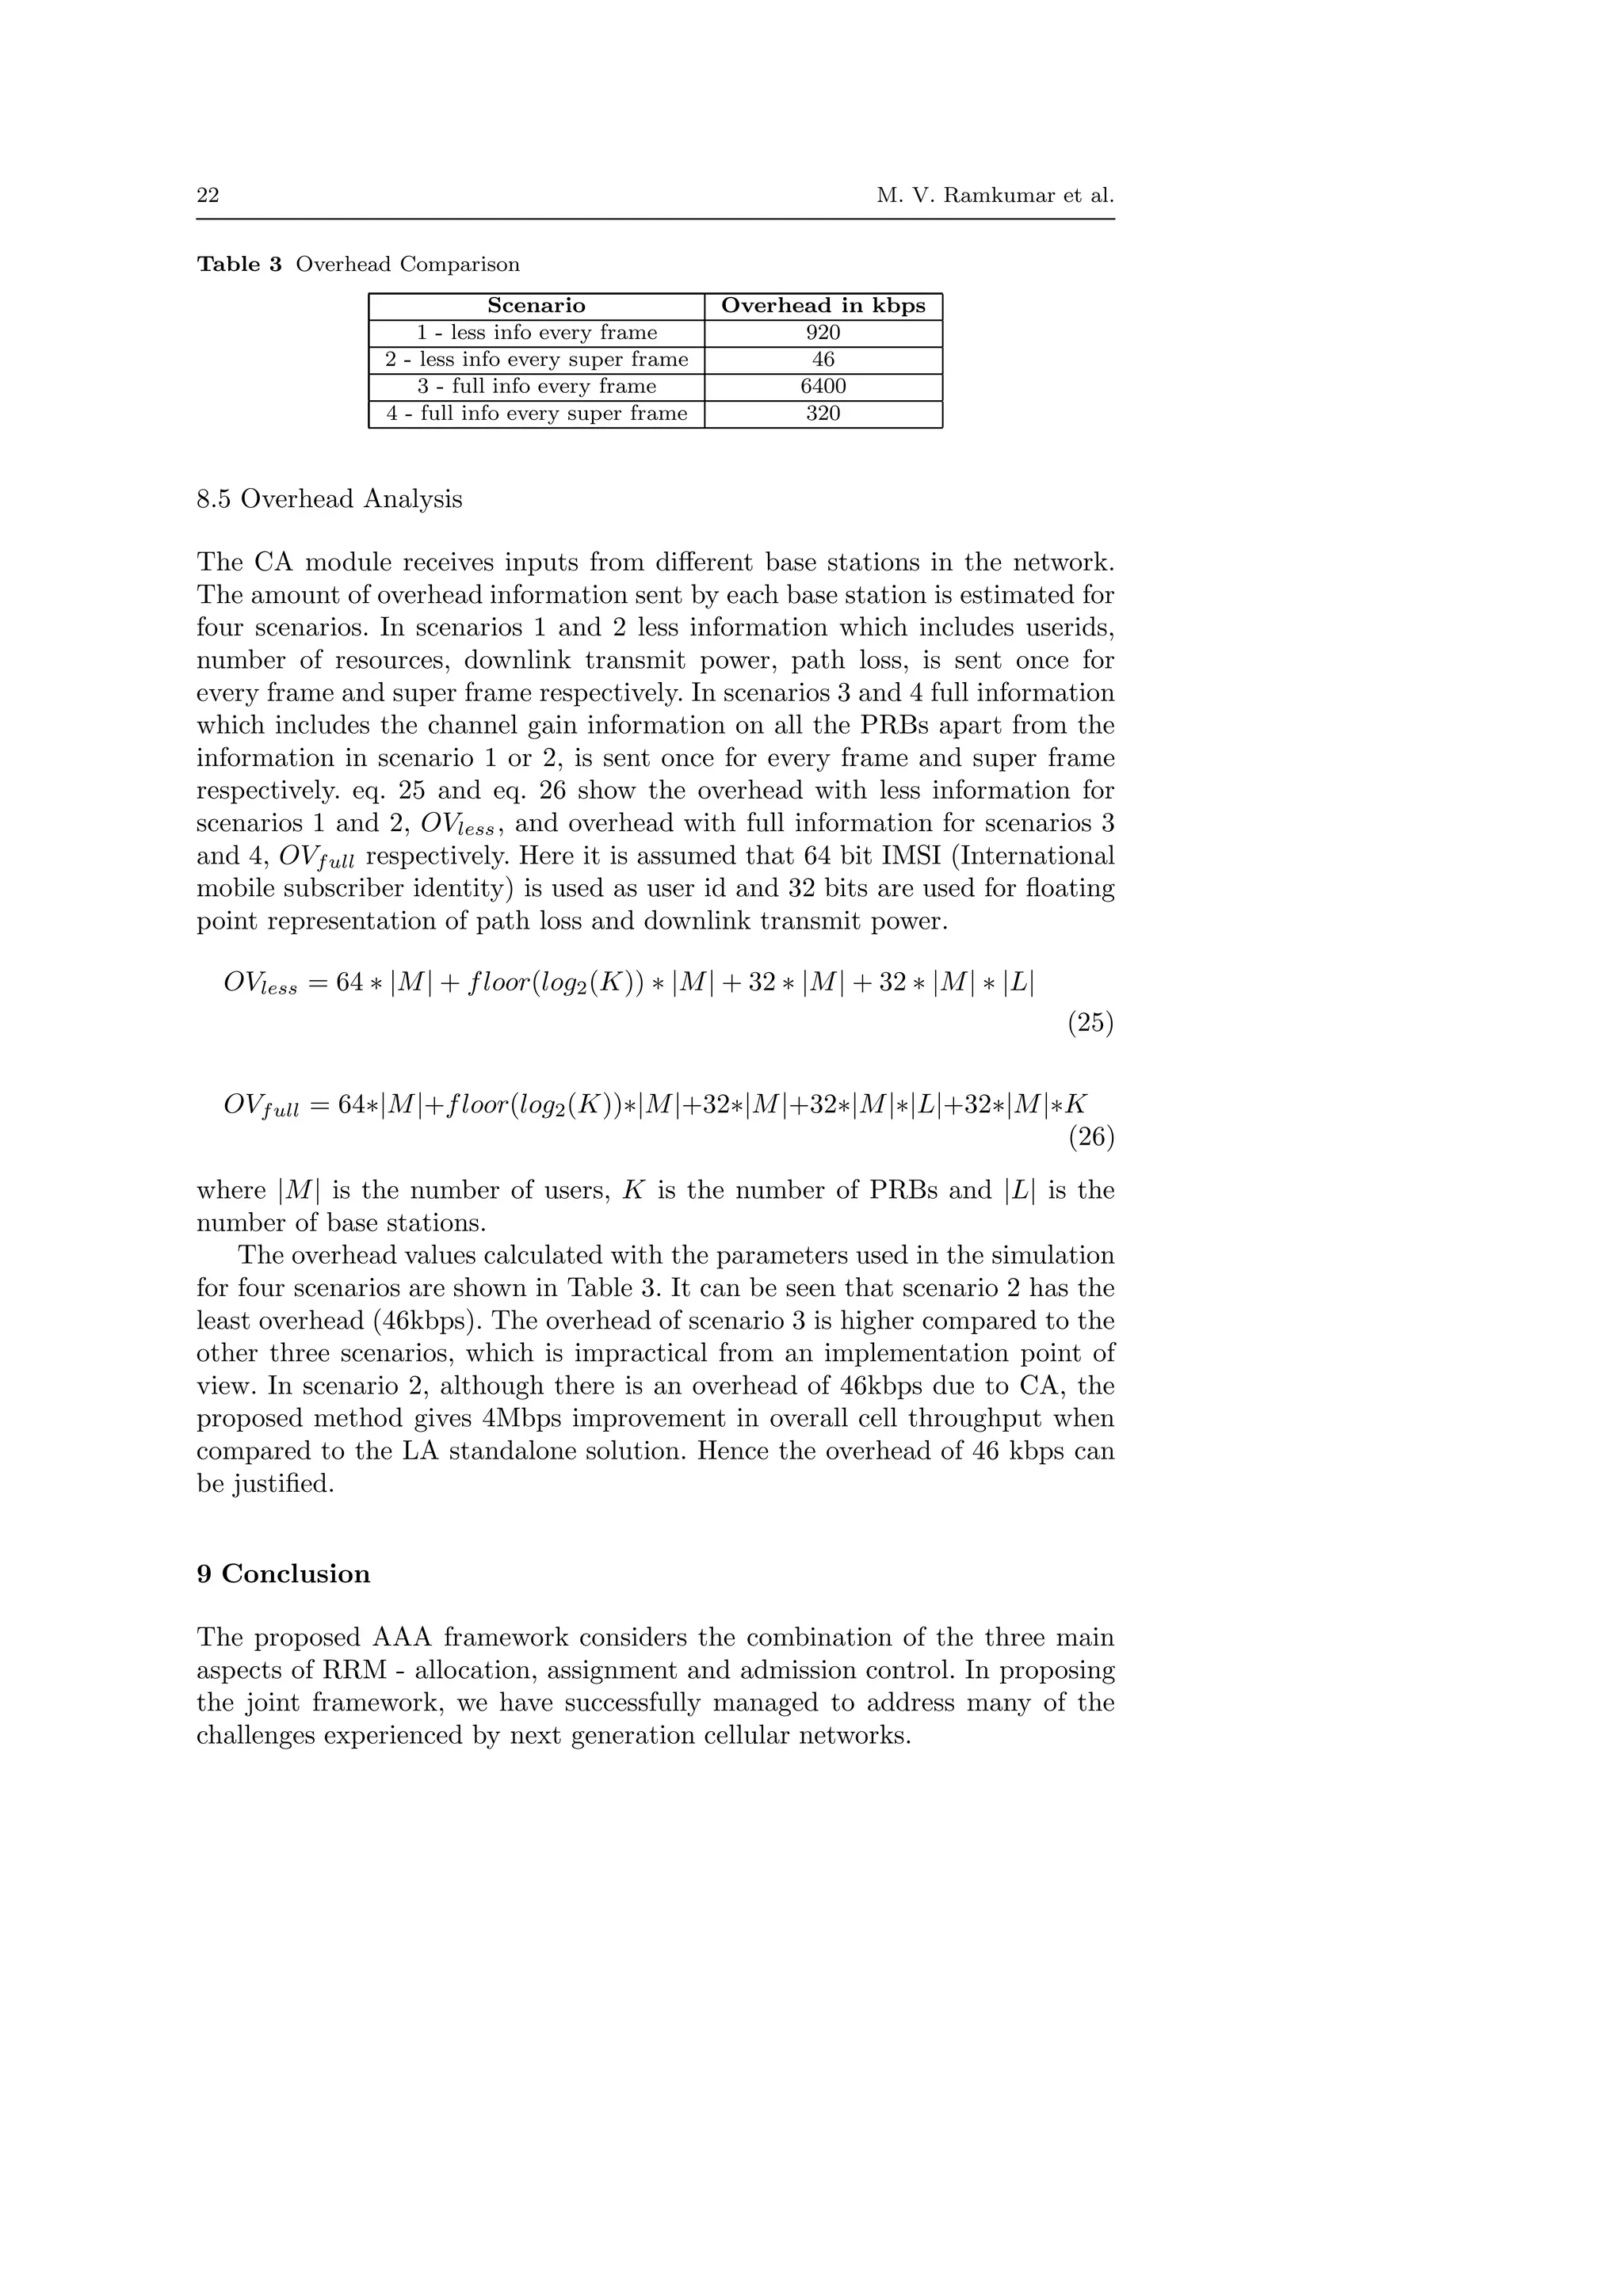
The document proposes a joint Allocation, Assignment, and Admission Control (AAA) framework for next generation cellular networks. It introduces a novel semi-distributed resource allocation method using both central and local allocation. It also presents a Markov-based assignment approach that calculates packet dropping probabilities considering queuing and adaptive modulation/coding. The admission control is based on calculating mean resource usage of existing users and buffer conditions. The AAA framework aims to improve overall network throughput, cell-edge throughput, and number of admitted users while guaranteeing quality of service.
![2 M. V. Ramkumar et al.
cell-edge throughput have been improved and the number of admitted users
have been increased while still guaranteeing QoS for new users as well as ex-
isting users.
Keywords Radio Resource Management · Admission Control · Next
Generation Cellular Networks · LTE
1 Introduction
Next generation cellular networks are facing severe challenges due to the ex-
ponential increase in the number of mobile terminals and the variety of ap-
plications [1]. One of the most challenging tasks in such networks is to meet
the quality of service (QoS) requirements of the users while improving the ef-
ficiency of the overall network. This has to be achieved in the highly dynamic
environments characterizing wireless networks which include rapidly changing
fading, user mobility, traffic conditions, network conditions, etc. Future wire-
less networks must be able to provide services to a vast number of mobile users
in different scenarios including both indoor and outdoor. In order to do so, cell
sizes must be decreased which in turn results in an increase in the number of
base stations needed to service a certain area [16]. At the same time, spectrum
scarcity requires the reuse of resources among multiple cells and base stations
in both the up and downlink. This potential overlap of resource usage causes
inter-cell interference (ICI) between cells, which decreases the QoS and also
the cell throughput [3]. This problem is especially significant for cell-edge users
which require high transmit power from the serving cell and thus potentially
creating high interference on the neighboring cells utilizing the same resources.
In order to address the aforementioned challenges, there is a strong need for
efficient radio resource management (RRM).
RRM includes, among other tasks, the allocation of the right resources to
the individual cells in the network and in turn to the individual users served in
each cell [4] [5]. The allocation of resources should be done in such a way that
the overall throughput of the network is maximized while still maintaining
the QoS of the users. If the resources are allocated orthogonally without any
overlap between cells, the ICI will be zero, but the overall throughput is not
maximized due to lack of resources. On the other hand, a 1:1 reuse results
in a high ICI which decreases the throughput. Therefore, a tradeoff on the
percentage of overlap should be obtained. As mentioned, users near the cell
edge are sensitive to interference as they are close to the neighboring cell and
experience weak signal strength due to path loss. Cell-center users, however,
are not as sensitive to interference and the allocation of resources to each cell
should take these effects into consideration.
If the allocation is done in a decentralized and distributed manner, then
each cell does not have sufficient knowledge regarding the neighboring cells
and the allocation performed may not be optimal [6] [7]. The advantage of a
centralized allocation is that it has knowledge of the overall network including](https://image.slidesharecdn.com/aaa-journal-130911025627-phpapp02/75/AAA-Allocation-Admission-and-Assignment-Control-for-Network-management-2-2048.jpg)
![A Joint AAA framework for NGN 3
the load and user distribution in each cell [5]. However, the centralized alloca-
tion has disadvantages in terms of signaling overhead [7]. A hybrid approach
could therefore provide an optimized solution and a tradeoff between the sig-
naling overhead and the optimal allocation [5]. The amount of resources to be
allocated to each cell and its users depends on the load of the cell and should
be determined prior to the actual allocation. The resources are a function of
the QoS requirements, fading conditions, etc. of the users in the cell. With
respect to maintaining the QoS of users, another important challenge is the
admission and allocation of resources to new users. New or handoff users can
decrease the QoS for existing users by creating congestion in the network [1]
and the admission should therefore be carefully considered.
The rest of the paper is organized as follows. Section 2 discusses the related
work and Section 3 explains the AAA framework and the interfaces between
the individual modules. Sections 4, 5, 6 explain the allocation, assignment and
admission control modules of the AAA framework. Section 7 is concerned with
the priority based scheduler (PBS) and Section 8 presents the simulation setup
and the results obtained, while Section 9 concludes the paper.
2 Related Work
The allocation of resources can be done in a static way using fixed reuse meth-
ods or in a dynamic way by considering the network conditions. Dynamic
channel allocation methods are less efficient than fixed allocation methods un-
der high load conditions but provide more flexibility and traffic adaptability
[7]. In fixed frequency reuse (FFR), physical resource blocks (PRBs) are allo-
cated without overlap and hence the ICI is significantly lower, but at the cost
of reduced spectral efficiency. In [8] [9] [10], users in a cell are classified into
different classes based on their geometrical position and different bandwidth
allocation patterns are assigned for different user classes. The most promising
approach divides the users into two groups: interior cell-center users and exte-
rior cell-edge users. One third of the available bandwidth in each cell is fixed
for cell-edge users and the rest for cell-center users [8] [9]. This approach is
called soft frequency reuse (SFR). However, when the traffic load changes, it
is desirable for the allocation of sub bands to cell-edge users not to be done
statically, but rather dynamically in order to take advantage of varying traffic
load in the network. This is not addressed in [8] and [10]. In [9], an adaptive
SFR scheme dynamically adapts to changing traffic load and user distributions
among neighbor cells. In [6], two methods for flexible spectrum usage (FSU)
are proposed; spectrum load balancing (SLB) and resource chunk selection
(RCS). In [11], partial frequency reuse (PFR) based on network load is pro-
posed. In [5], a hybrid method for dynamic resource allocation is proposed. In
all the above mentioned methods, the allocation in the current frame is done
based on the signal to interference plus noise ratio (SINR) measurements of
the previous frame. This approach does not guarantee the optimal allocation
of resources for the current frame.](https://image.slidesharecdn.com/aaa-journal-130911025627-phpapp02/75/AAA-Allocation-Admission-and-Assignment-Control-for-Network-management-3-2048.jpg)
![4 M. V. Ramkumar et al.
Whether the assignment or the admission modules are being discussed,
the QoS requirements for a new user should be guaranteed without violating
the QoS of existing users. The QoS achieved by a user depends on a series
of factors, out of which the most notable are the channel conditions of the
user. The channel conditions cause packet errors and buffer overflow and thus
packet drops or increased delay in packet delivery [1]. Both channel and buffer
conditions affect the throughput and delay of a user and traditional queuing
models do not consider their effects. At the same time, channel models do
not consider the effects of the status of the queue [12]. As an example, if the
channel is in deep fade, adaptive modulation and coding (AMC) will select
a lower modulation order, which will reduce the outflow of packets from the
buffer and thus the throughput of the user will be reduced. On the other hand,
as the number of packets going out of the buffer reduces, the dropping rate
of the packets increases which, in turn, will increase the delay. The previous
example was meant to show how the QoS experienced by the users is dependent
on the channel and the queue characteristics.
The novelty of this work is the proposal of a joint AAA framework and
the system model explaining the interfaces between the modules. For central
allocation, a heuristic method of allocation is proposed, which works with the
local allocation module in a semi-distributed way. A novel admission control
scheme based on mean resource method is proposed by taking into account the
buffer conditions of the users. The AAA framework and the proposed methods
are validated on a long term evolution (LTE) platform.
3 AAA FRAMEWORK
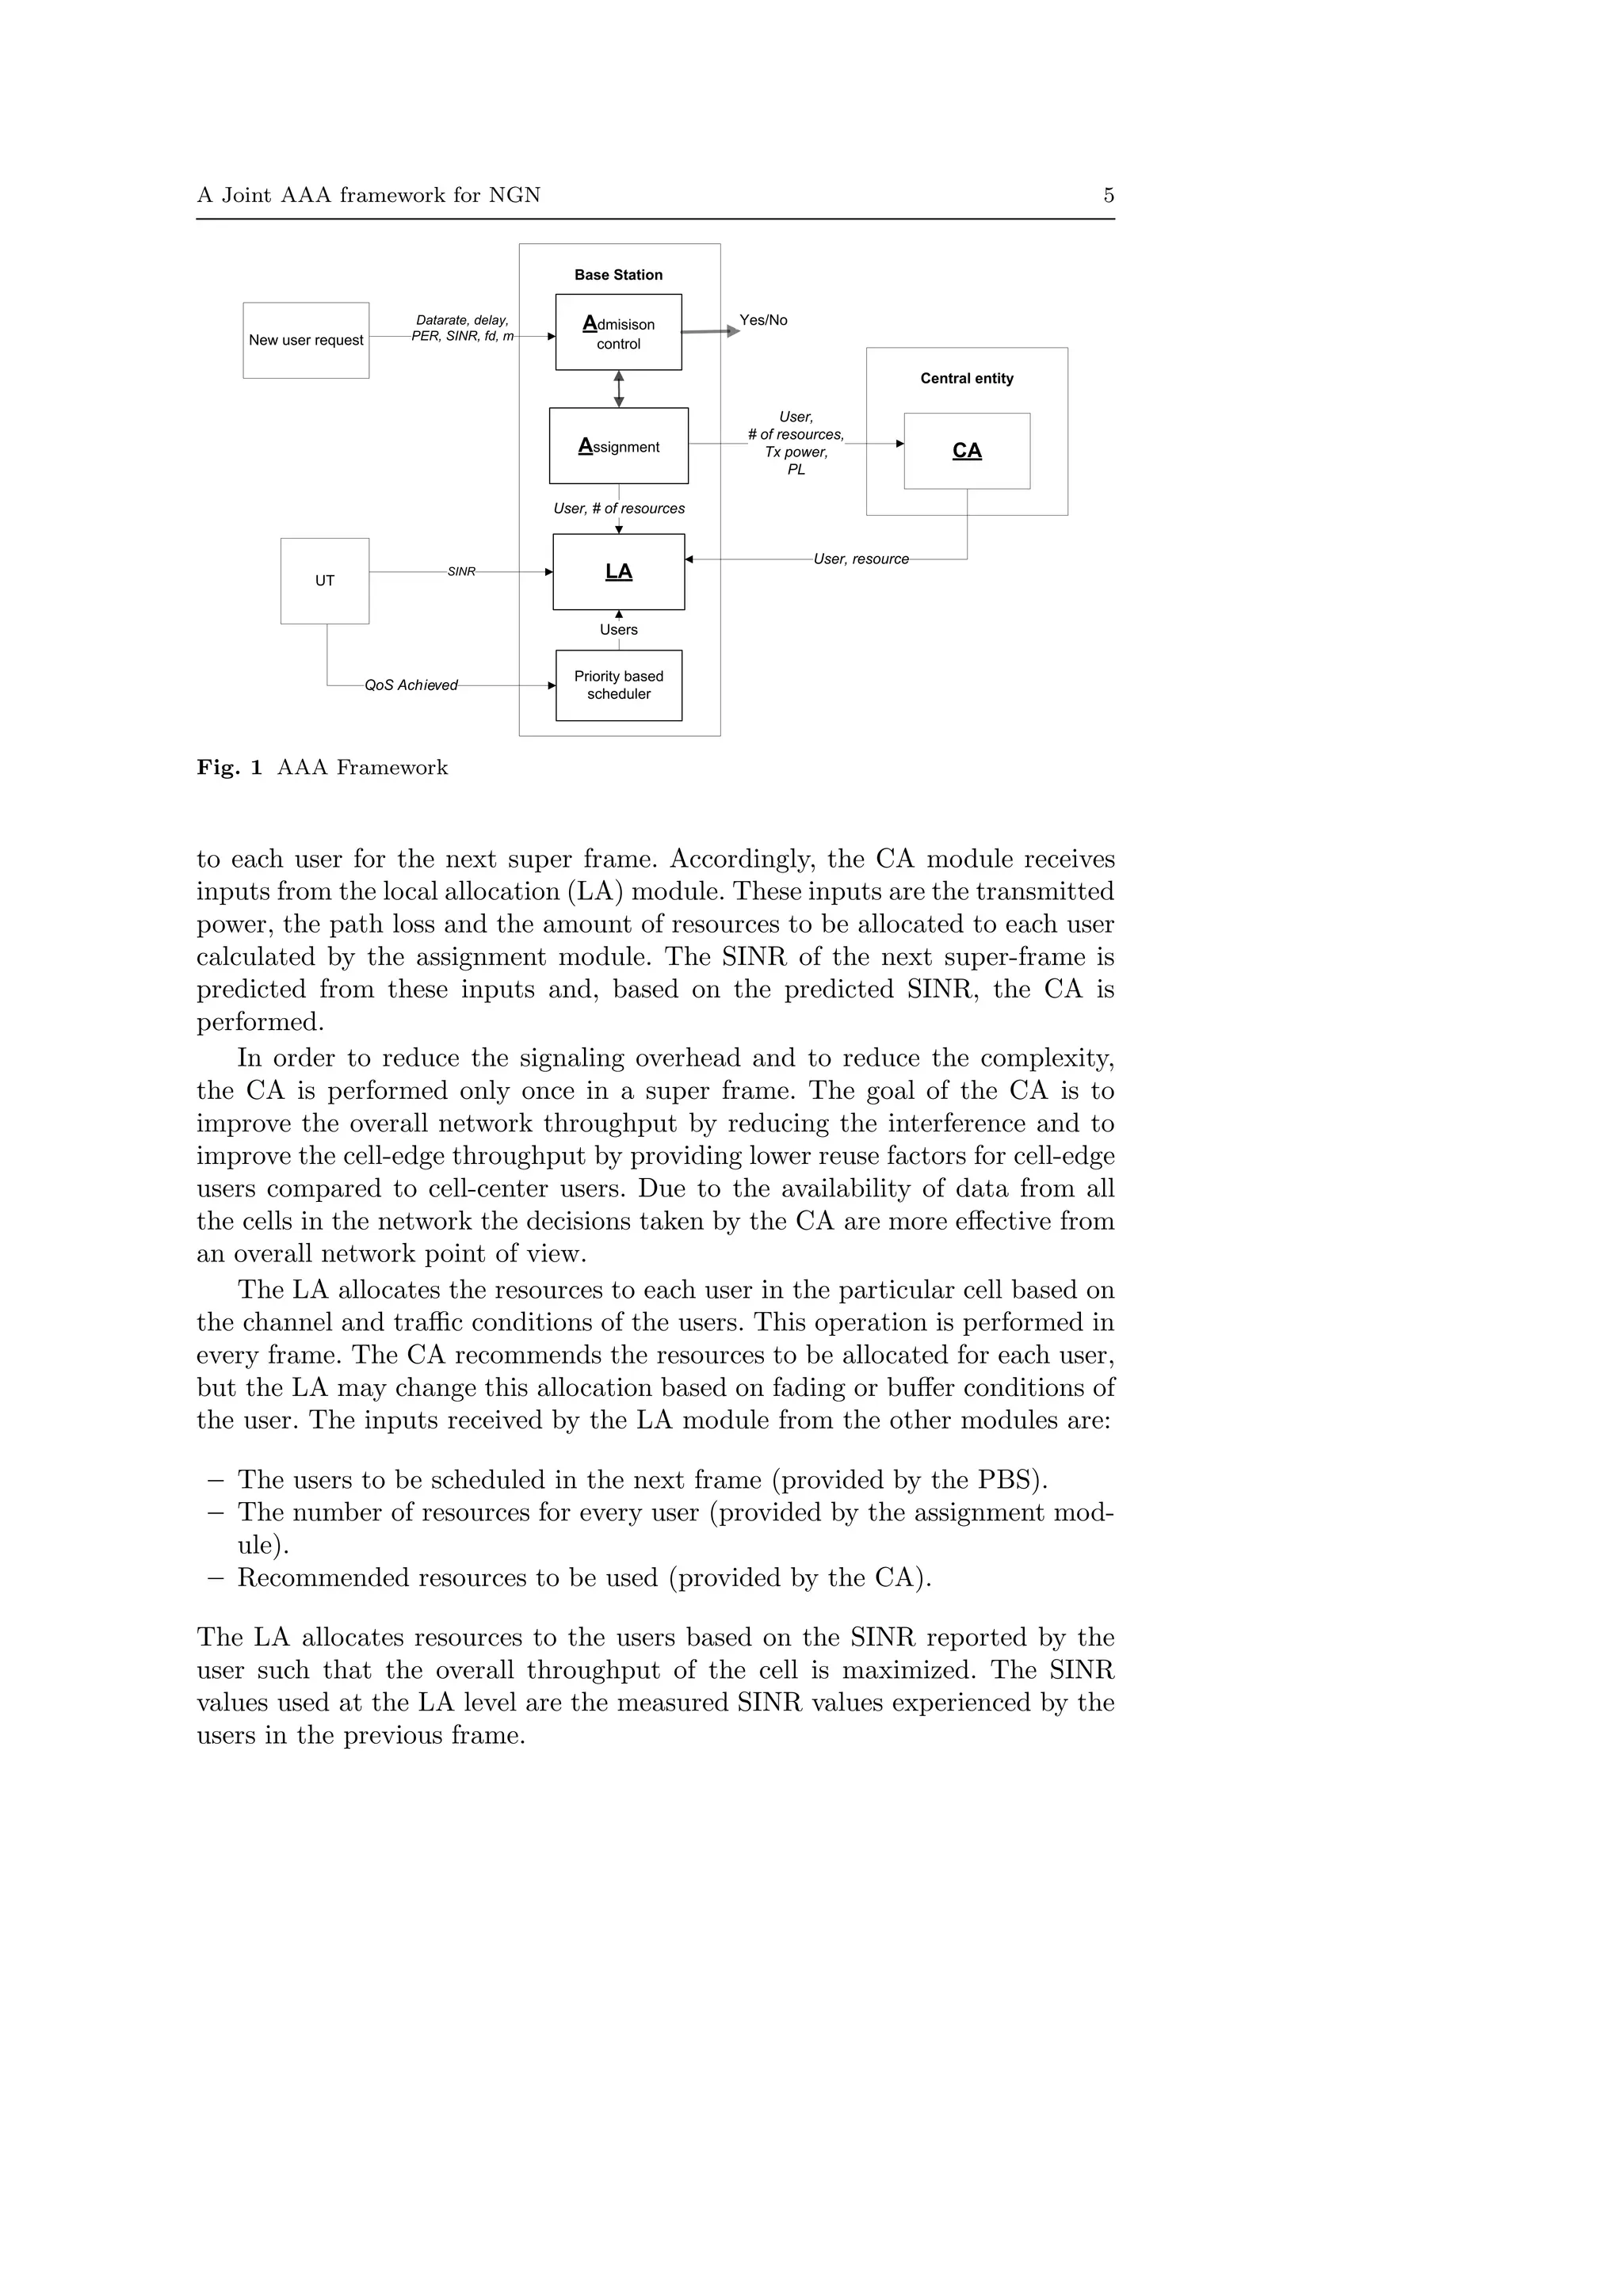
In this paper, a new framework for allocation, assignment and admission con-
trol (AAA) is proposed as shown in Fig. 1. The main objectives of the proposed
framework are:
– Dynamic and autonomous allocation of resources to each base station and
to each user in the downlink by considering ICI, SINR, load of the network,
location and downlink transmit power etc. such that the overall network
throughput is maximized.
– Assignment of resources to each user, which includes estimating the number
of resources based on QoS requirements of the user, type of user, target
SINR, fading conditions, etc. such that the QoS requirements of the user
are met.
– Admission of a new or handoff user such that the network does not experi-
ence congestion, QoS of existing users is not violated and QoS of the new
user is achieved.
The allocation of resources in the network is done at two time scales, super-
frame and frame. The central allocation (CA) is done for every super-frame by
predicting the SINR of the next super-frame from path loss and shadowing.
Based on the predicted SINR, the CA allocates resources to each cell and](https://image.slidesharecdn.com/aaa-journal-130911025627-phpapp02/75/AAA-Allocation-Admission-and-Assignment-Control-for-Network-management-4-2048.jpg)
![6 M. V. Ramkumar et al.
The next module in the AAA framework is the assignment module which
is based on a two-dimensional Markov modeling of the queue. This model-
ing takes into account the effects of AMC in the physical layer. Given that a
new user is requesting admission to the network or that a handover has been
initiated, the assignment module is triggered by the admission control (AC)
module. The AC forwards the request on behalf of the user with the QoS re-
quirements and channel conditions to the assignment module. The assignment
module then estimates the number of resources required by the user such that
its QoS requirements are met and it keeps providing this information to the
CA module once every super frame and to the LA module every frame.
The next module of the AAA is the admission control module, which deals
with admission/rejection of a new or handoff user. For each new request, the
assignment module calculates the number of resources required by the user and
forwards it to the admission control module. The admission control module
estimates the mean number of resources used by existing users by taking ad-
vantage of multi user diversity based on buffer conditions. Based on the mean
number of resources used by existing users and the number of resources esti-
mated for a new user (information provided by the assignment module), this
module decides if admission is possible. The method of mean resource calcu-
lation therefore increases the number of admitted users in the system without
violating QoS of existing users and hence decreases the dropping probability.
Another important module of the system model in Fig 1 that interfaces
with AAA framework is the PBS. Every frame, the PBS selects the users
to be scheduled based on the assigned priority and accordingly forwards this
information to the assignment module. The priority of the user is inverse pro-
portional with the level of user satisfaction which is quantified by the achieved
QoS level. The users with the highest priority are scheduled first in the next
frame. By scheduling the users with least satisfaction, fairness is obtained.
The goal of this section was to propose a generic framework (AAA) which
can be used for any radio access technology (RAT) or for heterogeneous RATs.
The modules and the interfaces between them have been described.
4 ALLOCATION
4.1 Central Allocation
In previous works [3] [4] [5], dynamic resource allocation is done based on the
SINR experienced by the user in a previous frame or slot. This approach does
not guarantee maximum throughput as the SINR changes completely for one
frame to another and there is not a function mapping the current SINR to
the previous SINR value or the previous allocations. Even if the allocation
converges or stabilizes after a few frames, this cannot be guaranteed to be
optimal as path loss and fading change due to user mobility, leading to new
values of interference.](https://image.slidesharecdn.com/aaa-journal-130911025627-phpapp02/75/AAA-Allocation-Admission-and-Assignment-Control-for-Network-management-6-2048.jpg)
![A Joint AAA framework for NGN 7
Hence a new allocation scheme is proposed, in which interference is pre-
dicted by the central entity located inside the radio access network (RAN)
[13] based on the current allocation of resources for the users. The allocation
module receives input from the assignment module with a list of users and
downlink transmit power for each user, number of resources that need to be
allocated in order to achieve the QoS and the path loss for each user. The
output of the allocation module is a mapping of available resources for each
base station and the recommended resources for each user. Given that the
user has sufficient packets to be sent in his buffer or given that the user is
not experiencing deep fade, the base station may follow the recommendation
of the CA module. The base station also has the possibility of taking its own
decision about the users to be scheduled and the resources to be allocated at
each frame level. This local decision depends on traffic conditions of the user,
the channel fading conditions and the user satisfaction levels.
Furthermore, the interference experienced by a user in the next frame is
estimated from the channel gain which is based on the path loss of the user
from its own base station and neighboring base station. The allocation of
resources first considers the users experiencing the highest downlink transmit
power (which are most probably cell-edge users) and thus potentially creating
the most interference in the system. Once the resources for the user have been
allocated, the effect of this allocation on other users in the system is calculated.
The reason for allocating the far off users first is that the interference
created by far off users is higher compared to the nearby users. This way of
allocating resources, based on geographic position, ensures a low reuse factor
(e.g. 1/3) for cell-edge users and a high reuse factor (e.g. 1) for cell-center users.
The increase in reuse factor from cell-edge to cell-center increases depending
on the load of the network and distribution of the load in the network. The
proposed heuristic method of CA is explained for an orthogonal frequency
division multiple access (OFDMA) scheme based system (LTE).
Consider a network consisting of L base stations and a set of M users, with
users served by base station l denoted as Ml, where M =
L
l=1 Ml. The base
station l ∈ L that serves user m ∈ M is denoted as l(m). Let Gm,j denote
long term channel gain, which includes path loss and shadowing, from base
station j ∈ L to user m ∈ M. Gm,j is calculated from dm,j as shown in eq. 1,
where dm,j is the distance from user base station j to user m. The downlink
transmit power of user m from l(m) is denoted as Pm.
Gm,j = 44.9−6.55log10(hBS) log10(dm,j)+34.46+5.83log(hBS)+23(fc/5)
(1)
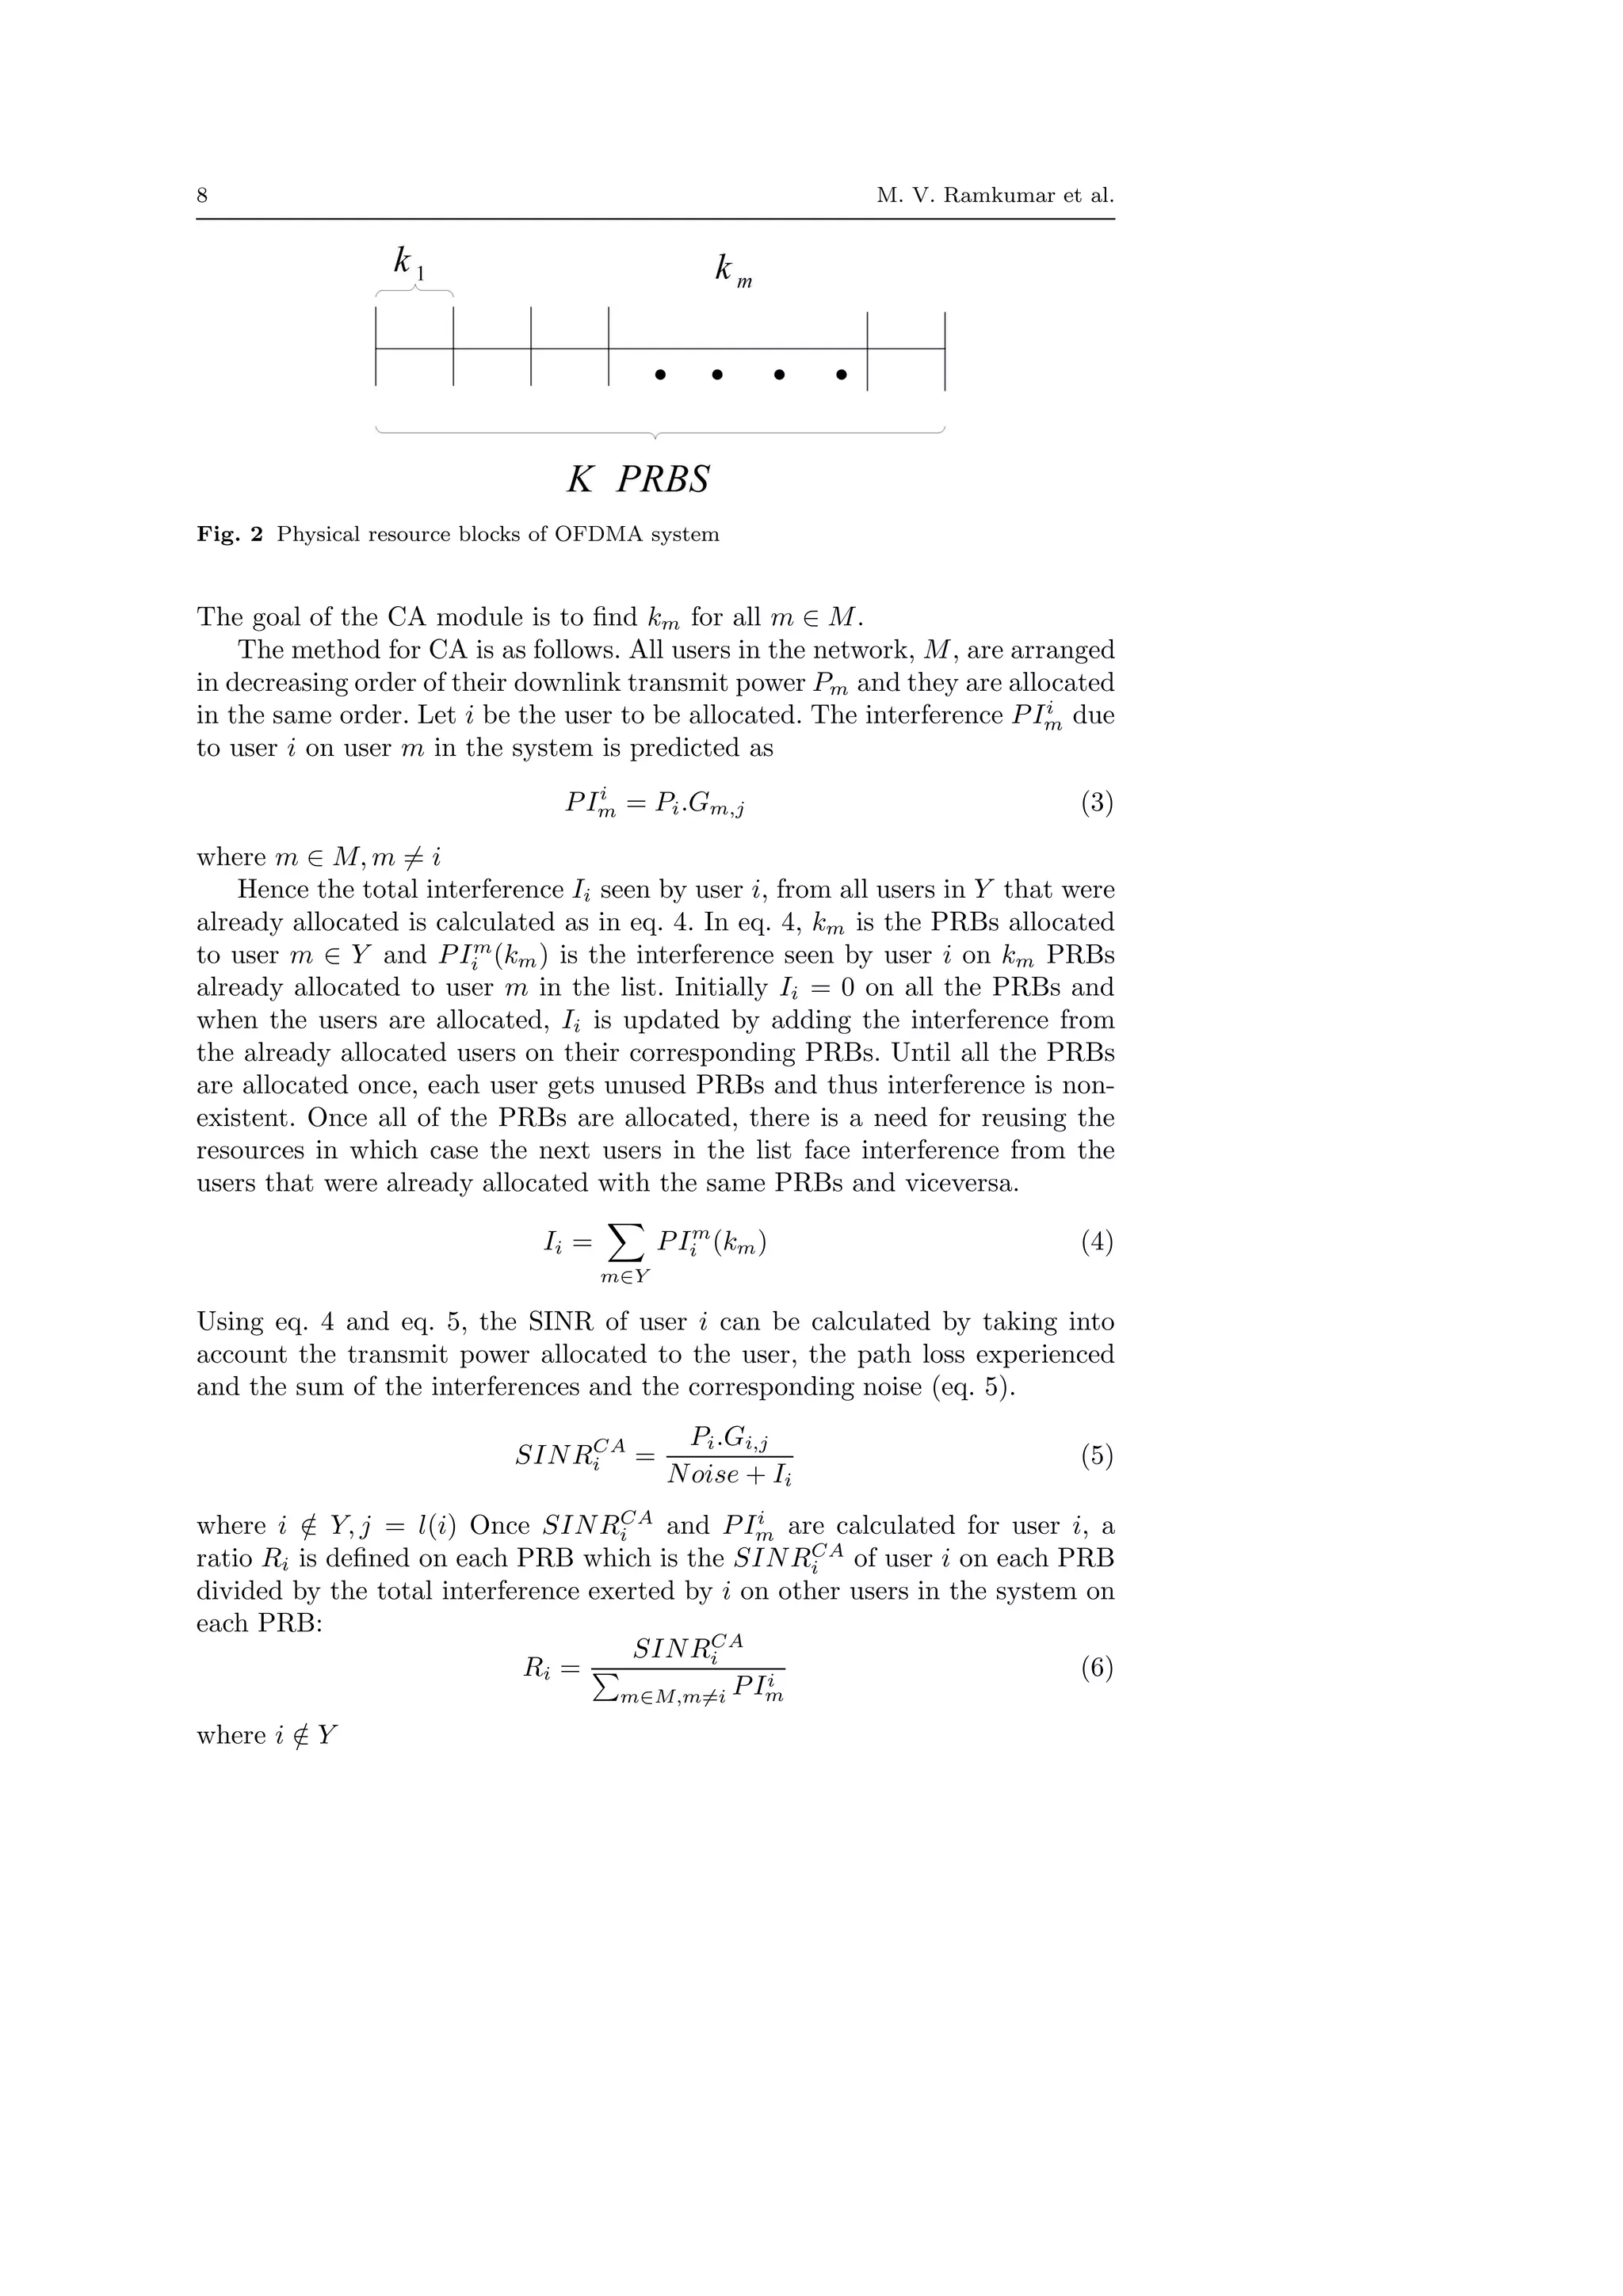
The multiple access scheme used is OFDMA with K PRBs in each frame,
with user m allocated with a set of km PRBs, of length |km| obtained from
the assignment module, as shown in Fig. 2 where
m∈M
|km| ≤ K (2)](https://image.slidesharecdn.com/aaa-journal-130911025627-phpapp02/75/AAA-Allocation-Admission-and-Assignment-Control-for-Network-management-7-2048.jpg)
![10 M. V. Ramkumar et al.
station l on PRB k.
SINRLA
i,k =
Pk
l(i).Gi,j.hk
i,j
Noise + l∈L,l=l(i) Pk
l .Gi,l
(7)
The goal of the LA is to find ki PRBs for user i such that the overall SINRLA
i,k
in each base station is maximized, as shown in eq. (8).
max
|Ml|
i=1
ki
k=1
SINRLA
i,k where ki ∈ K, |ki| < |K|, Ml ∈ M, |Ml| < |M|
(8)
5 Assignment
The assignment module estimates the number of resources required by each
user in order to have its QoS requirements met. This estimation is based
on a Markov-based modeling of the queue in the MAC layer by taking into
account the effects of AMC in the physical layer. Hence, this module guarantees
meeting the QoS requirements for the existing users and also for the new user
as this module is triggered at the time of admission. The assignment module
gets input from the PBS regarding the users to be scheduled in the next frame
and it forwards to the LA the number of resources required for every user.
Every super-frame it also sends to the CA module the user information, the
number of resources required by each user, downlink transmit power of the
user and the path loss of the user.
The estimation of the amount of resources takes into account the AMC in
the physical layer and the effects of the queue in the MAC layer. Each user
is given b resources in each frame and the goal of the assignment module is
to find suitable value of b that guarantees the QoS to the user. By using a
Markov-based analysis for the queue [16] as shown in Fig. 3, the assignment
module estimates the probability of dropping a packet (Pd). From the dropping
probability the estimation for throughput and delay for different values of b
are then derived. The most suitable value of b that matches the requested QoS
is selected.
Each state of a Markov chain is defined as (U, C) where U is the number of
packets waiting in the queue (can range from 0 to B where B is the buffer size)
and C represents the number of packets transmitted in the next frame. The
number of packets transmitted in a frame depends on the number of resources
allotted to the user and the AMC mode of the user in that particular frame.
Cn = bBn n = 1, 2...N (9)
where Bn is the number of bits per symbol depending on the AMC mode.
Hence C can take any value in C1, C2, ..., CN where N is the number of AMC
modes.](https://image.slidesharecdn.com/aaa-journal-130911025627-phpapp02/75/AAA-Allocation-Admission-and-Assignment-Control-for-Network-management-10-2048.jpg)
![A Joint AAA framework for NGN 11
Fig. 3 State transitions of two-dimensional Markov chain of a queue
Each user is allotted a buffer in the MAC layer and the size of the buffer
B depends on the type of user. For high data rate applications like video
conferencing, the buffer size B is large compared to low data rate applications
like voice. The number of packets waiting in the queue depends on the arrival
process A, the service process and the buffer length allocated to the user. The
arrival process is modeled with a Poisson distribution:
P(a) =
λa
e−λ
a!
(10)
where a ≥ 0 and E(A) = λ is the packet arrival rate, defined as the average
number of packets arriving during one frame, depending on the traffic model.
The service process depends on the AMC and on the SINR of the user
in the frame. The probability of the service process changing from one state
to another depends on the transition probability of a user changing from one
AMC mode to another by assuming that the number of resources allotted
to the user is fixed. In [14], the signal to noise ratio (SNR) was divided into
adjacent regions based on the desired bit error rate (BER). The transition
probabilities between the various SNR regions were determined based on the
Level Crossing Rate (LCR) of the channel fading distribution. Also it is as-
sumed that a user can transition one AMC mode at a time which can be seen
in the two-dimensional Markov chain of the queue in Fig. 3
Based on the probability of packet arrival, P(a), from the arrival process
and the transition probability between AMC modes, the steady state distribu-
tion of the two-dimensional Markov chain is calculated. From the steady state
distribution of the two-dimensional Markov chain P(U = u, C = c) [15], the
expected number of packets dropped from queue E(D) can be expressed as
E(D) =
a∈A,u∈U,c∈C
max(0, a−B+max(0, u−c))P(A = a)×P(U = u, C = c)
(11)](https://image.slidesharecdn.com/aaa-journal-130911025627-phpapp02/75/AAA-Allocation-Admission-and-Assignment-Control-for-Network-management-11-2048.jpg)
![12 M. V. Ramkumar et al.
The dropping probability of packets, Pd, from the queue is calculated from
the expected number of packets dropped from the queue and expected arrival
rate of packets as
Pd =
E(D)
λTf
(12)
where Tf is the frame duration. From the above dropping probability, Pd, the
packet loss rate (PLR) is calculated, which is defined as the probability that a
packet is lost and is composed of two factors: packet error rate (PER), which
is the ratio of packets lost due to radio environment, noise, etc. and the packet
dropping rate (PDR), which is the ratio of packets dropped due to timeouts
in the queue or due to the finite buffer length B. The packet is assumed to be
lost when there are bit errors in the packet and/or when the waiting time of a
packet in the buffer is more than a certain timeout. The PLR is calculated as
PLR = 1 − (1 − Pd)(1 − P0) (13)
where P0 is the PER due to channel fading and Pd is the dropping probability.
From PLR, the prior throughput is estimated as:
ηprior = λ(1 − PLR) (14)
From Little’s Theorem [17], the average number of packets waiting in the queue
is equal to the product of arrival rate of the packets and the average delay of
each packet. From this the expected prior delay is estimated as
τprior =
Nw
E(A)(1 − Pd)
(15)
where Nw is the average number of packets waiting in the queue plus the
average number of packets transmitted in one frame obtained from the steady
state probability P(U = u, C = c). ηprior and τprior are calculated for different
values of b. The minimum value of b that achieves the required QoS in terms
of throughput and delay requested by the user is selected. The assignment
module is triggered during admission to a new user and hence the estimated
value of b is sent to the admission control module. It is assumed that delay
in the transmission is only due to waiting time in the buffer, hence only Pd is
considered for the delay calculations. The delay caused due to retransmissions
caused by CRC errors is not considered.
6 Admission Control
The admission control [1] module is triggered when an admission request from
a new user is received. The user sends a request with the QoS requirements
needed for its application such as target SINR, data rate, delay, PER and
channel conditions (fading rate fd and fading index m). After receiving these
inputs the assignment module estimates the amount of resources needed to
obtain the QoS requested. Thus the assignment module checks whether the](https://image.slidesharecdn.com/aaa-journal-130911025627-phpapp02/75/AAA-Allocation-Admission-and-Assignment-Control-for-Network-management-12-2048.jpg)
![A Joint AAA framework for NGN 13
required resources are available in the network and accordingly takes the de-
cision to either admit or reject the user.
The admission control algorithm increases the number of connections that
can be served by taking the buffer conditions of each user into consideration
[12]. A user may not need to utilize all the resources allocated due to lack
of packets in the buffer. Thus, in order to obtain an efficient utilization of
the bandwidth, a mean resource calculation which finds the average number
of resources used by all the users in the system is performed. The number
of resources actually scheduled [11] can be expressed in the following way,
depending on the current channel conditions and the previous buffer status:
k(Ut−1, Ct) =
0; if Ct = 0,
km; if Ut−1 ≥ Ct,
floor(km∗Ut−1
Ct
); if Ut−1 < Ct.
(16)
where Ut−1 is the number of packets that are in the queue for user m at the
time moment t−1, km is the number of resources estimated by the assignment
module for user m and Ct is the number of packets that can be accommodated
in the next frame with the selected AMC mode. If km is the maximum number
of resources that can be allocated to user m, then the maximum number of
resources that can be allocated to all the users in a system is kM = m∈M km.
The users are admitted until kM reaches the maximum number of resources
in the system. The goal of the mean resource allocation is to find the average
value of kM , such that a maximum number of users can be accommodated in
the system.
The mean number of resources used by all users, or average value of kM , is
estimated from the steady state distribution of kM , which can be determined
from the Z-transform Dm(z) of km. The Z-transform of km can be expressed
as:
Dm(z) =
j
P(km = j)z−j
(17)
where P(km = j) is the probability that the user m is allocated with j re-
sources. The Z transform of kM is expressed as DM (z) = m∈M Dm(z). By
calculating the inverse Z-transform, the steady state distribution of kM is ob-
tained as:
P(kM = j) = Z−1
DM (z) (18)
From the steady state distribution of kM the mean number of resources kmean
M
used by all the users in the system is obtained. Based on the estimated value
of kmean
M , a new user m which requires km resources is admitted according to:
km + kmean
M ≤ Ktotal (19)
where Ktotal is the total number of resources available in the system.](https://image.slidesharecdn.com/aaa-journal-130911025627-phpapp02/75/AAA-Allocation-Admission-and-Assignment-Control-for-Network-management-13-2048.jpg)
![14 M. V. Ramkumar et al.
Table 1 Weight Coefficients
Service type Notes ωrt
u ωnrt
u
1 High rate and low delay 1 0
2 Low delay 1 1
3 High rate 0 1
4 Best Effort 0 0
7 Priority Based Scheduler
The main function of the PBS is to schedule the users based on the estimated
priority so that the user with highest priority is scheduled first. The amount
of resources to be allocated to each user is estimated by the admission control
algorithm based on the achieved QoS. For each user a satisfaction index (SI)
which gives the level of user satisfaction and indicates how throughput and
delay of a user is achieved w.r.t. the desired values is calculated. The desired
QoS values are assumed to be dependent on the type of service. From the SI
values the PBS calculates the priorities for each user and sends them to the
LA module. The SI is represented as a function of delay Γu(t) or as a function
of rate Ψu(t) [12]. In either case, the lower the SI, the higher the priority user
will be assigned.
The delay component SI is expressed with regards to the head of line (HOL)
delay ωu, which is the longest delay experienced by a packet at the HOL, and
the maximum delay for service u, T (u), as shown below:
Γu(t) =
T (u)−∆T (u)
ωu(t) ; if ωu(t) < T (u) − ∆T (u),
1; otherwise.
(20)
where ∆T (u) is a safety margin. The rate component is expressed in terms of
the average rate measured, ηu, and the desired data rate, ˆηu:
Ψu(t) =
ηu
ˆηu − ∆ ˆηu
(21)
where ∆ ˆηu is the margin coefficient. The safety margin and margin coefficient
are used due to the variations in the radio link conditions.
The priority function has two components Φrt
u and Φnrt
u as shown in eq. 23
and eq. 24, where Φrt
u is the real time component based on the delay and Φnrt
u
is the non real time component based on the data rate.
Φu = ωrt
u φrt
u + ωnrt
u φnrt
u (22)
where the weight coefficients ωrt
u and ωnrt
u are determined based on the service
type as shown in Table 1. The expressions for Φrt
u and Φnrt
u are
Φrt
u =
Ru
1
Γu(t) ; if Γu(t) ≥ 1; Ru = 0,
1; if 0 < Γu(t) < 1; Ru = 0,
0; if Ru = 0
(23)](https://image.slidesharecdn.com/aaa-journal-130911025627-phpapp02/75/AAA-Allocation-Admission-and-Assignment-Control-for-Network-management-14-2048.jpg)
![A Joint AAA framework for NGN 15
Φnrt
u =
Ru
1
Ψu(t) ; if Ψu(t) ≥ 1; Ru = 0,
1; if 0 < Ψu(t) < 1; Ru = 0,
0; if Ru = 0
(24)
where Ru is the normalized channel quality in the range [0 1], as high received
SNR induces high capacity which results in high priority.
Using the above equations, the calculation of the priority function Φu is
performed. From the above calculations, the users with least satisfaction are
given the highest priority and scheduled first. This approach ensures fairness
for each user.
8 Simulation Results
8.1 Simulation Setup
The setup simulated in MATLAB is a 4-cell network, with users distributed
randomly in each cell as shown in Fig. 4. LTE-TDD is used with 10MHz
bandwidth at 3.5GHz center frequency. The number of PRBs used in each cell
depends on the load of the cell. The PRBs are distributed uniformly among
users in the cell based on the type of the user. The users are moving with 3
km/h speed within the cell with a 250m radius in urban scenario. The users
move straight in random directions and bounce back when a cell boundary
is reached. The path loss model used for the urban scenario is C2 NLOS
developed in Winner [18] as shown in eq. 1.
Each user is assigned a buffer of length 15, 30 or 60 packets depending
on the type of user. Three types of users are selected based on the data rate
400kbps, 800kbps or 2Mbps. Based on the type of user the λ of the poisson
distribution is chosen, which decides the packet arrival rate. The number of
users depends on the load of the cell with each type of user randomly selected.
The transmit power of the base station is 43dBm, which is equally dis-
tributed on all PRBs. In each frame the SINR is measured on each PRB by
calculating the received signal from the current base station and interfering
signal from neighbor base stations on each PRB. Based on the measured SINR
the LA assigns the PRBs to each user such that the overall SINR in each cell
is maximized.
The CA module allocates the PRBs to each cell once in every super frame
based on the predicted SINR. A super frame consists of 20 frames. The pro-
posed CA+LA is compared with an existing method [5] in the literature which
is also a hybrid approach, with a standalone LA complemented by a random
allocation. The base station transmits to each user on the allocated PRBs. The
SINR is measured in each frame and mapped to the Shannon throughput. The
simulation parameters used in the simulation are given in the Table 2. The
simulation is run for 1000 frames and averaged over 100 runs.](https://image.slidesharecdn.com/aaa-journal-130911025627-phpapp02/75/AAA-Allocation-Admission-and-Assignment-Control-for-Network-management-15-2048.jpg)
![16 M. V. Ramkumar et al.
Fig. 4 4-cell network
Table 2 Simulation Parameters
Parameter Value
Carrier frequency fc 3.5Ghz
Deployment scenario Urban macro
Intersite distance 500m
Path loss model C2 NLOS
Mobility 3 Kmph
Bandwidth 10 Mhz
Antenna Omni directional
downlink Tx power 43 dBm
UL Tx power 24 dBm
target SINR 15 dB
Noise figure 9dB
Buffer length B [15, 30, 60] for Type 1,2,3
Packet length 84 bits
Packet arrival rate, λ [3, 5, 12] for Type 1,2,3
Number of AMC modes BPSK, 4, 8, 16, 32, 64 QAM
SINR thresholds [dB] [7.2 10.1 12.5 16.1 18.7 22.2]
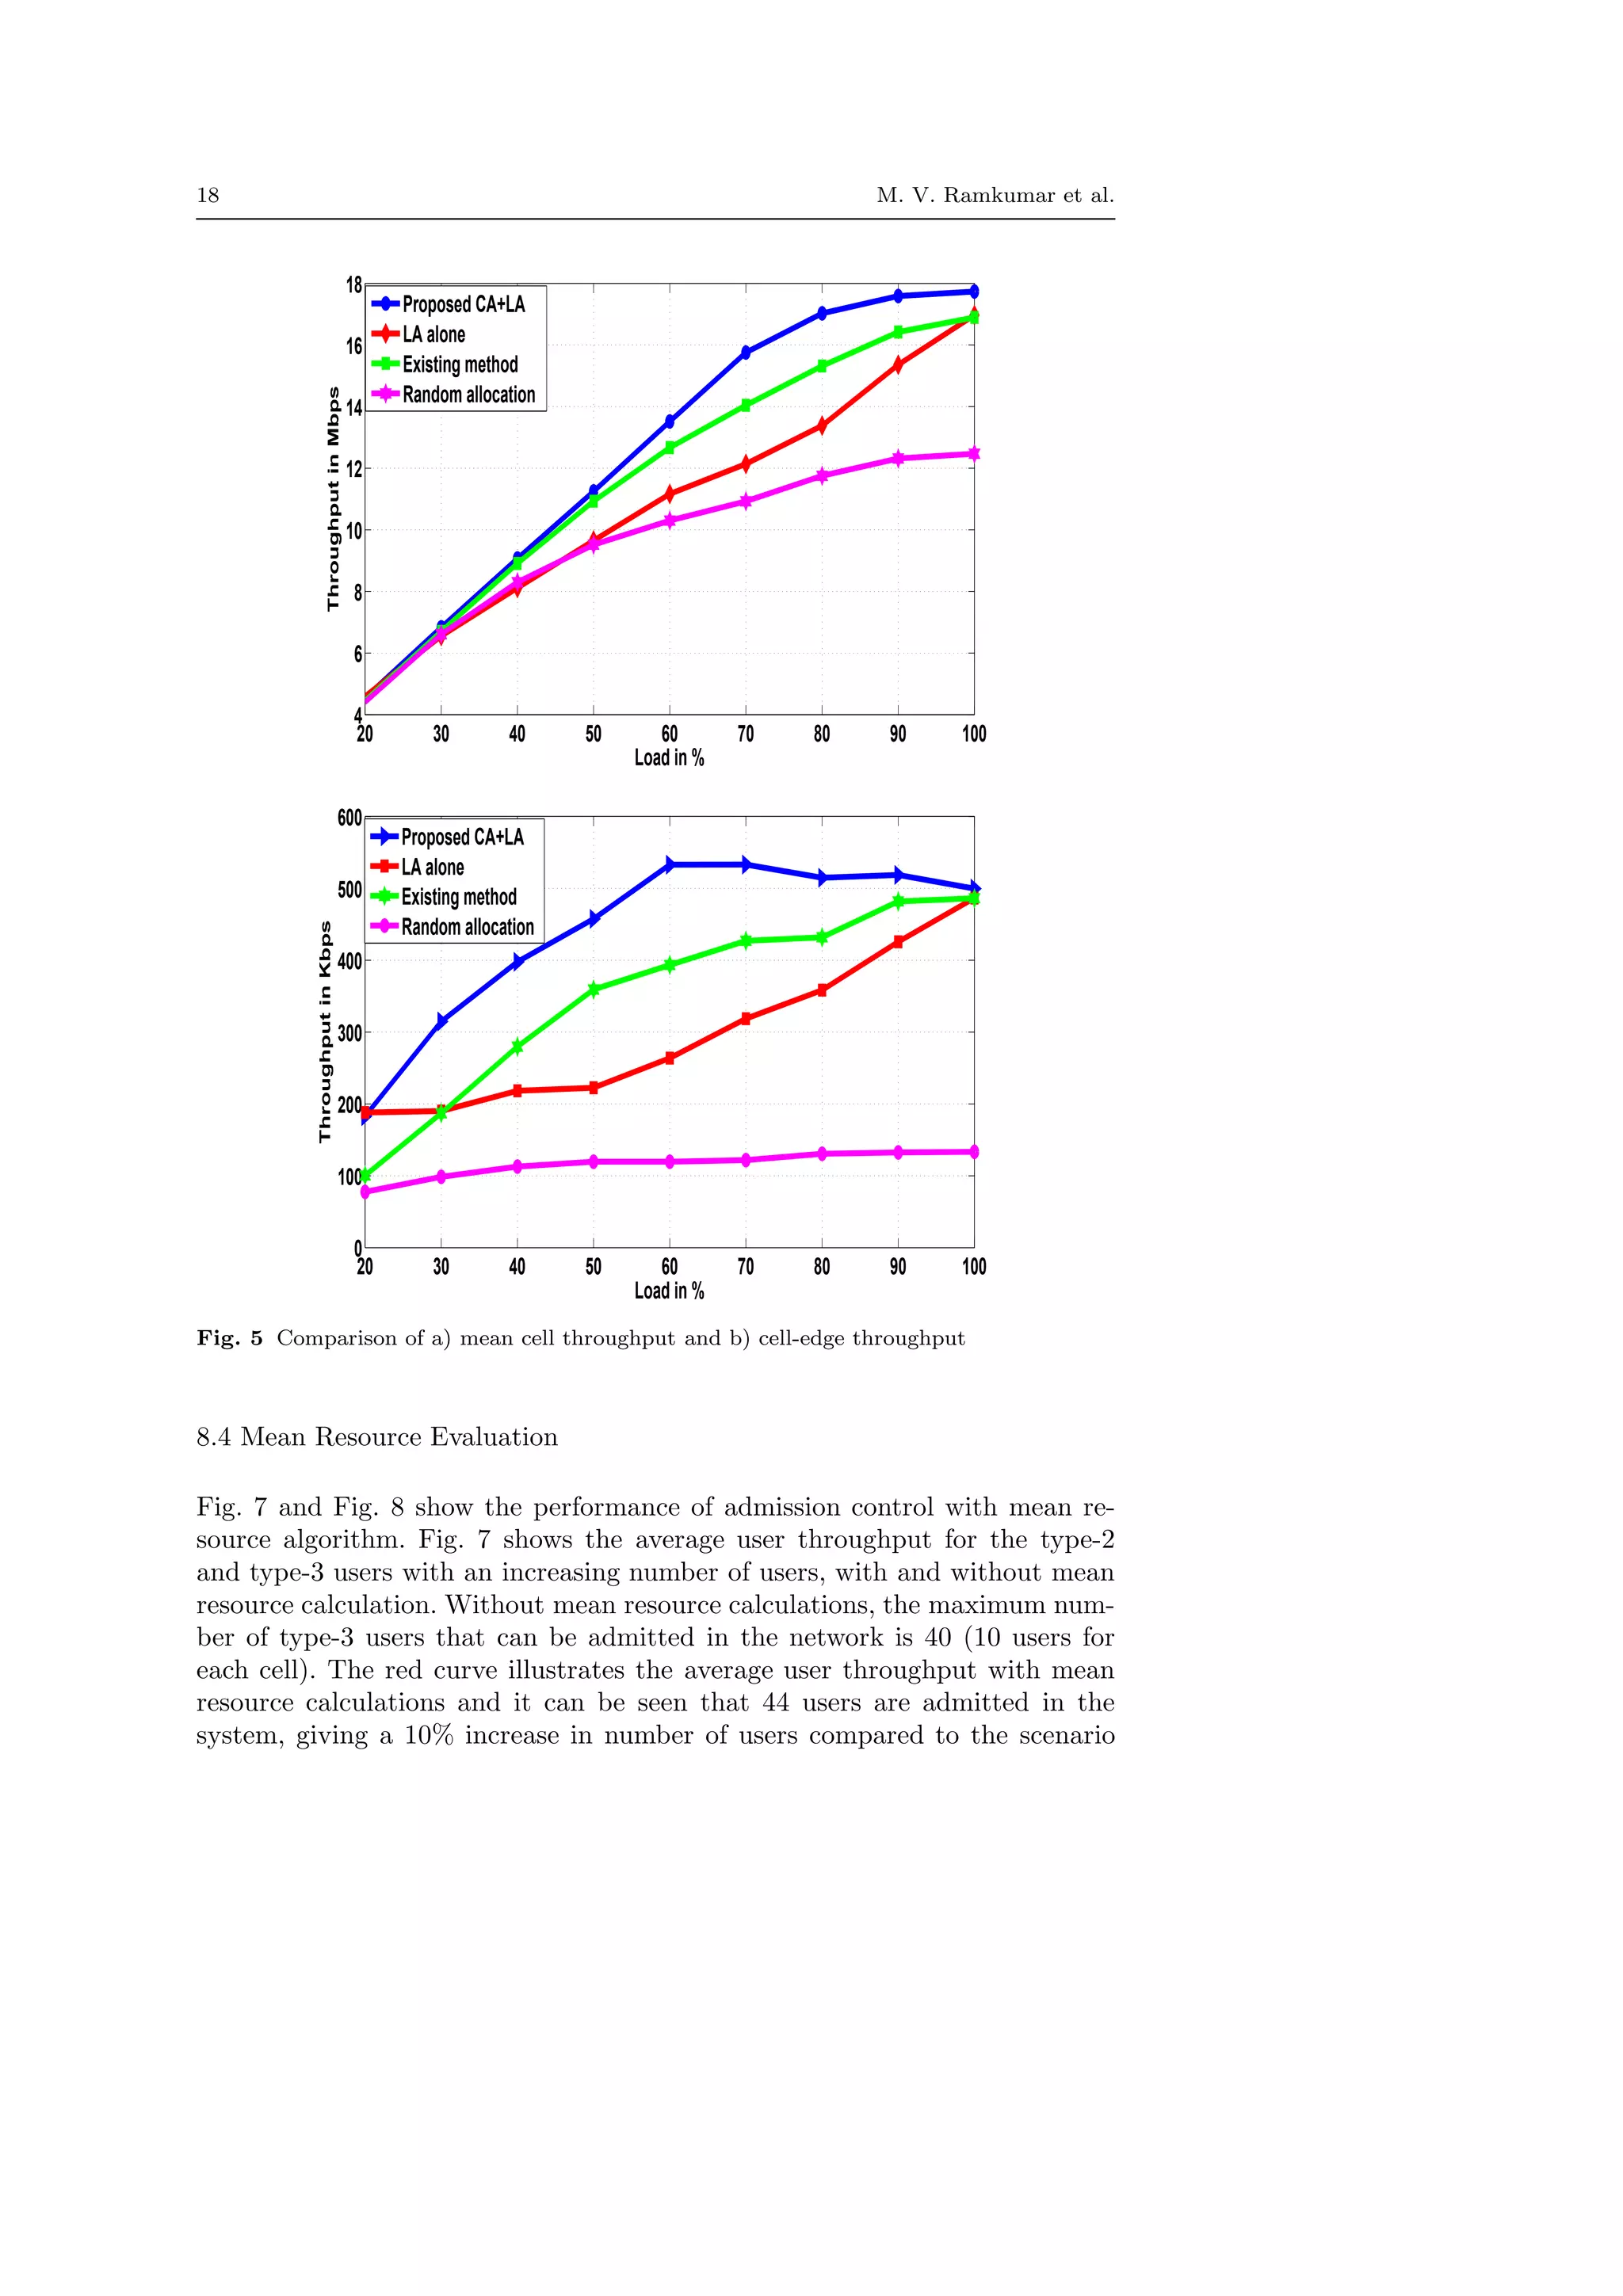
8.2 Cell Throughput
Fig. 5.a shows the mean cell throughput and average cell-edge throughput of
the network with increasing load. The load is varied by varying the number
of PRBs used in the cell. The existing hybrid method is compared with the
proposed CA+LA method, and it can be seen that at 70% and 80% load, the
proposed approach performs around 2Mbps or 14% better than the existing
method.](https://image.slidesharecdn.com/aaa-journal-130911025627-phpapp02/75/AAA-Allocation-Admission-and-Assignment-Control-for-Network-management-16-2048.jpg)
![A Joint AAA framework for NGN 17
Also with CA+LA the performance of mean cell throughput is around
4Mbps better than LA alone at 60% and 70% loads. The CA recommends the
PRBs to be used by each cell for every super frame and, as load reaches 100%,
the CA has to recommend all of the PRBs for each cell; hence the performance
of CA+LA and LA standalone merges at 100% load. At lower loads, as the
effect of interference is low, the difference in performance between CA+LA and
LA standalone is lower when compared to higher loads. The proposed solution
is also compared with a random allocation. It can be seen that LA standalone
and CA+LA perform around 5Mbps better than random allocation at 100%
load. At 90% load CA+LA performs 6Mbps better than random allocation,
whereas LA standalone performs 4Mbps better than random allocation.
The cell-edge throughput shown in Fig. 5.b is defined as the outage through-
put of users below 5%. From the CDF of the average user throughput of all
users, the value at 5% is outage throughput, which is assumed as cell edge
throughput. The performance of cell-edge user for the proposed approach is
better by 125kbps or around 30% compared to the existing method [5] at 60%
load. As explained above, the difference in performance can be better observed
at medium loads. At 100% load the performance of the proposed heuristic
method for CA with LA and the LA standalone is the same. At 90% load, the
proposed CA+LA performs around 400kbps better than random allocation,
whereas LA standalone performs 300kbps better than random allocation. The
dip at lower loads is due to less or zero number of cell-edge users at the lower
loads. Due to the less number of users, cell edge throughput is low at lower
loads.
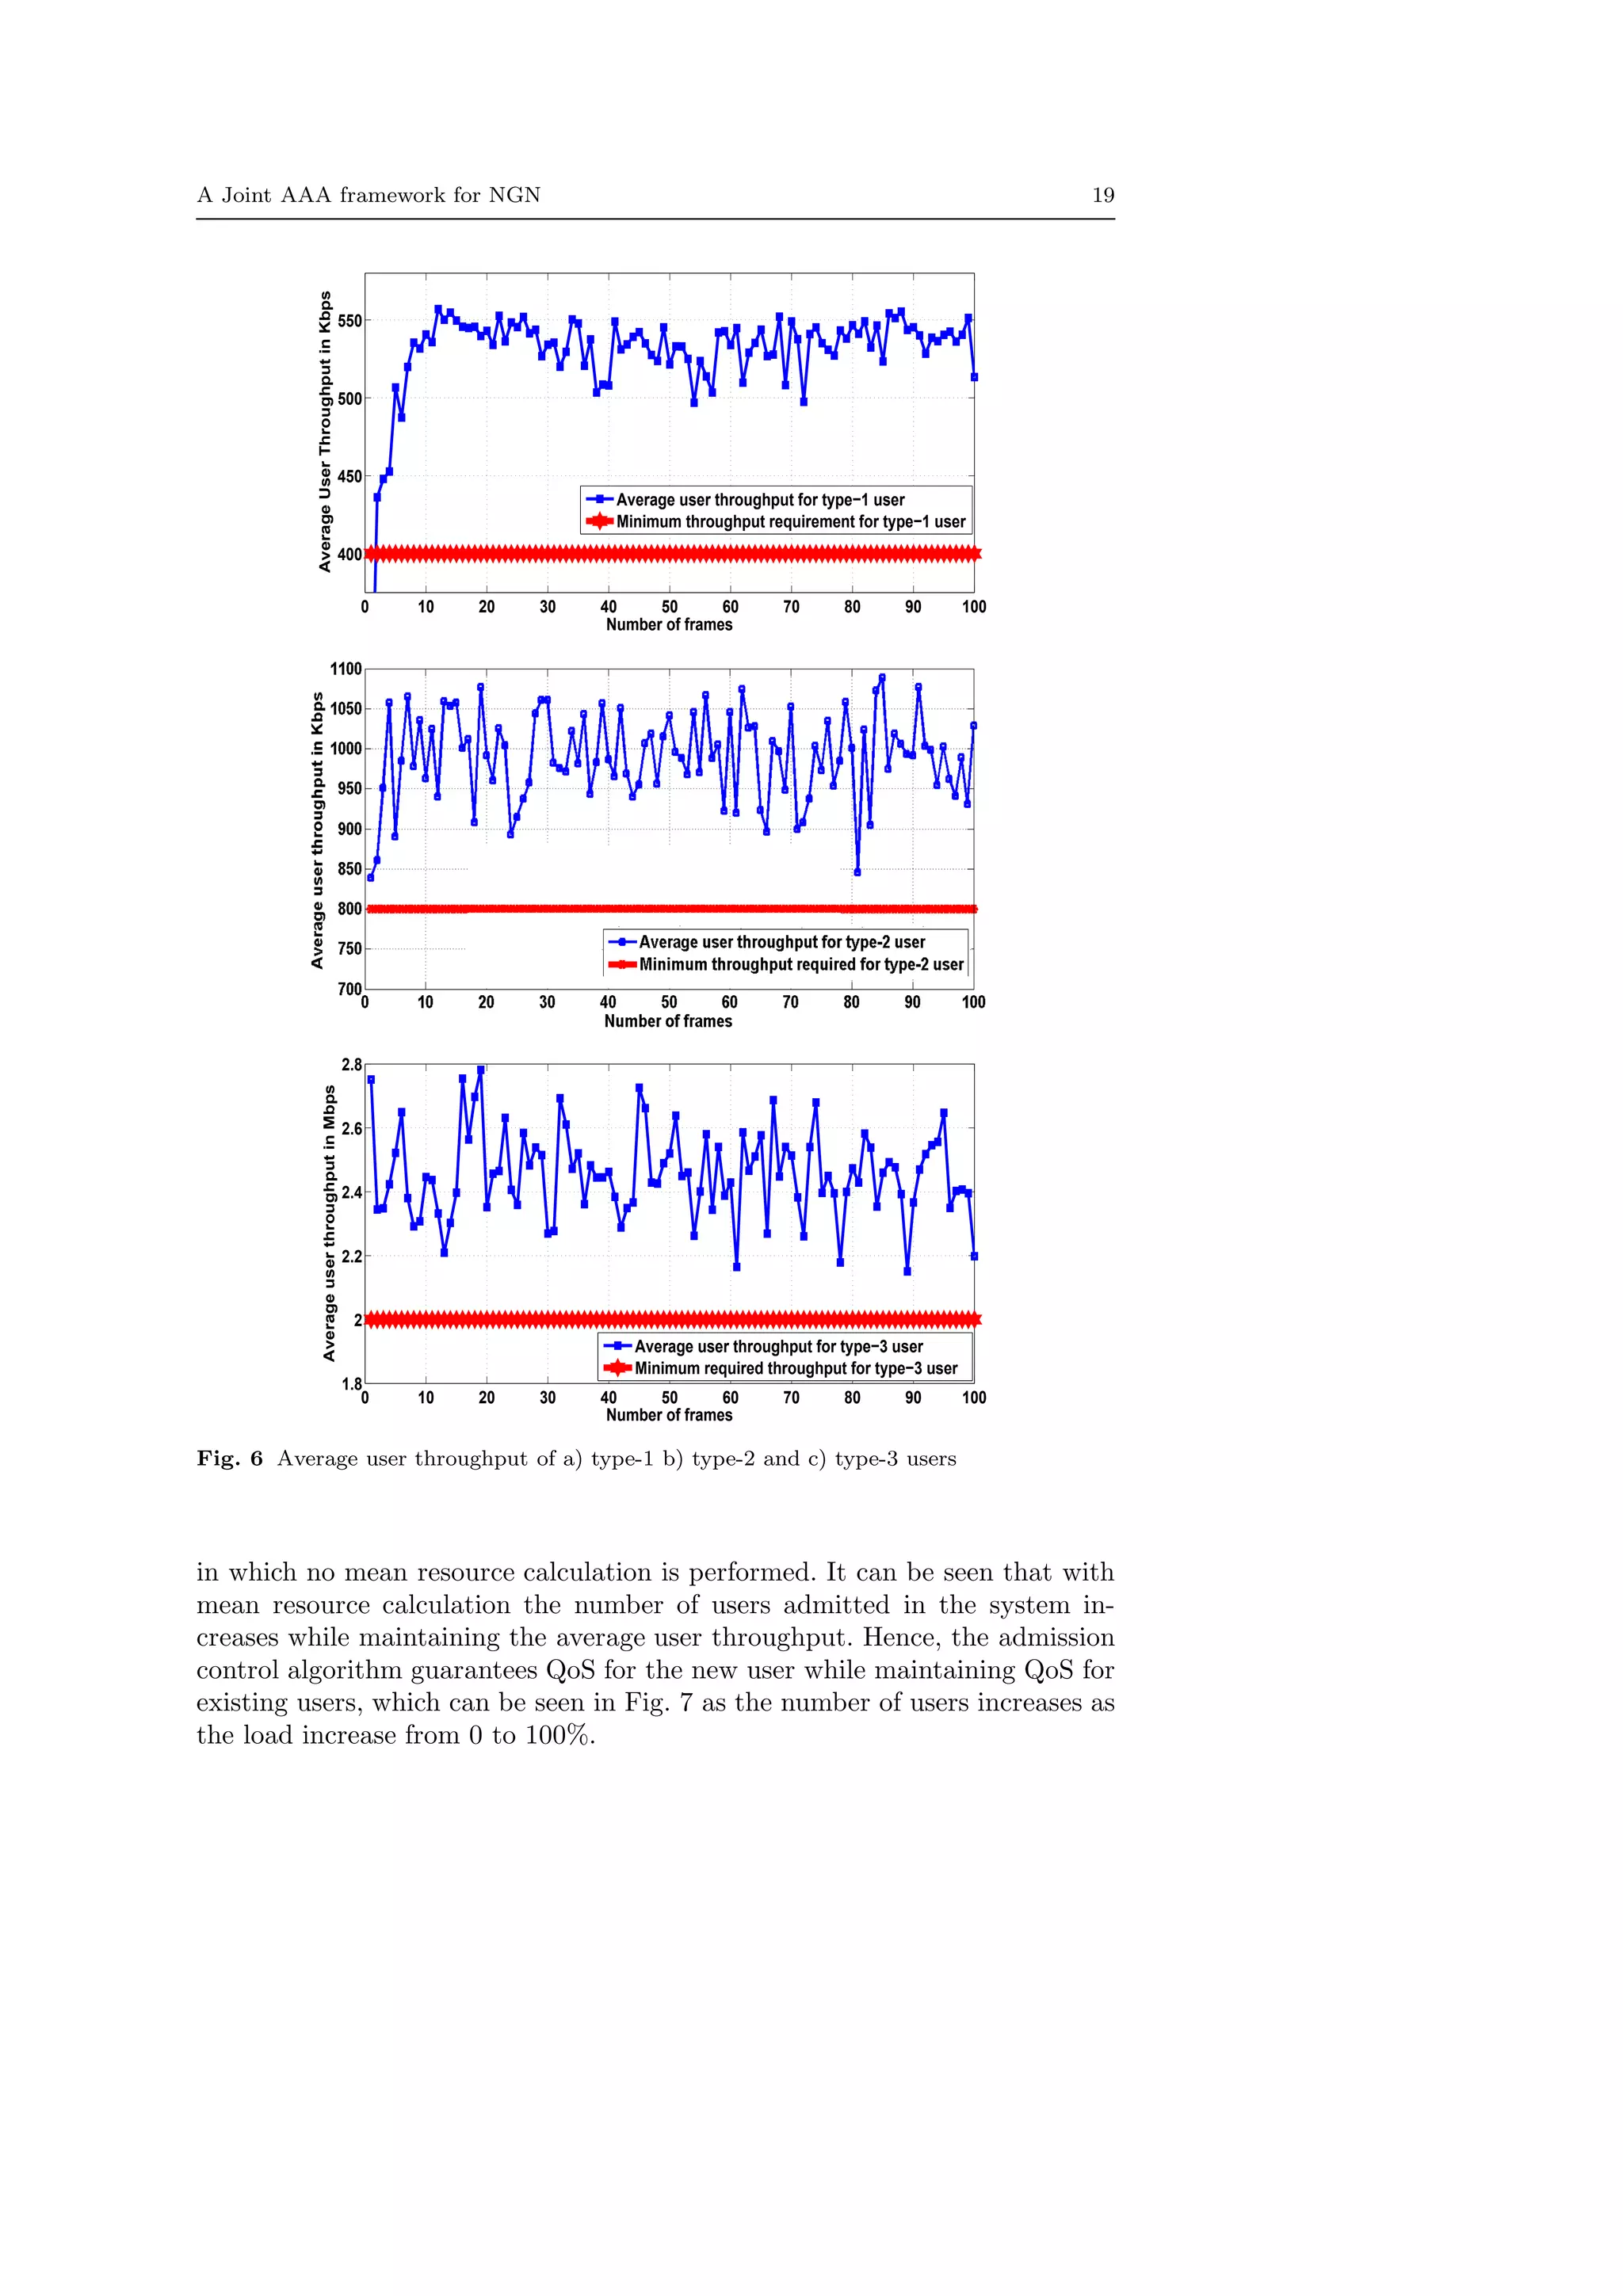
8.3 User Throughput
The assignment module estimates the number of PRBs required by each type
of user for a given target SINR. We assume three types of users with data
rates 400kbps, 800kbps and 2Mbps. For each user type the number of PRBs
required in order to obtain the target throughput is estimated by the assign-
ment module. For each user type the parameters chosen are shown in Table 2.
For AMC, if the SINR is below 7.2dB, then there will be no transmission.
By using the above values the assignment module estimates the probability
of dropping the packets for various values of b, where b is the number of
PRBs allotted to each user. From the dropping probability the throughput is
calculated. Fig. 6.a, Fig. 6.b and Fig. 6.c show the average throughput of type-
1, type-2 and type-3 users in the system with required throughput of 400kbps,
800kbps and 2Mbps respectively. The red line shows the required throughput
of the user and the blue line shows the achieved throughput. It can be seen that
on an average all users in each type obtain the required throughput. Hence
the assignment module guarantees the QoS for the user.](https://image.slidesharecdn.com/aaa-journal-130911025627-phpapp02/75/AAA-Allocation-Admission-and-Assignment-Control-for-Network-management-17-2048.jpg)