Download as PDF, PPTX

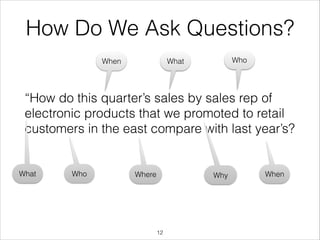


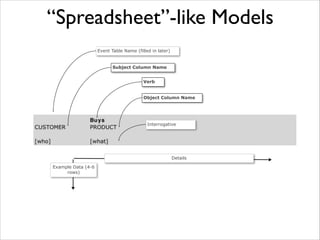
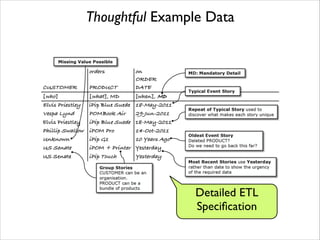
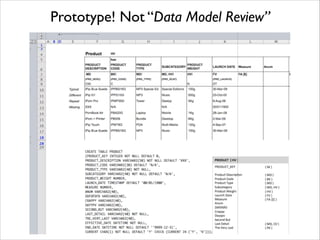
![Capture Example Data
verb
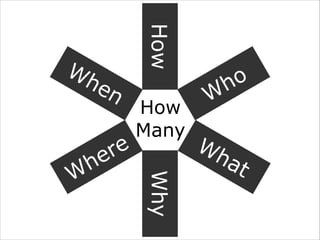
on/at/every
SUBJECT
OBJECT
EVENT
DATE
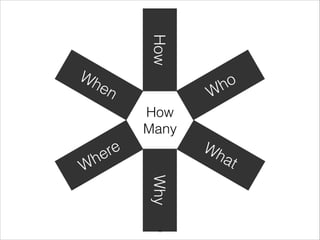
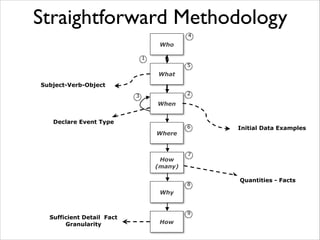
[who]
[what]
[when]
[where]
[how many]
[why]
[how]
Typical
Typical/Popular
Typical
Typical
Typical/Average
Typical/Normal
Typical/Normal
Different
Different
Different
Different
Different
Different
Different
Repeat
Repeat
Repeat
Repeat
Repeat
Repeat
Repeat
Missing
Missing
Missing
Missing
Missing
Missing
Missing
Group
Multiple/Bundle
Old, Low
Old, Low Value
Oldest needed
Near
Min, Negative, 0
New, High
New, High
Most Recent, Future
Far
Max, Precision
Multi-Level
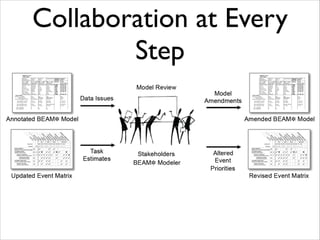
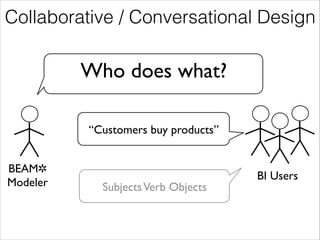
Engage business users
Clarify definitions / Conform Dimensions
Illustrate exceptions
Drive out uniqueness
“Show and tell”
Multiple Values
Exceptional
Exceptional](https://image.slidesharecdn.com/a2cbostonbigdatameetup20131114-131116193233-phpapp02/85/Agile-Data-Warehouse-Design-for-Big-Data-Presentation-69-320.jpg)


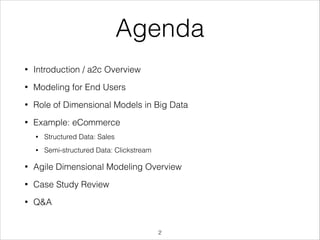
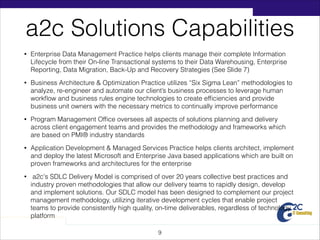
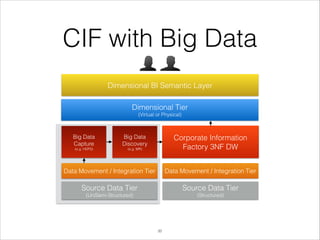
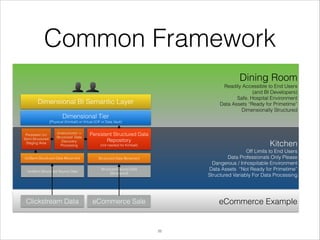
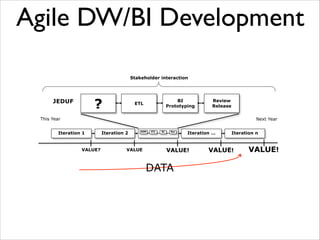
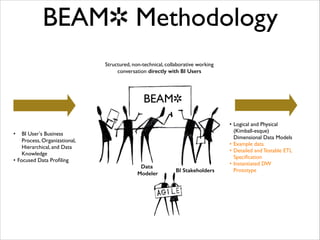
The document discusses agile data warehouse design with a focus on big data, highlighting its importance in business analytics and modeling for end users. It outlines the practices and methodologies adopted by A2C, a consultancy firm specializing in data management across various industries. Key components include dimensional modeling, the integration of structured and semi-structured data, and the use of effective frameworks for data analysis and visualization.