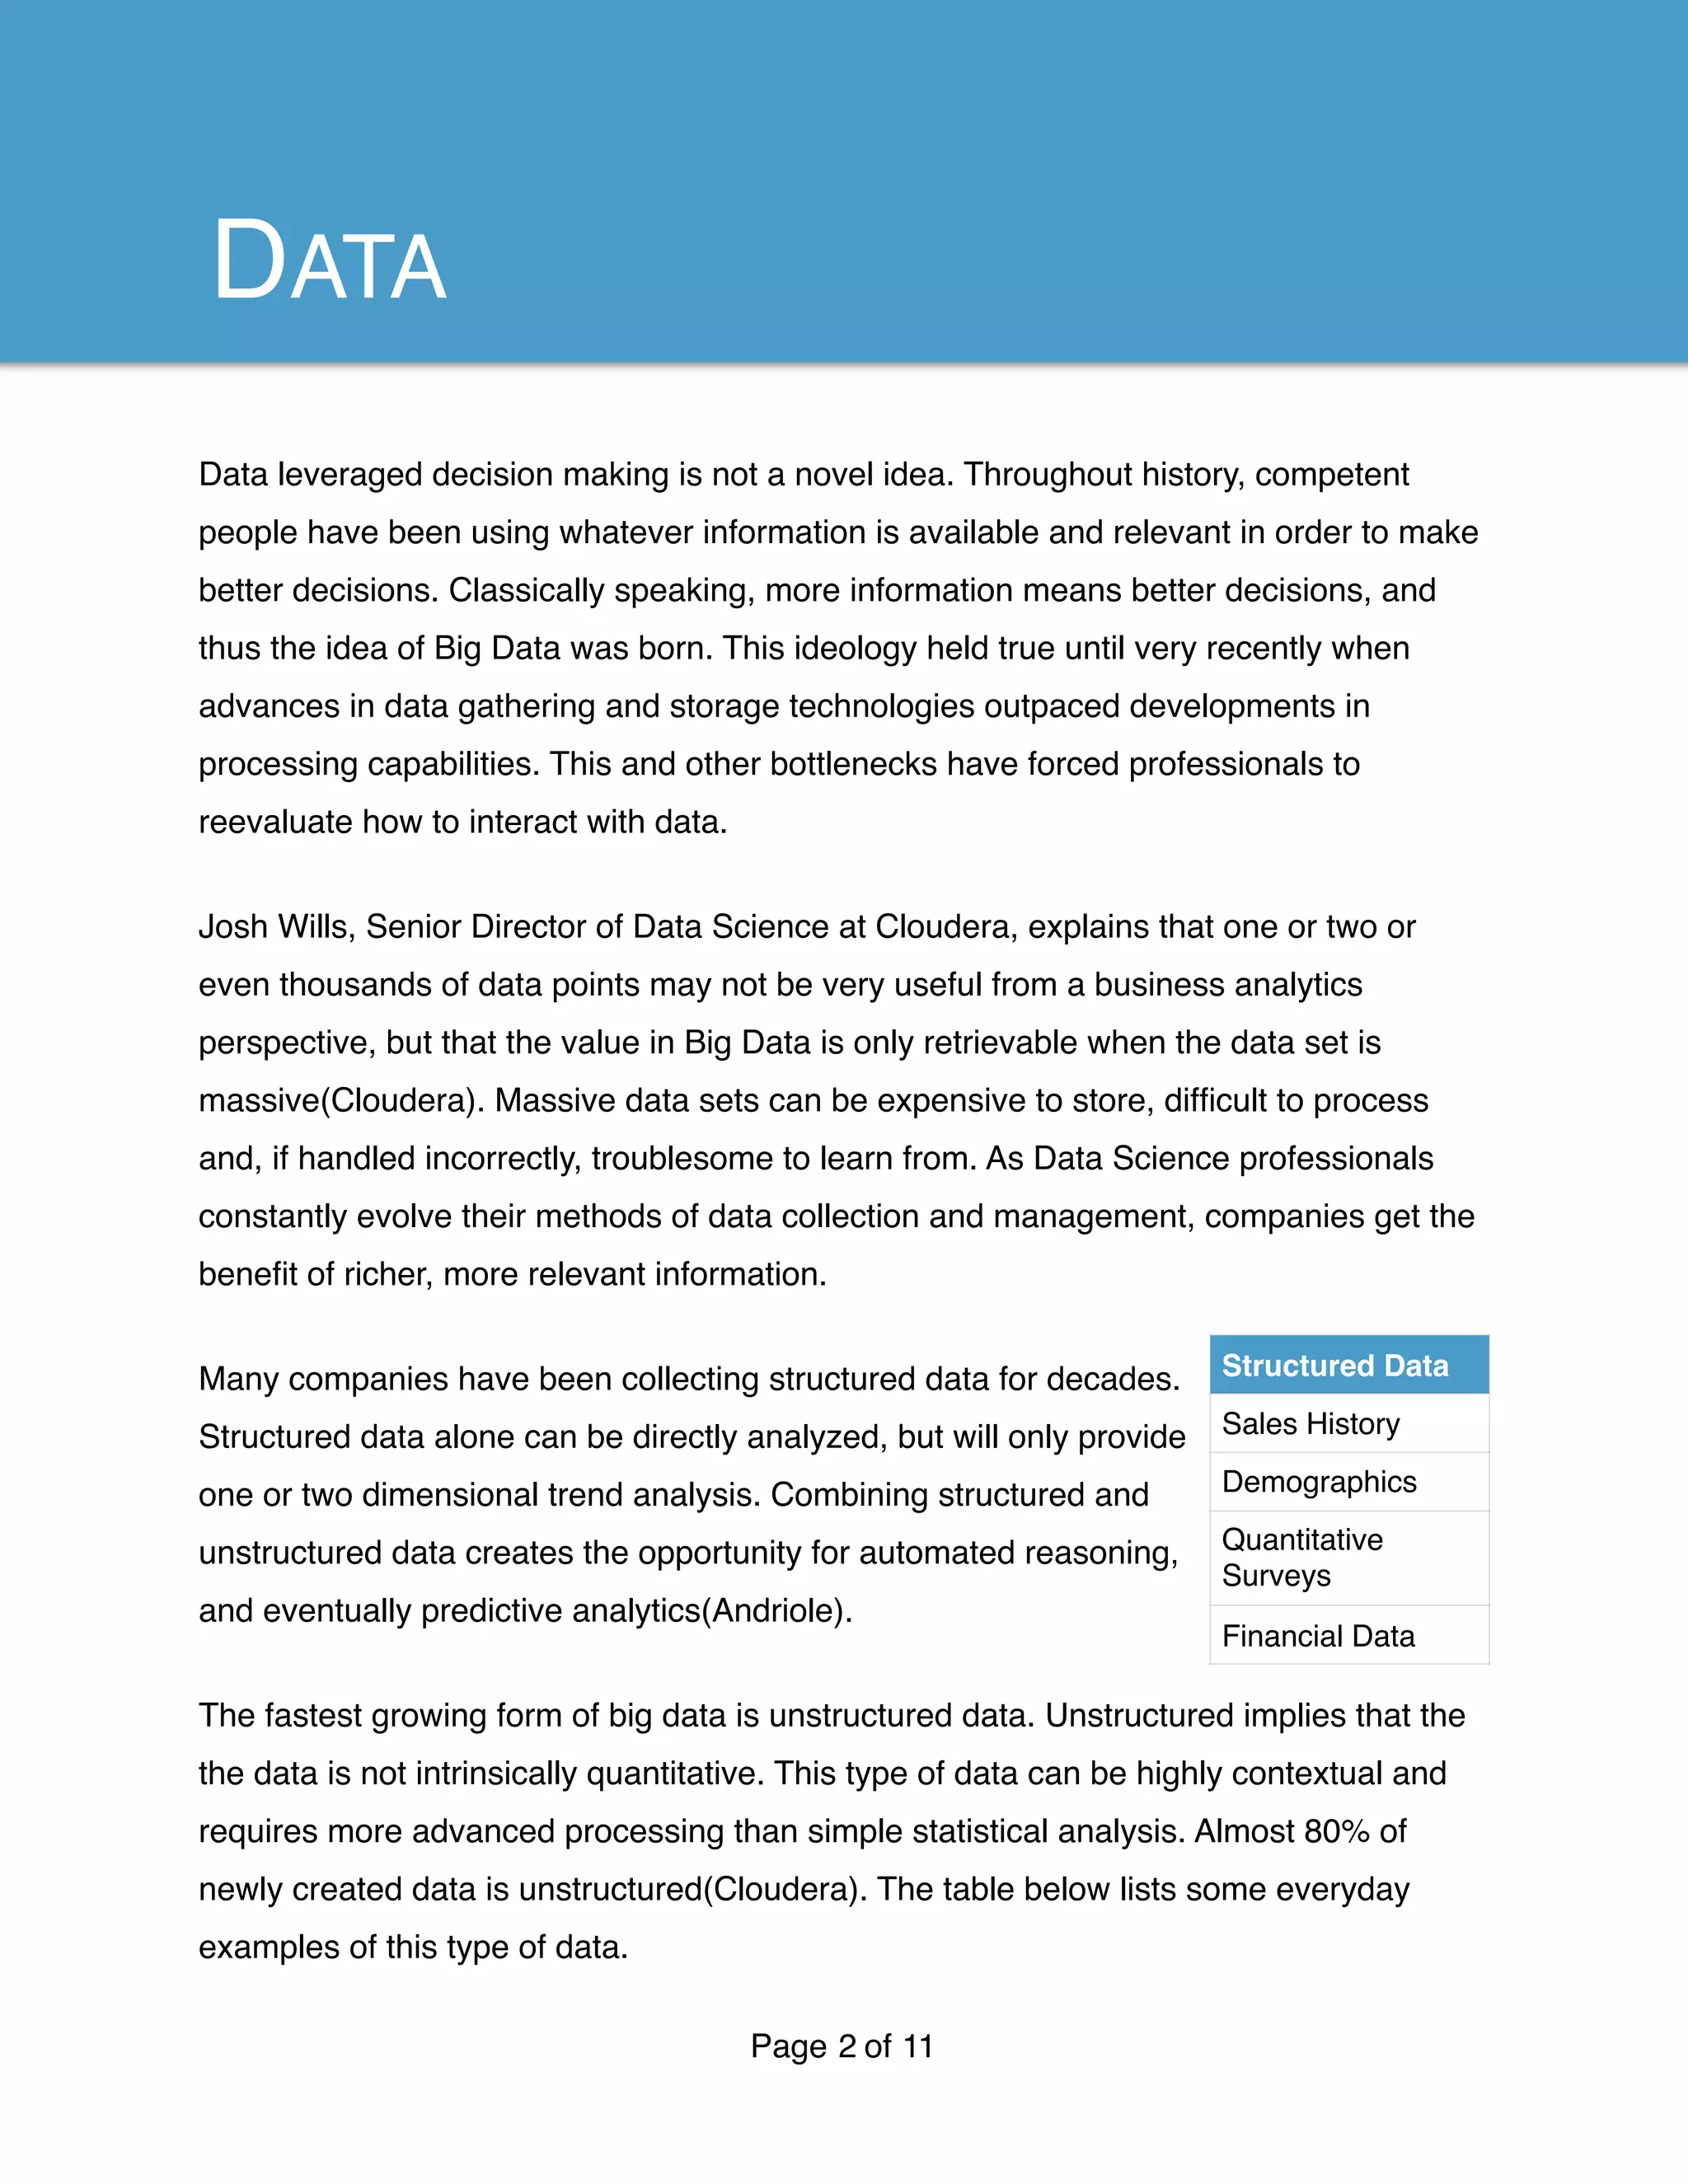
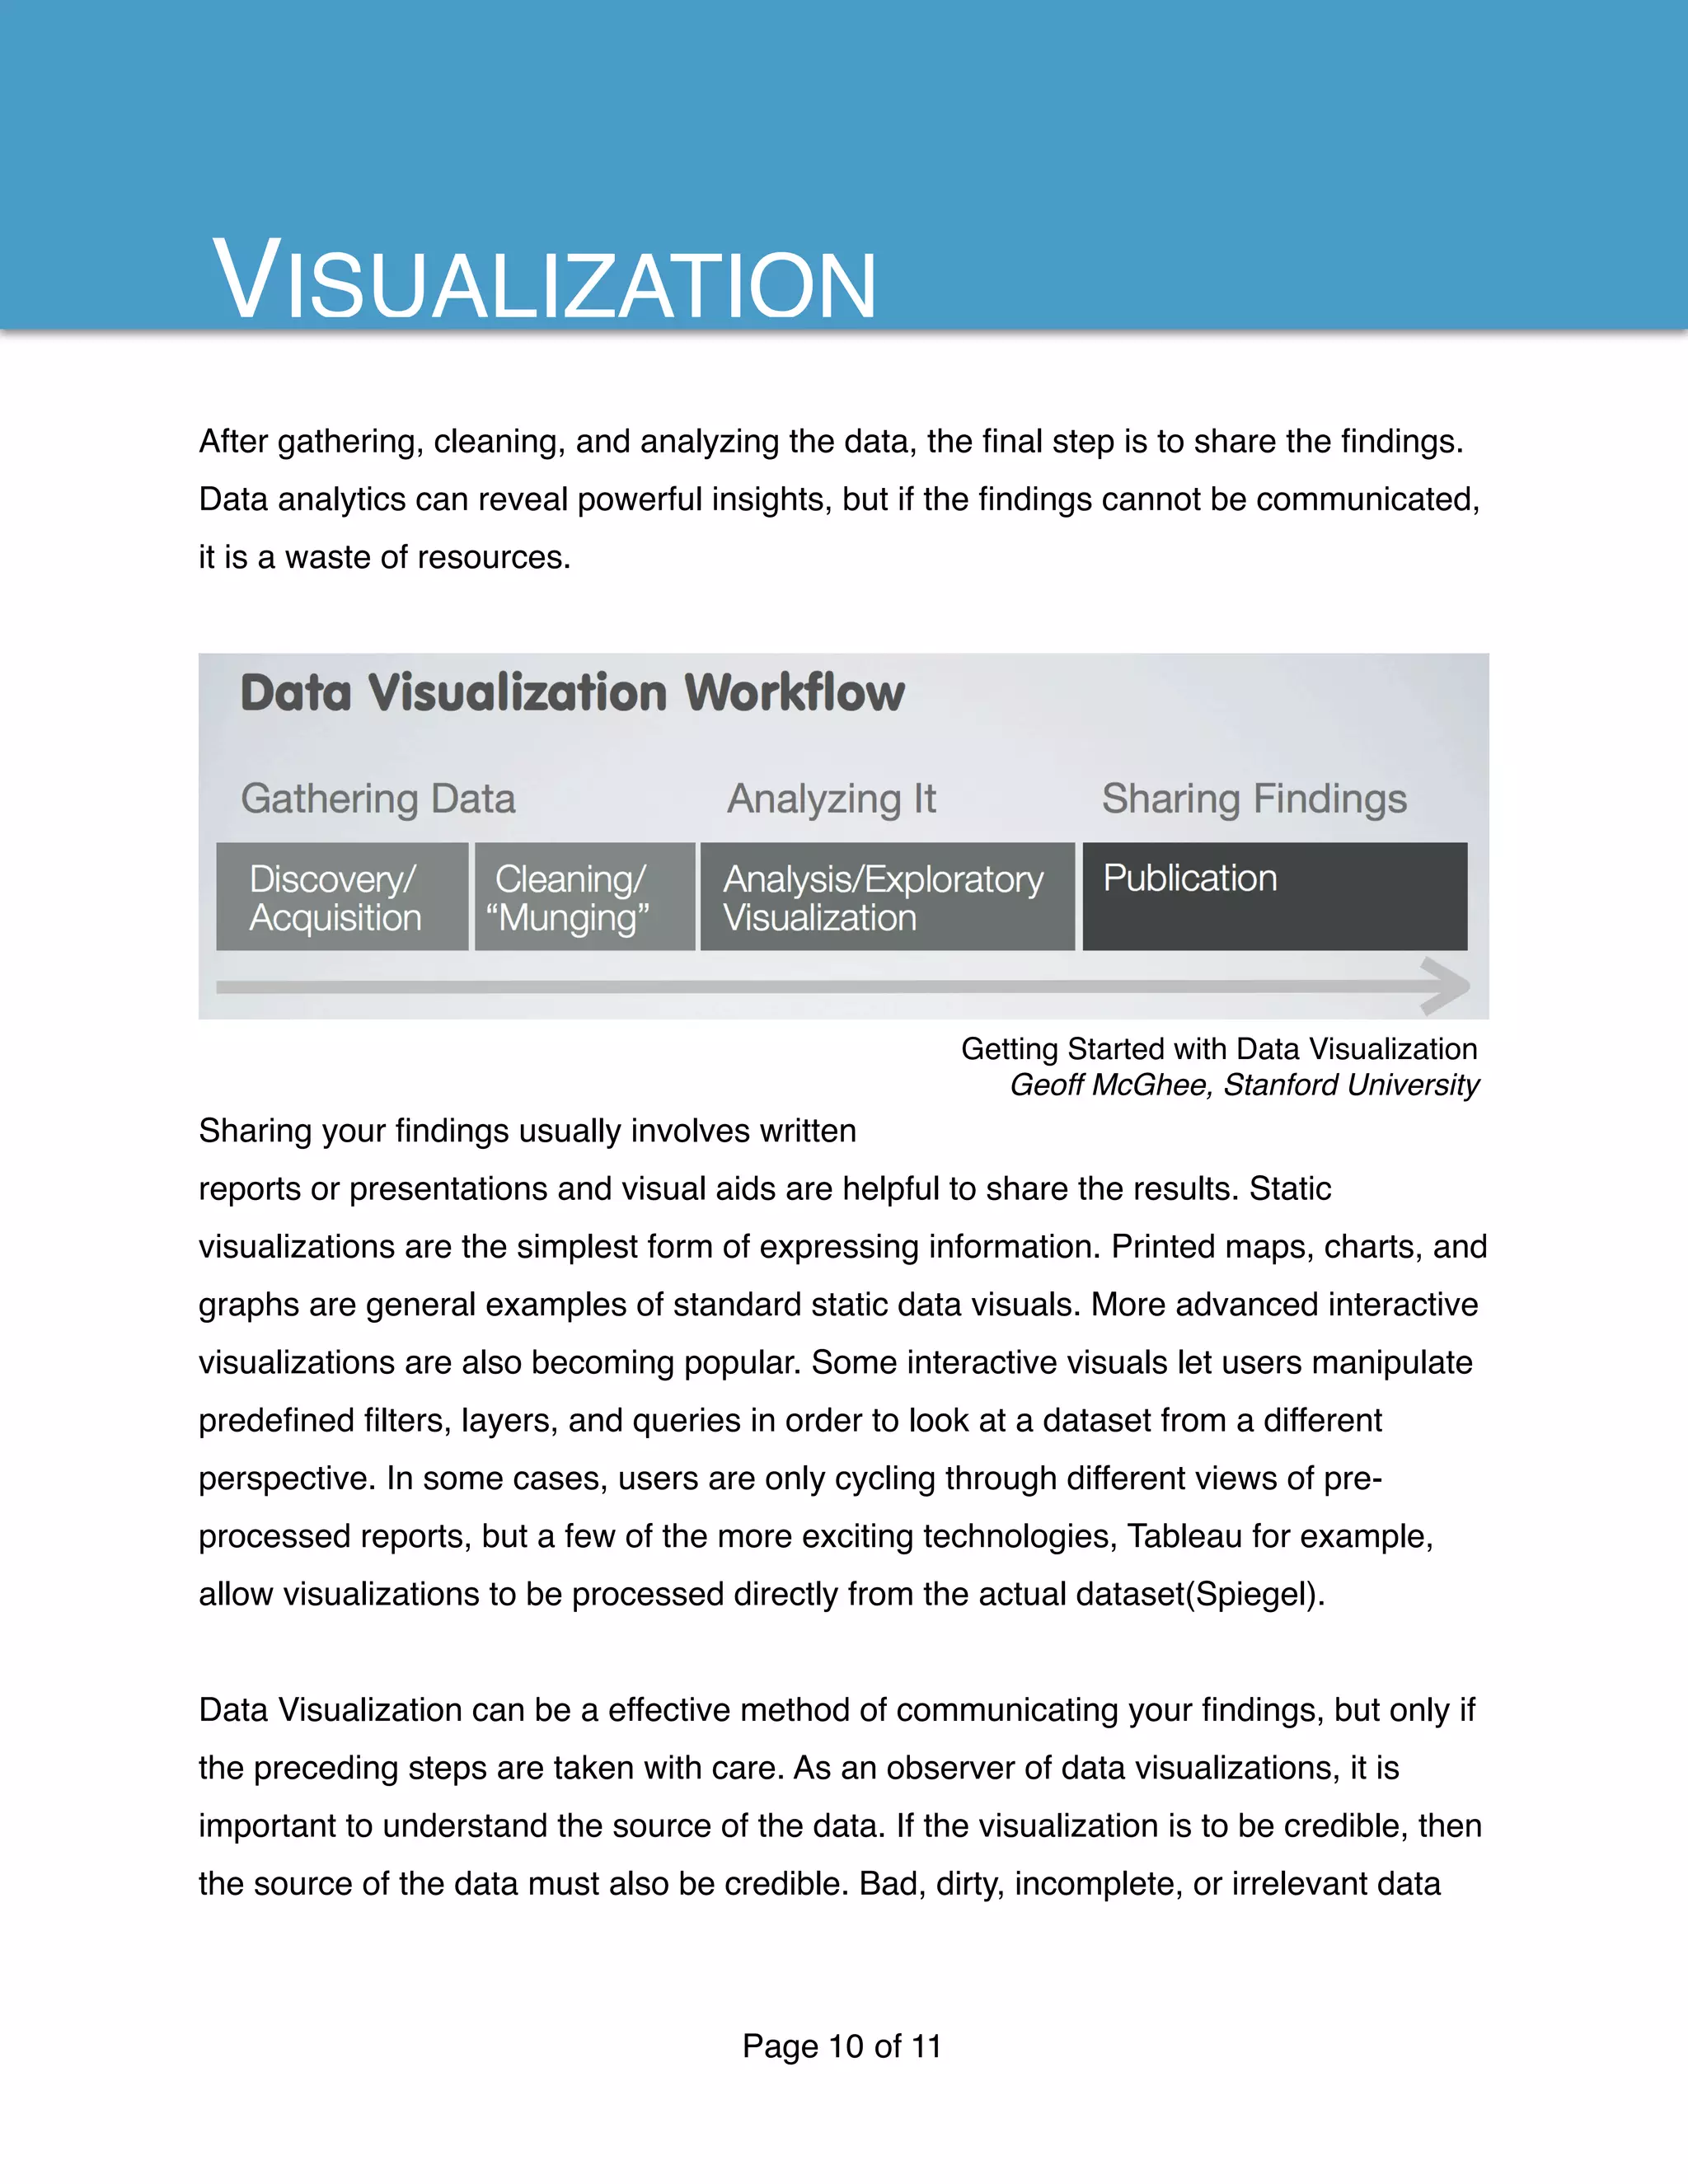
This document discusses business analytics and intelligence. It covers topics such as big data, structured vs unstructured data, databases, infrastructure, analytics evolution, and data visualization. Big data provides value when data sets are massive, though it can be expensive to store and process. Combining structured and unstructured data enables predictive analytics. NoSQL databases were developed to handle diverse data types at large scales. Cloud infrastructure provides benefits like streamlined IT management and widespread access to business intelligence across an organization. Analytics are evolving from internal data analysis to integrating diverse external data sources and building products using predictive insights. Data visualization is an important way to communicate findings from analytics, though the quality of the underlying data impacts the credibility of any visualizations.
We’re in the difficult middle years of the information age, where a nexus of factors like cheap storage, rich HD media, ubiquitous connectivity and more sophisticated SaaS products are generating more data than we can affordably store or meaningfully process.
BRIDGING DATA SILOS USING BIG DATA INTEGRATIONijmnct
With cloud computing, cheap storage and technology advancements, an enterprise uses multiple
applications to operate business functions. Applications are not limited to just transactions, customer
service, sales, finance but they also include security, application logs, marketing, engineering, operations,
HR and many more. Each business vertical uses multiple applications which generate a huge amount of
data. On top of that, social media, IoT sensors, SaaS solutions, and mobile applications record exponential
growth in data volume. In almost all enterprises, data silos exist through these applications. These
applications can produce structured, semi-structured, or unstructured data at different velocity and in
different volume. Having all data sources integrated and generating timely insights helps in overall
decision making. With recent development in Big Data Integration, data silos can be managed better and it
can generate tremendous value for enterprises. Big data integration offers flexibility, speed and scalability
for integrating large data sources. It also offers tools to generate analytical insights which can help
stakeholders to make effective decisions. This paper presents the overview on data silos, challenges with
data silos and how big data integration can help to stun them.
Data is not consistent, sometimes searches or general interest in certain topics, say social media or other types of data experienced peaks and valleys. Data analysis techniques allow the data scientist to mine this type of unstable data and still draw meaningful conclusions from it.
Big Data, NoSQL, NewSQL & The Future of Data ManagementTony Bain
It is an exciting and interesting time to be involved in data. More change of influence has occurred in the database management in the last 18 months than has occurred in the last 18 years. New technologies such as NoSQL & Hadoop and radical redesigns of existing technologies, like NewSQL , will change dramatically how we manage data moving forward.
These technologies bring with them possibilities both in terms of the scale of data retained but also in how this data can be utilized as an information asset. The ability to leverage Big Data to drive deep insights will become a key competitive advantage for many organisations in the future.
Join Tony Bain as he takes us through both the high level drivers for the changes in technology, how these are relevant to the enterprise and an overview of the possibilities a Big Data strategy can start to unlock.
Enabling Big Data with Data-Level Security:The Cloud Analytics Reference Arch...Booz Allen Hamilton
; Booz Allen’s data lake approach enables agencies to embed security controls within each individual piece of data to reinforce existing layers of security and dramatically reduce risk. Government agencies – including military and intelligence agencies – are using this proven security approach to secure data and fully capitalize on the promise of big data and the cloud.
Booz Allen’s data lake approach enables agencies to embed security controls within each individual piece of data to reinforce existing layers of security and dramatically reduce risk. Government agencies – including military and intelligence agencies – are using this proven security approach to secure data and fully capitalize on the promise of big data and the cloud.
Shifting Risks and IT Complexities Create Demands for New Enterprise Security...Booz Allen Hamilton
Holistic Cyber Risk Management Programs in the Financial Industry Must "Predict and Prevent" in Today's Complex Threat Environment, says new White Paper.
Big Data 101 - Creating Real Value from the Data Lifecycle - Happiest Mindshappiestmindstech
The big impact of Big Data in the post-modern world is
unquestionable, un-ignorable and unstoppable today.
While there are certain discussions around Big Data being
really big, here to stay or just an over hyped fad; there are
facts as shared in the following sections of this whitepaper
that validate one thing - there is no knowing of the limits
and dimensions that data in the digital world can assume.
Advanced Analytics and Machine Learning with Data VirtualizationDenodo
Watch full webinar here: https://bit.ly/3aXysas
Advanced data science techniques, like machine learning, have proven to be extremely useful to derive valuable insights from your data. Data Science platforms have become more approachable and user friendly. With all the advancements in the technology space, the Data Scientist is still spending most of the time massaging and manipulating the data into a usable data asset. How can we empower the data scientist? How can we make data more accessible, and foster a data sharing culture?
Join us, and we will show you how Data Virtualization can do just that, with an agile and AI/ML laced data management platform. It can empower your organization, foster a data sharing culture, and simplify the life of the data scientist.
Watch this webinar to learn:
- How data virtualization simplifies the life of the data scientist, by overcoming data access and manipulation hurdles.
- How integrated Denodo Data Science notebook provides for a unified environment
- How Denodo uses AI/ML internally to drive the value of the data and expose insights
- How customers have used Data Virtualization in their Data Science initiatives.
This Document Includes lecture/workshop notes for BIG DATA SCIENCE workshop at NTI 6-7th of Dec 2017
Hint: 1:This is an Initial Version, and it will be updated.
2: Telecommunication/5G parts were not covered through the workshop, although, I will add a comprehensive analysis regarding mentioned cases.
If anyone is interesting in working practically (HANDS ON) mentioned case study, just drop me an e-mail: m.rahm7n@gmail.com
Big Data Trends - WorldFuture 2015 ConferenceDavid Feinleib
David Feinleib's Big Data Trends presentation from the World Future Society's Annual Conference, WorldFuture 2015, held at the Hilton Union Square, San Francisco, California July 25, 2015.
Most data integration software was built to run data through ETL servers. It worked well at the time for several reasons: there wasn’t that much data—1TB was considered a large amount of data at the time; most data was structured, and the turnaround time for that data was monthly. Even back then, daily loads became a problem for most companies. Because of the limitations of the early tools, much of the work was hand-coded, without documentation, and no central management.
Python's Role in the Future of Data AnalysisPeter Wang
Why is "big data" a challenge, and what roles do high-level languages like Python have to play in this space?
The video of this talk is at: https://vimeo.com/79826022
An Comprehensive Study of Big Data Environment and its Challenges.ijceronline
Big Data is a data analysis methodology enabled by recent advances in technologies and Architecture. Big data is a massive volume of both structured and unstructured data, which is so large that it's difficult to process with traditional database and software techniques. This paper provides insight to Big data and discusses its nature, definition that include such features as Volume, Velocity, and Variety .This paper also provides insight to source of big data generation, tools available for processing large volume of variety of data, applications of big data and challenges involved in handling big data
Solving The Data Growth Crisis: Solix Big Data SuiteLindaWatson19
Today’s Chief Information Officer operates in a perfect storm of data growth. Left unchecked data growth negatively impacts application performance, compliance goals and IT costs. Yet, this very same data is the lifeblood of today’s organizations. .
Top 10 guidelines for deploying modern data architecture for the data driven ...LindaWatson19
Enterprises are facing a new revolution, powered by the rapid adoption of data analytics with modern technologies like machine learning and artificial intelligence (A).
Week 4 Lecture 1 - Databases and Data WarehousesManagement of .docxjessiehampson
Week 4 Lecture 1 - Databases and Data Warehouses
Management of Information Systems
Databases and Data Warehouses
The impact of database technology on how business is conducted today cannot be overemphasized. This technology has enabled an information industry with comprehensive influences on businesses and individuals. Databases store data that populate web pages and other interactive networked technologies. Search engines, e-commerce, and social media would not exist without databases. With database support, larger tasks can be accomplished by fewer people.
Effective data management is the principal benefit of IT. Database management systems (DBMSs) enable the fast creation of databases and manipulation of data on an aggregate basis or down to the smallest detail for business purposes. Databases support most web pages and other interactive networked technology. DBMSs support target marketing, financial management, decision-making, distribution of goods and services, customer service, and other activities. It is imperative, in the age of data mining, and “big data,” for knowledge workers to understand how databases work and how data are used operationally and strategically in business management.
Database analysis and management skills are mandatory in the marketplace. IT professionals develop and implement databases. However, data is essential to the non-technical professional who uses the data for decision making regarding accounting, marketing, logistics, senior management, and other functional areas.
The relational database model is common. However, data can be organized in other ways. “Big Data” prompted the use of other database models. “NoSQL” database models are non-relational and do not require SQL to retrieve data. NoSQL databases can be structured by object, document, key-value, graph, column, and other possibilities
In relational databases, a primary key is a field in a table that contains a unique value used to differentiate between rows of data. The primary key is usually a number, or a computer generated globally unique identifier (GUID). Sometimes a composite key is used differentiate between table rows. A composite key is a combination of the values in two or more fields in a table that when combined are unique in the table and serve as a primary key. A foreign key is used to link data between two tables. A foreign key in a table is the primary key of a related table.
Databases contain different types of fields. Some types are, number, text, image, video, audio, geographical coordinates, and others. If a number is not used for mathematical calculations, it is best to assign a text type to it in a database to avoid the need to convert it from a number to a string after retrieval.
SQL is a popular query language used to retrieve data from relational databases. SQL can be used to retrieve data from more than one table by use of a “join.” A join query retrieves data from rows in two or more tables, where the value of the foreign ...
Global Data Management: Governance, Security and Usefulness in a Hybrid WorldNeil Raden
With Global Data Management methodology and tools, all of your data can be accessed and used no matter where it is or where it is from: on-premises, private cloud, public cloud(s), hybrid cloud, open source, third-party data and any combination of the these, with security, privacy and governance applied as if they were a single entity. Ingenious software products and the economics of computing make it economical to do this. Not free, but feasible.
1.
Page of1 11
USINESS
NALYTICS
LUKE CARATAN
DECEMBER 6TH, 2015
BUSINESS ANALYTICS AND
INTELLIGENCE
FALL TRIMESTER 2015 - SESSION B
ISTM 660.25FL
BOB MCQUAID
2. Data leveraged decision making is not a novel idea. Throughout history, competent
people have been using whatever information is available and relevant in order to make
better decisions. Classically speaking, more information means better decisions, and
thus the idea of Big Data was born. This ideology held true until very recently when
advances in data gathering and storage technologies outpaced developments in
processing capabilities. This and other bottlenecks have forced professionals to
reevaluate how to interact with data.
Josh Wills, Senior Director of Data Science at Cloudera, explains that one or two or
even thousands of data points may not be very useful from a business analytics
perspective, but that the value in Big Data is only retrievable when the data set is
massive(Cloudera). Massive data sets can be expensive to store, difficult to process
and, if handled incorrectly, troublesome to learn from. As Data Science professionals
constantly evolve their methods of data collection and management, companies get the
benefit of richer, more relevant information.
Many companies have been collecting structured data for decades.
Structured data alone can be directly analyzed, but will only provide
one or two dimensional trend analysis. Combining structured and
unstructured data creates the opportunity for automated reasoning,
and eventually predictive analytics(Andriole).
The fastest growing form of big data is unstructured data. Unstructured implies that the
the data is not intrinsically quantitative. This type of data can be highly contextual and
requires more advanced processing than simple statistical analysis. Almost 80% of
newly created data is unstructured(Cloudera). The table below lists some everyday
examples of this type of data.
Page of2 11
DATA
Structured Data
Sales History
Demographics
Quantitative
Surveys
Financial Data
3. The size and richness of these combined data sets makes it
challenging to process. Filtering for temporal relevancy can help
hone in on what really matters within the data. According to a
recent report from job listing startup, Textio, “Big Data” may not be
the hot topic it once was. Over the past year, job listings have
been transitioning to a new term: “Real Time Data”(Bass).
In today’s mobile world things happen fast. Social media can take ideas viral in mere
minutes. Data scientists realize that the “latest information is more important than
having a lot of information(Bass).” As the data sector continues to develop, methods for
capturing the right data at the right time will be top of mind. These new practices will
provide faster conclusions to more complex business problems. After all, decision
makers are not necessarily interested in the data itself, but the secrets trapped inside.
Page of3 11
Unstructured Data
Social Media: Tweets,
blogs, Facebook posts
Call Center Notes
Emails, Chat History
Images, Video
Open-ended Surveys
Sources:
Andriole, Steve. "Unstructured Data: The Other Side of Analytics." Forbes. Forbes Magazine, 5 Mar. 2015.
Web. 06 Dec. 2015.
Bass, Dina. "Top 10 Rising and Falling Buzzwords in Tech Job Postings.” Bloomberg.com. Bloomberg, 3
Nov. 2015. Web. 06 Dec. 2015.
Cloudera: Training A New Generation Of Data Scientists. Dir. Josh Wills. Cloudera. N.p., 3 Sept. 2013.
Web. 06 Dec. 2015.
Page of3 11
4. The average person will store information on a computer using the built-in folder —> file
system. For typical computer use, this system will fit well and take care of all the needs
of the user. However when it comes to business analytics, the requirements are much
higher. Data sets are much larger, and can contain many different types of data. The
sheer size of the data sets and the diversity of information types calls for a more
sophisticated data management system. Businesses need databases.
Maxim Levkov summed it up by saying that “databases provide a systematic way to
access, process, and correlate data that can be stored for further use.” Databases
enable sets of information to be organized and effectively accessed. There are many
different types of databases for the many different types of data.
Relational databases recognize relationships
among stored pieces of information(McNutt).
Before the days of big data, this used to be the
most common from of database. Its speed and
reliability come from its clearly defined structure.
Data relationships are built across tables by
matching fields within rows. Users interact with
the data through Standard Query Language,
SQL.
Today’s information demands a more dynamic and flexible platform. To overcome the
limitations of strictly defined scheme-style data management, “Not-only SQL” (NoSQL)
databases have been developed. These databases can handle diverse types of data,
and opposed to Relational, NoSQL databases are built to scale(Moniruzzaman).
Page of4 11
“Databases provide
a systematic way to
access, process,
and correlate data
that can be stored
for further use.”
-Maxim Levkov,
Pepperdine FEMBA
DATABASES
5. The market has developed 5 major classes of NoSQL databases. Each one with its
particular strengths and weaknesses outlined in the chart below:
Even with advances in database architecture, relational databases have not been
completely replaced. In most cases, optimal data management will require some
combination of both the old and newer technologies.
Main Structure Strengths Weaknesses Examples
Column
Families
columns and
groups of columns
machine generated/
structured data;
limited query
capability
Apache Hadoop
Document stores document
rather than data
unstructured/semi
structured data
relatively slower
processing
Monogo DB;
Couch DB;
Graph diagram of data
relationships
web applications;
social networking
approximations in
analytics
Neo4J;
Horton;
Key-Value database key simple and easy
development
no inherent data
relationships
Rick;
Redis;
XML XML nontraditional data;
audio/video
strict data
structure
Mark Logic;
Sedna;
Page of5 11
Sources:
Brown, Meta S. "Next-Generation Databases Take On Big Data Management Challenges."
Forbes. Forbes Magazine, 30 June 2015. Web. 06 Dec. 2015.
Kumar, Girish. "Exploring the Different Types of NoSQL Databases Part Ii." 3Pillar Global.
N.p., 07 Oct. 2013. Web. 06 Dec. 2015.
McNutt, Louise-Anne. "Relational Database." Encyclopedia of Epidemiology. By Sarah
Boslaugh. Los Angeles: Sage Publications, 2008. 908-11. Web.
Moniruzzaman, A B M, and Syed Akhter Hossain. "NoSQL Database: New Era of Databases
for Big Data Analytics - Classification, Characteristics and Comparison." (n.d.): n. pag.
International Journal of Database Theory and Application. Web. 6 Dec. 2015.
Sources: Aggregated from Brown, Kumar, and Moniruzzaman
Page of5 11
6. Infrastructure as it relates to business intelligence is another area that is in transition.
Historically, infrastructure was maintained with physical hardware on-site and in-house.
Small companies would either employ someone to manage IT or outsource the duties.
Large companies would have silo’d IT departments that controlled access and protected
company data. When the idea of business intelligence began to develop as a
management tool, IT departments were expanded and given the responsibility of
business analytics.
The new trends in infrastructure break through the silos and head to the cloud.
Software, Infrastructure, and Platform As A Service offerings allow businesses to access
the most up to date technologies at minimal cost. Companies no longer have to deal
with building and maintaining their own data centers(Gorelik).
Enterprise wide access to information leads to streamlined IT management and the
spreading of business analysts throughout the organization. The graphic below outlines
a possible workflow from the end user all the way up the chain to the
developer(Gilliland).
At the top of the chain is the Developer. They are responsible for getting the business
Page of6 11
INFRASTRUCTURE
7. systems working together. Business have data, and they need the proper infrastructure
in place to tie the different data sources together. Once the developer makes the data
container available, Business Analysts can begin working with reporting tools. This chart
lists all examples as “custom” but there are many standard reporting platforms available
as well(Baars).
Last in the line are the End Users. End users experience the final product of the
business intelligence tools. The dashboards and other interactive visualizations deliver
insights that pull data from the different business units. This company-wide distillation of
information is only possible due to the purposeful integration of the networked data
system. Without cloud infrastructure, this rich level of business intelligence would not be
possible.
Cloud infrastructure is not a requirement, but it does provide many benefits. At a
minimum, cloud infrastructure encourages open information across business units
within organizations and facilitates the rapid dissemination of business intelligence.
Page of7 11
Sources:
Baars, Henning, and Hans-George Kemper. "Management Support with Structured and
Unstructured Data-An Integrated Business Intelligence Framework." Taylor & Francis.
Information Systems Management, 7 Apr. 2008. Web. 06 Dec. 2015.
Gilliland, Dan. "NetSuite SuiteCloud Platform Overview.” NetSuite. N.p., 28 July 2015. Web. 6
Dec. 2015.
Gorelik, Eugene. "Cloud Computing Models." Cloud Computing (2013): n. pag. MIT.
Massachusetts Institute of Technology, Jan. 2013. Web. 6 Dec. 2015.
Zachman, John A. "Cloud Computing and Enterprise Architecture By: John A. Zachman."
Zachman International. N.p., 2011. Web. 06 Dec. 2015.
Page of7 11
8. Analytics are evolving. As computers became commonplace in the corporate world,
companies could more easily store business data. The first stage of analytics was
explored by companies that collected their own transaction data(Davenport). Some
savvy companies would even cross reference their internal data and look for ways to
improve efficiencies. This model carried on until computing power grew and eventually
data pioneers began looking outside the company for more data feeds. This second
stage of analytics quickly grew to include many diverse data types and
sources(Davenport). Data sets exploded in size and companies struggled to develop
the technologies needed to process and store these incredible amounts of information.
Today, agile companies are moving into the 3rd stage of Davenport’s model. Companies
are leveraging their data to build better products. During the first wave of innovation,
companies have started to integrate multiple types of structured and unstructured data
from internal and external sources(Davenport). These intertwining “super sets” can
deliver completely new predictive and prescriptive insights.
The volume of data generated and recorded is growing at an exponential rate. As
companies learn about new data relationships, they should start integrating analytics
directly into their business processes(Davenport). These automated events will improve
speed of delivery and therefore increase the impact of the derived insights.
These data initiatives need support from above if they are to stay on track. Adding the
role of Chief Analytics Officer to the C Suite will give the required oversight. On the
ground, cross disciplinary teams are key. Seemingly disparate data sources need to
understood and conjoined to continue developing successes. Multi-disciplinary skills will
be invaluable on these data teams(Davenport).
Page of8 11
ANALYTICS
9. Traditional data warehouses are losing popularity compared to new, more agile data
constructs. Companies need capable platforms that facilitate the transfer of data
sources in and out of the system.
The new age of data is all about prescriptive analytics. Key internal business processes
and external customer interactions should have analytics embedded as much as
possible. This recipe for advancement will enable companies to make better predictions
about customer needs, improve customer service, and eliminate pain points(5 ways).
Humans can still think faster than computers can process, but data intensive predictive
analytics can help augment human beings to better understand and solve problems
faster.
Page of9 11
Sources:
"5 Ways Companies Are Using Big Data to Help Their Customers." VentureBeat. IDA
Singapore, 21 Apr. 2014. Web. 06 Dec. 2015.
Davenport, Thomas H. "Analytics 3.0." Harvard Business Review. N.p., Dec. 2013. Web. 06
Dec. 2015.
Page of9 11
10. After gathering, cleaning, and analyzing the data, the final step is to share the findings.
Data analytics can reveal powerful insights, but if the findings cannot be communicated,
it is a waste of resources.
Sharing your findings usually involves written
reports or presentations and visual aids are helpful to share the results. Static
visualizations are the simplest form of expressing information. Printed maps, charts, and
graphs are general examples of standard static data visuals. More advanced interactive
visualizations are also becoming popular. Some interactive visuals let users manipulate
predefined filters, layers, and queries in order to look at a dataset from a different
perspective. In some cases, users are only cycling through different views of pre-
processed reports, but a few of the more exciting technologies, Tableau for example,
allow visualizations to be processed directly from the actual dataset(Spiegel).
Data Visualization can be a effective method of communicating your findings, but only if
the preceding steps are taken with care. As an observer of data visualizations, it is
important to understand the source of the data. If the visualization is to be credible, then
the source of the data must also be credible. Bad, dirty, incomplete, or irrelevant data
Page of10 11
VISUALIZATION
Getting Started with Data Visualization
Geoff McGhee, Stanford University
11. can undermine the quality of a visualization, and as viewers of the final product, it is
difficult to know the quality behind any publication.
Crafting meaningful visualizations can be a challenge. Nancy Duarte at The Harvard
Business Review offers the following key points to consider:
1. Am I presenting or circulating my data?
• Presentation visuals need to be succinct. Use simple lines and contrasting colors
to prove the point. Have the back up data tables ready if questioned, but do not
include them on the slides.
• When circulating information provide more detail. Readers can use as much time
as they like to digest the information.
2. Am I using the right kind of chart or table?
• Be sure the visualization (chart) projects the relationship you are purporting.
3. What message am I trying to convey?
• Use this question to identify and highlight the most important parts of the
visualization.
4. Do my visuals accurately reflect the numbers?
• Formatting can be fun and pretty, but also distracting. Remember that the value of
the visualization is in the point it proves, not how advanced the chart appears.
5. Are my data memorable?
• Visualization doesn’t mean “use a chart.” Be sure to use visuals that are striking.
The more memorable the visualization, the more effective it will be at
communicating the idea.
Page of11 11
Sources:
Duarte, Nancy. "The Quick and Dirty on Data Visualization." Harvard Business Review. N.p.,
16 Apr. 2014. Web. 06 Dec. 2015.
McGhee, Geoff. "Getting Started With Data Visualization." Stanford University. The Bill Lane
Center for the American West, 5 May 2011. Web. 6 Dec. 2015.
Spiegel, Benjamin. "Analytics: A Beginner's Guide To Data Visualization." Marketing Land.
N.p., 18 Dec. 2013. Web. 06 Dec. 2015.
Page of11 11