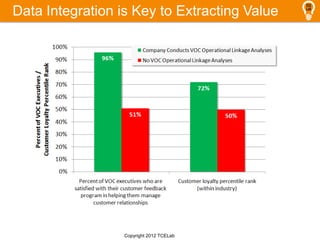
How may we help?
info@tcelab.com
Spring 2012
Using Big Data to Improve
Customer Loyalty
Bob E. Hayes, PhD
Overview
1. Big Data
2. Analytics
3. Data Integration
4. Customer Loyalty
5. Customer Experience Management
6. Linkage Analysis
7. Implications
Copyright 2012 TCELab
Big Interest in Big Data: Google Trends
0
1
2
3
4
5
6 Jan2006
March2006
May2006
July2006
Sept2006
Nov2006
Jan2007
March2007
May2007
July2007
Sept2007
Nov2007
Jan2008
March2008
May2008
July2008
Sept2008
Nov2008
Jan2009
March2009
May2009
July2009
Sept2009
Nov2009
Jan2010
March2010
May2010
July2010
Sept2010
Nov2010
Jan2011
March2011
May2011
July2011
Sept2011
Nov2011
Jan2012
March2012
SearchVolumeIndex
Customer Experience
Big Data
Scale is based on the average worldwide traffic of customer experience in all years.
Copyright 2012 TCELab
Big Data
• Big Data refers to the tools and
processes of managing and utilizing
large datasets.
• An amalgamation of different areas that
help us try to get a handle on, insight from
and use out of data
Copyright 2012 TCELab
Three Vs of Big Data
• Volume – amount of data is massive
• Velocity – speed at which data are
being generated is very fast
• Variety – different types of data like
structured and unstructured
Copyright 2012 TCELab
Disparate Sources of Business Data
1.Call handling time
2.Number of calls until
resolution
3.Response time
1.Revenue
2.Number of products
purchased
3.Customer tenure
4.Service contract
renewal
5.Number of sales
transactions
6.Frequency of
purchases
1.Customer Loyalty
2.Relationship
satisfaction
3.Transaction satisfaction
1.Employee Loyalty
2.Satisfaction with
business areas
Operational
Partner Feedback
1.Partner Loyalty
2.Satisfaction with
partnering relationship
Customer
Feedback
Employee
Feedback
Financial
Copyright 2012 TCELab
Value from Analytics: MIT / IBM 2010 Study
Top-performing
organizations
use analytics five
times more than
lower performers
Copyright 2012 TCELab
http://sloanreview.mit.edu/the-magazine/2011-
winter/52205/big-data-analytics-and-the-path-from-
insights-to-value/
Number one obstacle to
the adoption of analytics
in their organizations was
a lack of understanding
of how to use analytics to
improve the business
Three Big Data Approaches
1. Interactive Exploration - good
for discovering real-time patterns from your
data as they emerge
2. Direct Batch Reporting - good
for summarizing data into pre-built,
scheduled (e.g., daily, weekly) reports
3. Batch ETL (extract-transform-load) -
good for analyzing historical trends or
linking disparate data
Copyright 2012 TCELab
Data Integration is Key to Extracting Value
Copyright 2012 TCELab
CEM and Customer Loyalty
• Customer loyalty is key to business
growth
• The process of understanding and
managing your customers’ interactions
with and perceptions of your brand /
company
Copyright 2012 TCELab
Linkage Analysis
• Linkage analysis answers the questions:
– What is the $ value of improving customer
satisfaction/loyalty?
– Which operational metrics have the biggest impact on
customer satisfaction/loyalty?
– Which employee/partner factors have the biggest impact on
customer satisfaction/loyalty?
Operational
Metrics
Transactional
Satisfaction
Relationship
Satisfaction/
Loyalty
Financial
Business
Metrics
Constituency
Satisfaction/
Loyalty
Copyright 2012 TCELab
Customer Feedback Data Sources
Relationship
(satisfaction/loyalty to company)
Transaction
(satisfaction with specific
transaction/interaction)
BusinessDataSources
Financial
(revenue, number of
sales)
•Link data at customer level
•Quality of the relationship (sat,
loyalty) impacts financial metrics
N/A
Operational
(call handling, response
time)
N/A
•Link data at transaction level
•Operational metrics impact
quality of the transaction
Constituency
(employee / partner
feedback)
•Link data at constituency level
•Constituency satisfaction impacts
customer satisfaction with overall
relationship
•Link data at constituency level
•Constituency satisfaction
impacts customer satisfaction
with interaction
Integrating your Business Data
Copyright 2012 TCELab
Financial Metrics / Real Loyalty Behaviors
• Linkage analysis helps us determine if our
customer feedback metrics predict real and
measurable business outcomes
• Retention
– Customer tenure
– Customer defection rate
– Service contract renewal
• Advocacy
– Number of new customers
– Revenue
• Purchasing
• Number of products
purchased
• Number of sales
transactions
• Frequency of purchases
Relationship
Satisfaction/
Loyalty
Financial
Business
Metrics
VoC / Financial Linkage
Customer
(Account) 1
Customer
(Account) 2
Customer
(Account) 3
Customer
(Account) 4
Customer
(Account) n
Customer Feedback
for a specific
customer (account)
Financial Metric
for a specific
customer (account)
x1
x3
x2
xn
x4
y1
y3
y2
yn
y4
yn represents the financial metric for customer n.
xn represents customer feedback for customer n.
.
.
.
.
.
.
.
.
.
Copyright 2012 TCELab
ROI of Customer Loyalty
Disloyal (0-5) Loyal ( 6-8) Very Loyal (9-10)
PercentPurchasing
AdditionalSoftware
Customer Loyalty
55%
increase
Copyright 2012 TCELab
Operational Metrics
• Linkage analysis helps us determine/identify the
operational factors that influence customer
satisfaction/loyalty
• Support Metrics
– First Call Resolution (FCR)
– Number of calls until resolution
– Call handling time
– Response time
– Abandon rate
– Average talk time
– Adherence & Shrinkage
– Average speed of answer (ASA)
Copyright 2012 TCELab
Operational
Metrics
Transactional
Satisfaction
Operational / VoC Linkage
Customer 1
Interaction
Customer 2
Interaction
Customer 3
Interaction
Customer 4
Interaction
Customer n
Interaction
Operational Metric
for a specific
customer’s interaction
Customer Feedback
for a specific
customer’s interaction
x1
x3
x2
xn
x4
y1
y3
y2
yn
y4
yn represents the customer feedback for customer interaction n.
xn represents the operational metric for customer interaction n.
.
.
.
.
.
.
.
.
.
Copyright 2012 TCELab
Identify Operational Drivers
Copyright 2012 TCELab
Identify Operational Standards
1 call 2-3 calls 4-5 calls 6-7 calls 8 or more calls
SatwithSR
Number of Calls to Resolve SR
1 change 2 changes 3 changes 4 changes 5+ changes
SatwithSR
Number of SR Ownership Changes
Copyright 2012 TCELab
Constituency Metrics
• Linkage analysis helps us understand how
constituency variables impact customer
satisfaction/loyalty
• Satisfaction Metrics
– Employee satisfaction with
business areas
– Partner satisfaction with
partner relationship
• Loyalty Metrics
– Employee/Partner loyalty
Employee
Metrics
Customer
Satisfaction/
Loyalty
Partner
Metrics
• Other Metrics
• Employee training metrics
• Partner certification status
Copyright 2012 TCELab
Constituency / VoC Linkage
Employee 1
Employee 2
Employee 3
Employee 4
Employee n
Employee
Satisfaction
with the Company
Customer
Satisfaction / Loyalty
x1
x3
x2
xn
x4
y1
y3
y2
yn
y4
.
.
.
.
.
.
.
.
.
yn represents average customer satisfaction scores across survey respondents for Employee n.
_xn represents employee satisfaction score for Employee n.
1 Analysis typically conducted for B2B customers where a given employee (sales representative, technical
account manager, sales manager) is associated with a given customer (account)
_
_
_
_
_
Copyright 2012 TCELab
Identify Employee Drivers
Copyright 2012 TCELab
Validate Training Standards
Copyright 2012 TCELab
Implications
• Ask and answer bigger questions about
your customers
– Explore all business data to understand their
impact on customer experience / loyalty
• Build your company around your
customers
– Greenplum social network platform
– Cross-functional teams working together to
solve customer problems
• Use objective, “real,” loyalty metrics
Copyright 2012 TCELab
How may we help?
info@tcelab.com
Spring 2012
Using Big Data to Improve
Customer Loyalty
Bob E. Hayes, PhD
bob@tcelab.com
@bobehayes
businessoverbroadway.com/blog

Big Data has Big Implications for Customer Experience Management

  • 1.
    How may wehelp? info@tcelab.com Spring 2012 Using Big Data to Improve Customer Loyalty Bob E. Hayes, PhD
  • 2.
    Overview 1. Big Data 2.Analytics 3. Data Integration 4. Customer Loyalty 5. Customer Experience Management 6. Linkage Analysis 7. Implications Copyright 2012 TCELab
  • 3.
    Big Interest inBig Data: Google Trends 0 1 2 3 4 5 6 Jan2006 March2006 May2006 July2006 Sept2006 Nov2006 Jan2007 March2007 May2007 July2007 Sept2007 Nov2007 Jan2008 March2008 May2008 July2008 Sept2008 Nov2008 Jan2009 March2009 May2009 July2009 Sept2009 Nov2009 Jan2010 March2010 May2010 July2010 Sept2010 Nov2010 Jan2011 March2011 May2011 July2011 Sept2011 Nov2011 Jan2012 March2012 SearchVolumeIndex Customer Experience Big Data Scale is based on the average worldwide traffic of customer experience in all years. Copyright 2012 TCELab
  • 4.
    Big Data • BigData refers to the tools and processes of managing and utilizing large datasets. • An amalgamation of different areas that help us try to get a handle on, insight from and use out of data Copyright 2012 TCELab
  • 5.
    Three Vs ofBig Data • Volume – amount of data is massive • Velocity – speed at which data are being generated is very fast • Variety – different types of data like structured and unstructured Copyright 2012 TCELab
  • 6.
    Disparate Sources ofBusiness Data 1.Call handling time 2.Number of calls until resolution 3.Response time 1.Revenue 2.Number of products purchased 3.Customer tenure 4.Service contract renewal 5.Number of sales transactions 6.Frequency of purchases 1.Customer Loyalty 2.Relationship satisfaction 3.Transaction satisfaction 1.Employee Loyalty 2.Satisfaction with business areas Operational Partner Feedback 1.Partner Loyalty 2.Satisfaction with partnering relationship Customer Feedback Employee Feedback Financial Copyright 2012 TCELab
  • 7.
    Value from Analytics:MIT / IBM 2010 Study Top-performing organizations use analytics five times more than lower performers Copyright 2012 TCELab http://sloanreview.mit.edu/the-magazine/2011- winter/52205/big-data-analytics-and-the-path-from- insights-to-value/ Number one obstacle to the adoption of analytics in their organizations was a lack of understanding of how to use analytics to improve the business
  • 8.
    Three Big DataApproaches 1. Interactive Exploration - good for discovering real-time patterns from your data as they emerge 2. Direct Batch Reporting - good for summarizing data into pre-built, scheduled (e.g., daily, weekly) reports 3. Batch ETL (extract-transform-load) - good for analyzing historical trends or linking disparate data Copyright 2012 TCELab
  • 9.
    Data Integration isKey to Extracting Value Copyright 2012 TCELab
  • 10.
    CEM and CustomerLoyalty • Customer loyalty is key to business growth • The process of understanding and managing your customers’ interactions with and perceptions of your brand / company Copyright 2012 TCELab
  • 11.
    Linkage Analysis • Linkageanalysis answers the questions: – What is the $ value of improving customer satisfaction/loyalty? – Which operational metrics have the biggest impact on customer satisfaction/loyalty? – Which employee/partner factors have the biggest impact on customer satisfaction/loyalty? Operational Metrics Transactional Satisfaction Relationship Satisfaction/ Loyalty Financial Business Metrics Constituency Satisfaction/ Loyalty Copyright 2012 TCELab
  • 12.
    Customer Feedback DataSources Relationship (satisfaction/loyalty to company) Transaction (satisfaction with specific transaction/interaction) BusinessDataSources Financial (revenue, number of sales) •Link data at customer level •Quality of the relationship (sat, loyalty) impacts financial metrics N/A Operational (call handling, response time) N/A •Link data at transaction level •Operational metrics impact quality of the transaction Constituency (employee / partner feedback) •Link data at constituency level •Constituency satisfaction impacts customer satisfaction with overall relationship •Link data at constituency level •Constituency satisfaction impacts customer satisfaction with interaction Integrating your Business Data Copyright 2012 TCELab
  • 13.
    Financial Metrics /Real Loyalty Behaviors • Linkage analysis helps us determine if our customer feedback metrics predict real and measurable business outcomes • Retention – Customer tenure – Customer defection rate – Service contract renewal • Advocacy – Number of new customers – Revenue • Purchasing • Number of products purchased • Number of sales transactions • Frequency of purchases Relationship Satisfaction/ Loyalty Financial Business Metrics
  • 14.
    VoC / FinancialLinkage Customer (Account) 1 Customer (Account) 2 Customer (Account) 3 Customer (Account) 4 Customer (Account) n Customer Feedback for a specific customer (account) Financial Metric for a specific customer (account) x1 x3 x2 xn x4 y1 y3 y2 yn y4 yn represents the financial metric for customer n. xn represents customer feedback for customer n. . . . . . . . . . Copyright 2012 TCELab
  • 15.
    ROI of CustomerLoyalty Disloyal (0-5) Loyal ( 6-8) Very Loyal (9-10) PercentPurchasing AdditionalSoftware Customer Loyalty 55% increase Copyright 2012 TCELab
  • 16.
    Operational Metrics • Linkageanalysis helps us determine/identify the operational factors that influence customer satisfaction/loyalty • Support Metrics – First Call Resolution (FCR) – Number of calls until resolution – Call handling time – Response time – Abandon rate – Average talk time – Adherence & Shrinkage – Average speed of answer (ASA) Copyright 2012 TCELab Operational Metrics Transactional Satisfaction
  • 17.
    Operational / VoCLinkage Customer 1 Interaction Customer 2 Interaction Customer 3 Interaction Customer 4 Interaction Customer n Interaction Operational Metric for a specific customer’s interaction Customer Feedback for a specific customer’s interaction x1 x3 x2 xn x4 y1 y3 y2 yn y4 yn represents the customer feedback for customer interaction n. xn represents the operational metric for customer interaction n. . . . . . . . . . Copyright 2012 TCELab
  • 18.
  • 19.
    Identify Operational Standards 1call 2-3 calls 4-5 calls 6-7 calls 8 or more calls SatwithSR Number of Calls to Resolve SR 1 change 2 changes 3 changes 4 changes 5+ changes SatwithSR Number of SR Ownership Changes Copyright 2012 TCELab
  • 20.
    Constituency Metrics • Linkageanalysis helps us understand how constituency variables impact customer satisfaction/loyalty • Satisfaction Metrics – Employee satisfaction with business areas – Partner satisfaction with partner relationship • Loyalty Metrics – Employee/Partner loyalty Employee Metrics Customer Satisfaction/ Loyalty Partner Metrics • Other Metrics • Employee training metrics • Partner certification status Copyright 2012 TCELab
  • 21.
    Constituency / VoCLinkage Employee 1 Employee 2 Employee 3 Employee 4 Employee n Employee Satisfaction with the Company Customer Satisfaction / Loyalty x1 x3 x2 xn x4 y1 y3 y2 yn y4 . . . . . . . . . yn represents average customer satisfaction scores across survey respondents for Employee n. _xn represents employee satisfaction score for Employee n. 1 Analysis typically conducted for B2B customers where a given employee (sales representative, technical account manager, sales manager) is associated with a given customer (account) _ _ _ _ _ Copyright 2012 TCELab
  • 22.
  • 23.
  • 24.
    Implications • Ask andanswer bigger questions about your customers – Explore all business data to understand their impact on customer experience / loyalty • Build your company around your customers – Greenplum social network platform – Cross-functional teams working together to solve customer problems • Use objective, “real,” loyalty metrics Copyright 2012 TCELab
  • 25.
    How may wehelp? info@tcelab.com Spring 2012 Using Big Data to Improve Customer Loyalty Bob E. Hayes, PhD bob@tcelab.com @bobehayes businessoverbroadway.com/blog

Editor's Notes

  • #11 Linkage analysis helps answer important questions that help senior management better manage its business. 1. What is the $ value of improving customer satisfaction/loyalty?2. Which operational metrics have the biggest impact on customer satisfaction/loyalty?3. Which employee/partner factors have the biggest impact on customer satisfaction/loyalty?The bottom line is that linkage analysis helps the company understand the causes and consequences of customer satisfaction and loyalty and thereby helping senior manager better manage its business.Understand the causes and consequences of customer satisfaction/loyalty
  • #12 Linkage analysis helps answer important questions that help senior management better manage its business. 1. What is the $ value of improving customer satisfaction/loyalty?2. Which operational metrics have the biggest impact on customer satisfaction/loyalty?3. Which employee/partner factors have the biggest impact on customer satisfaction/loyalty?The bottom line is that linkage analysis helps the company understand the causes and consequences of customer satisfaction and loyalty and thereby helping senior manager better manage its business.Understand the causes and consequences of customer satisfaction/loyalty