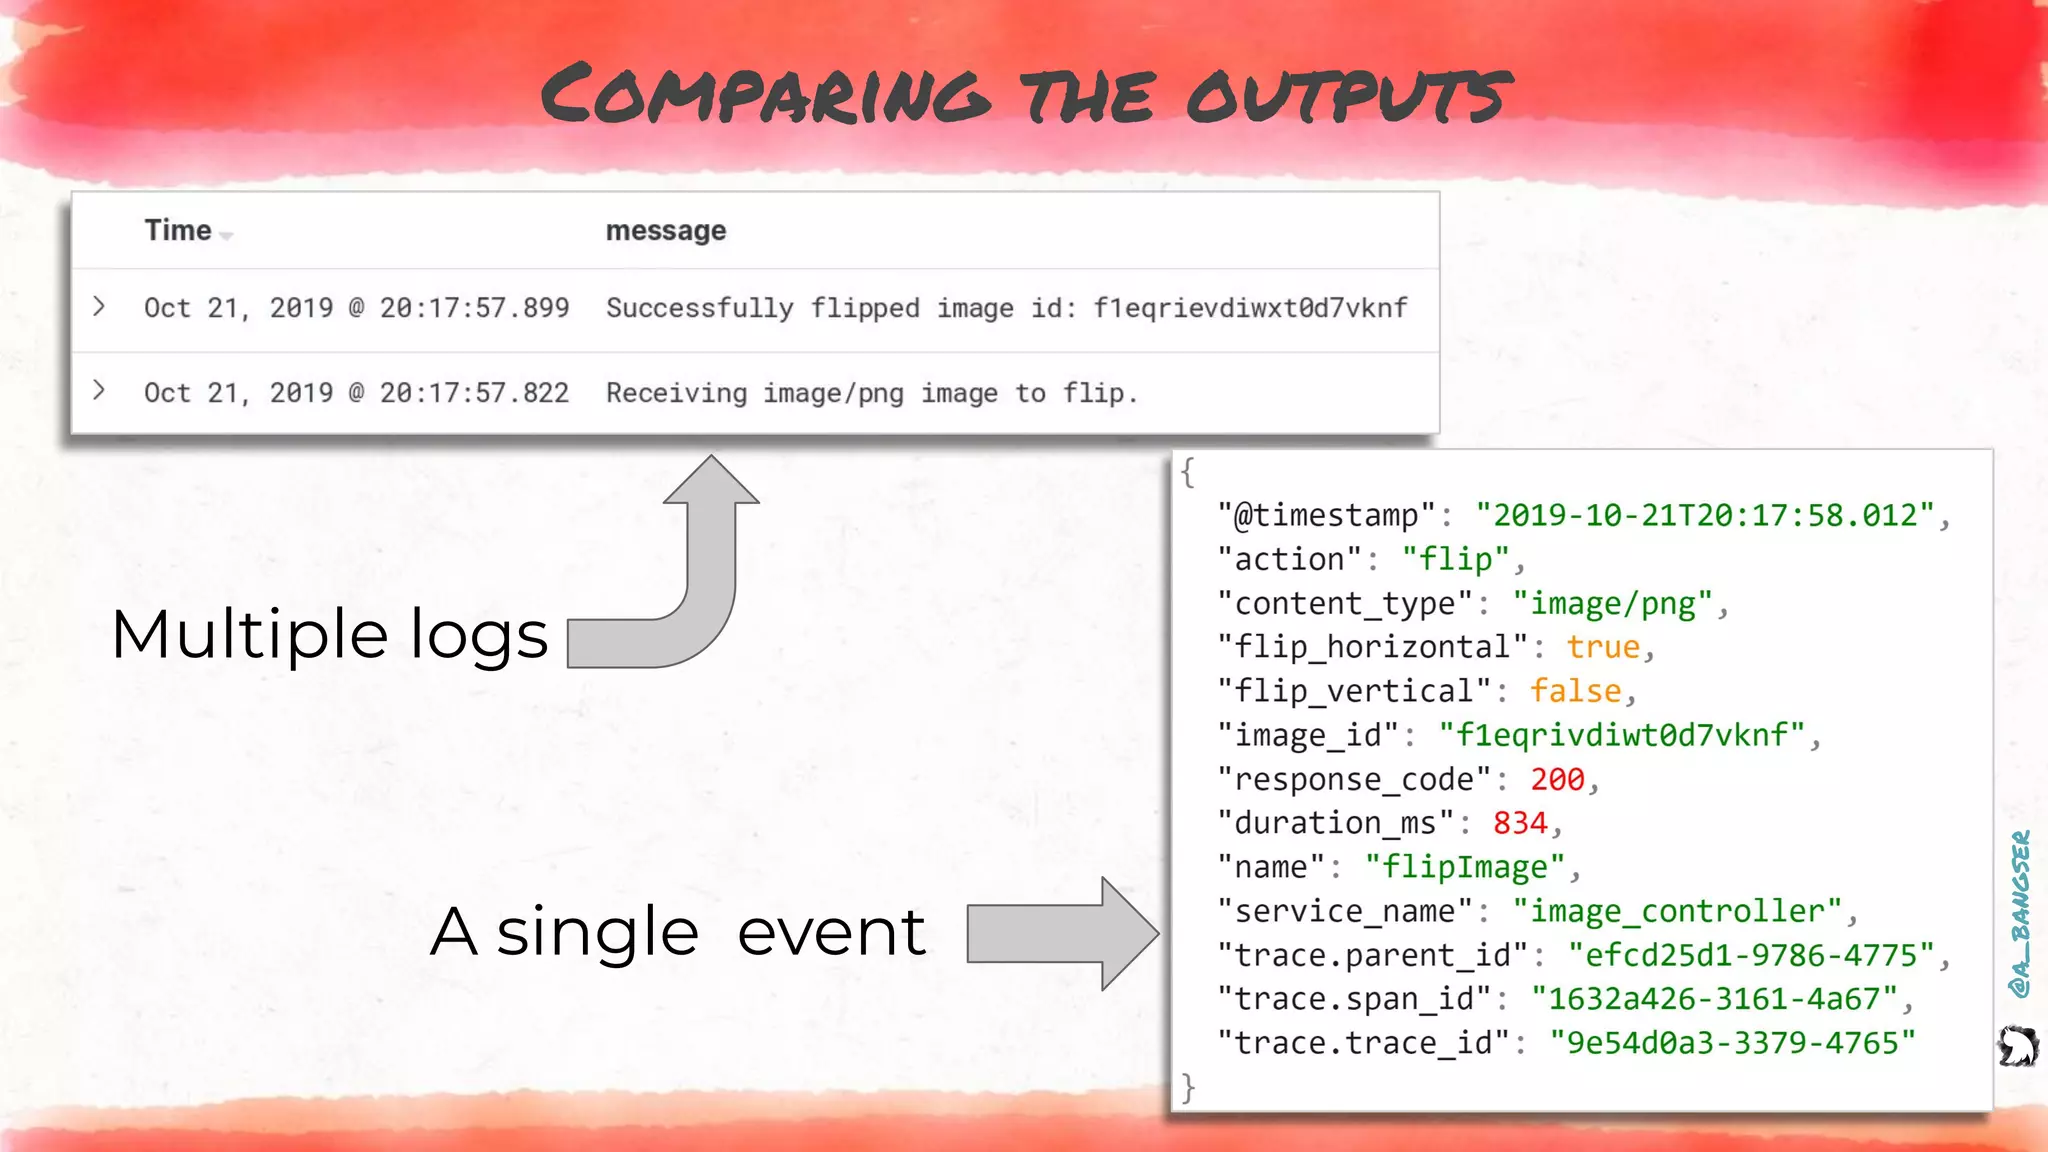
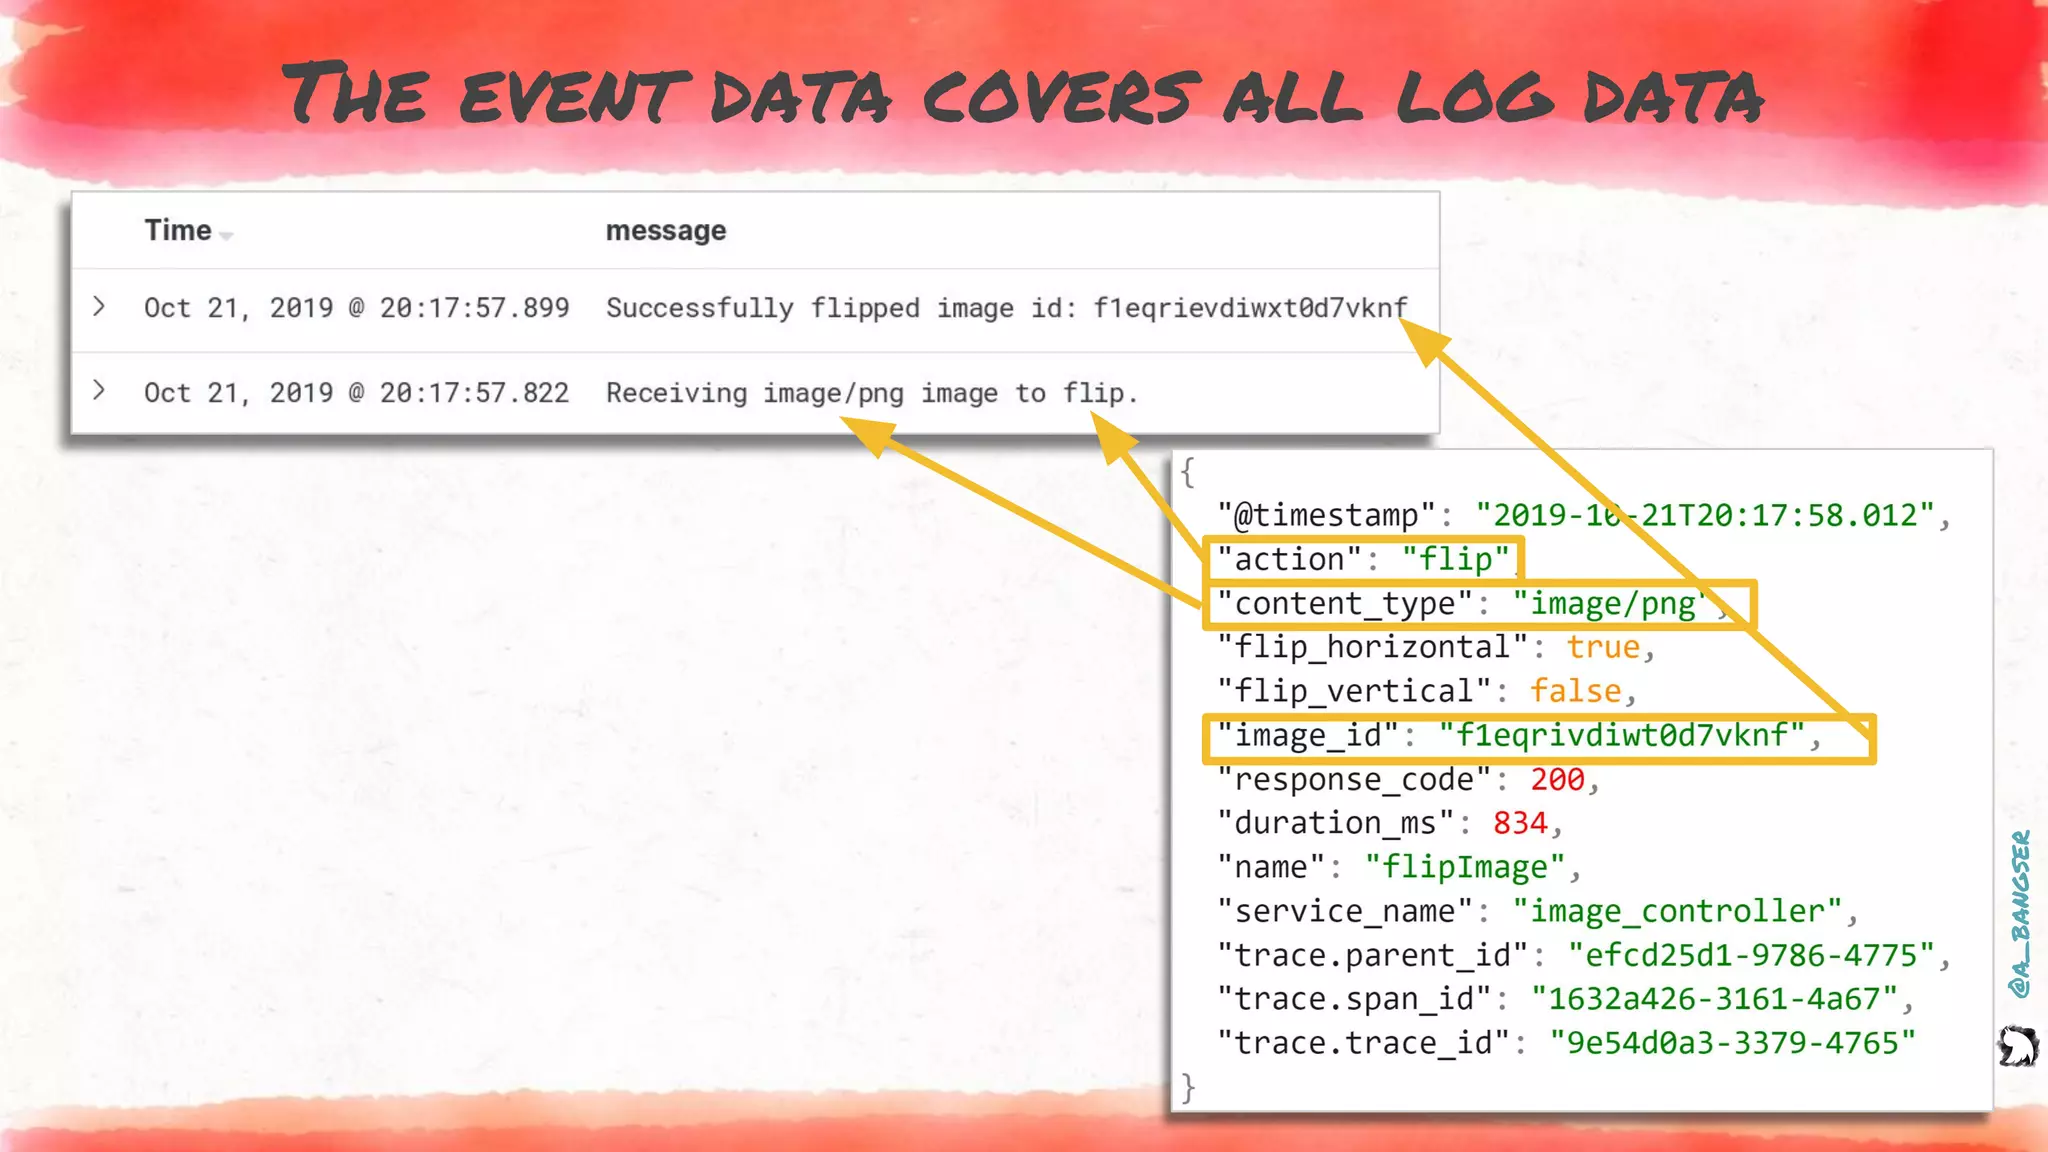
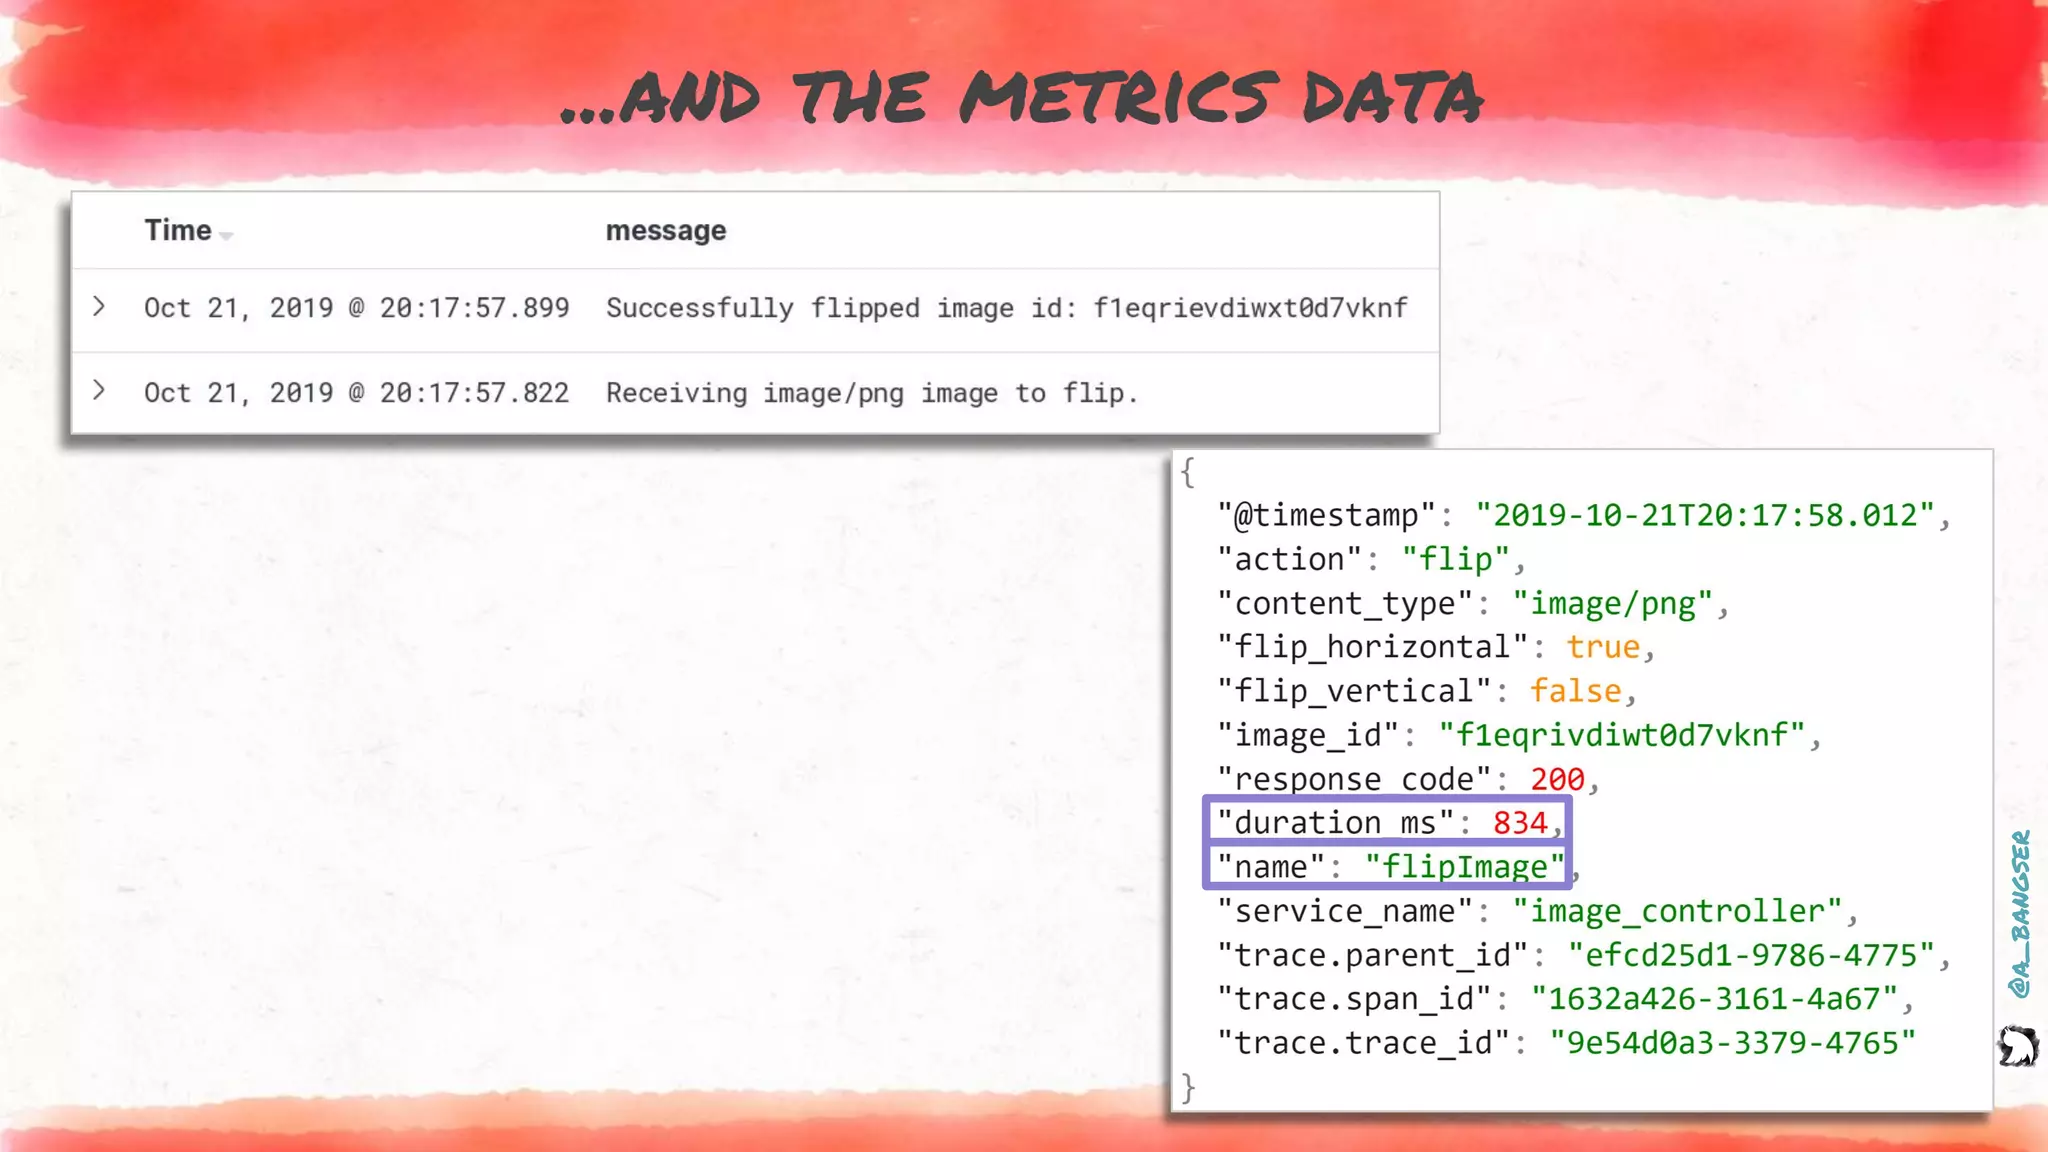
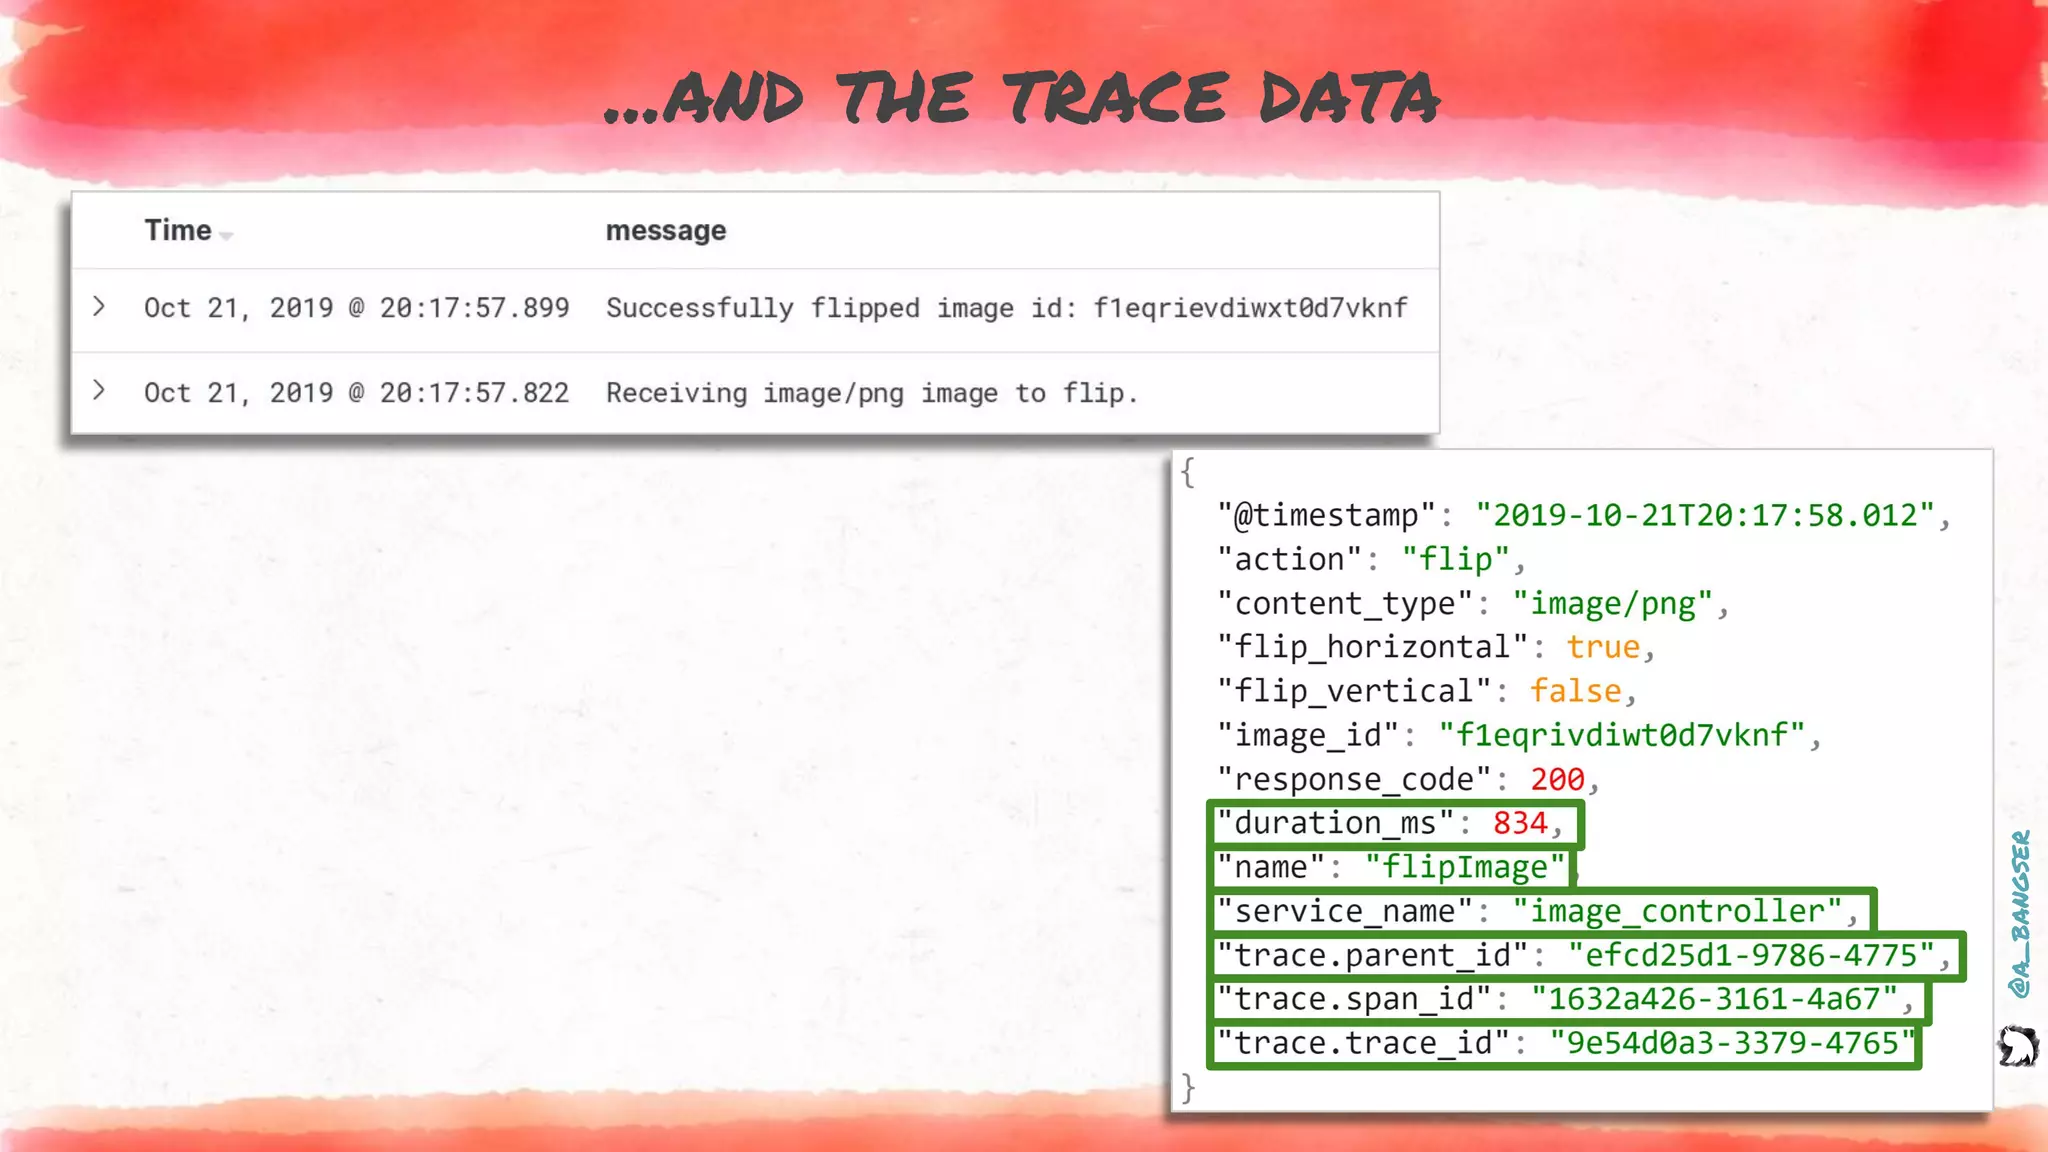
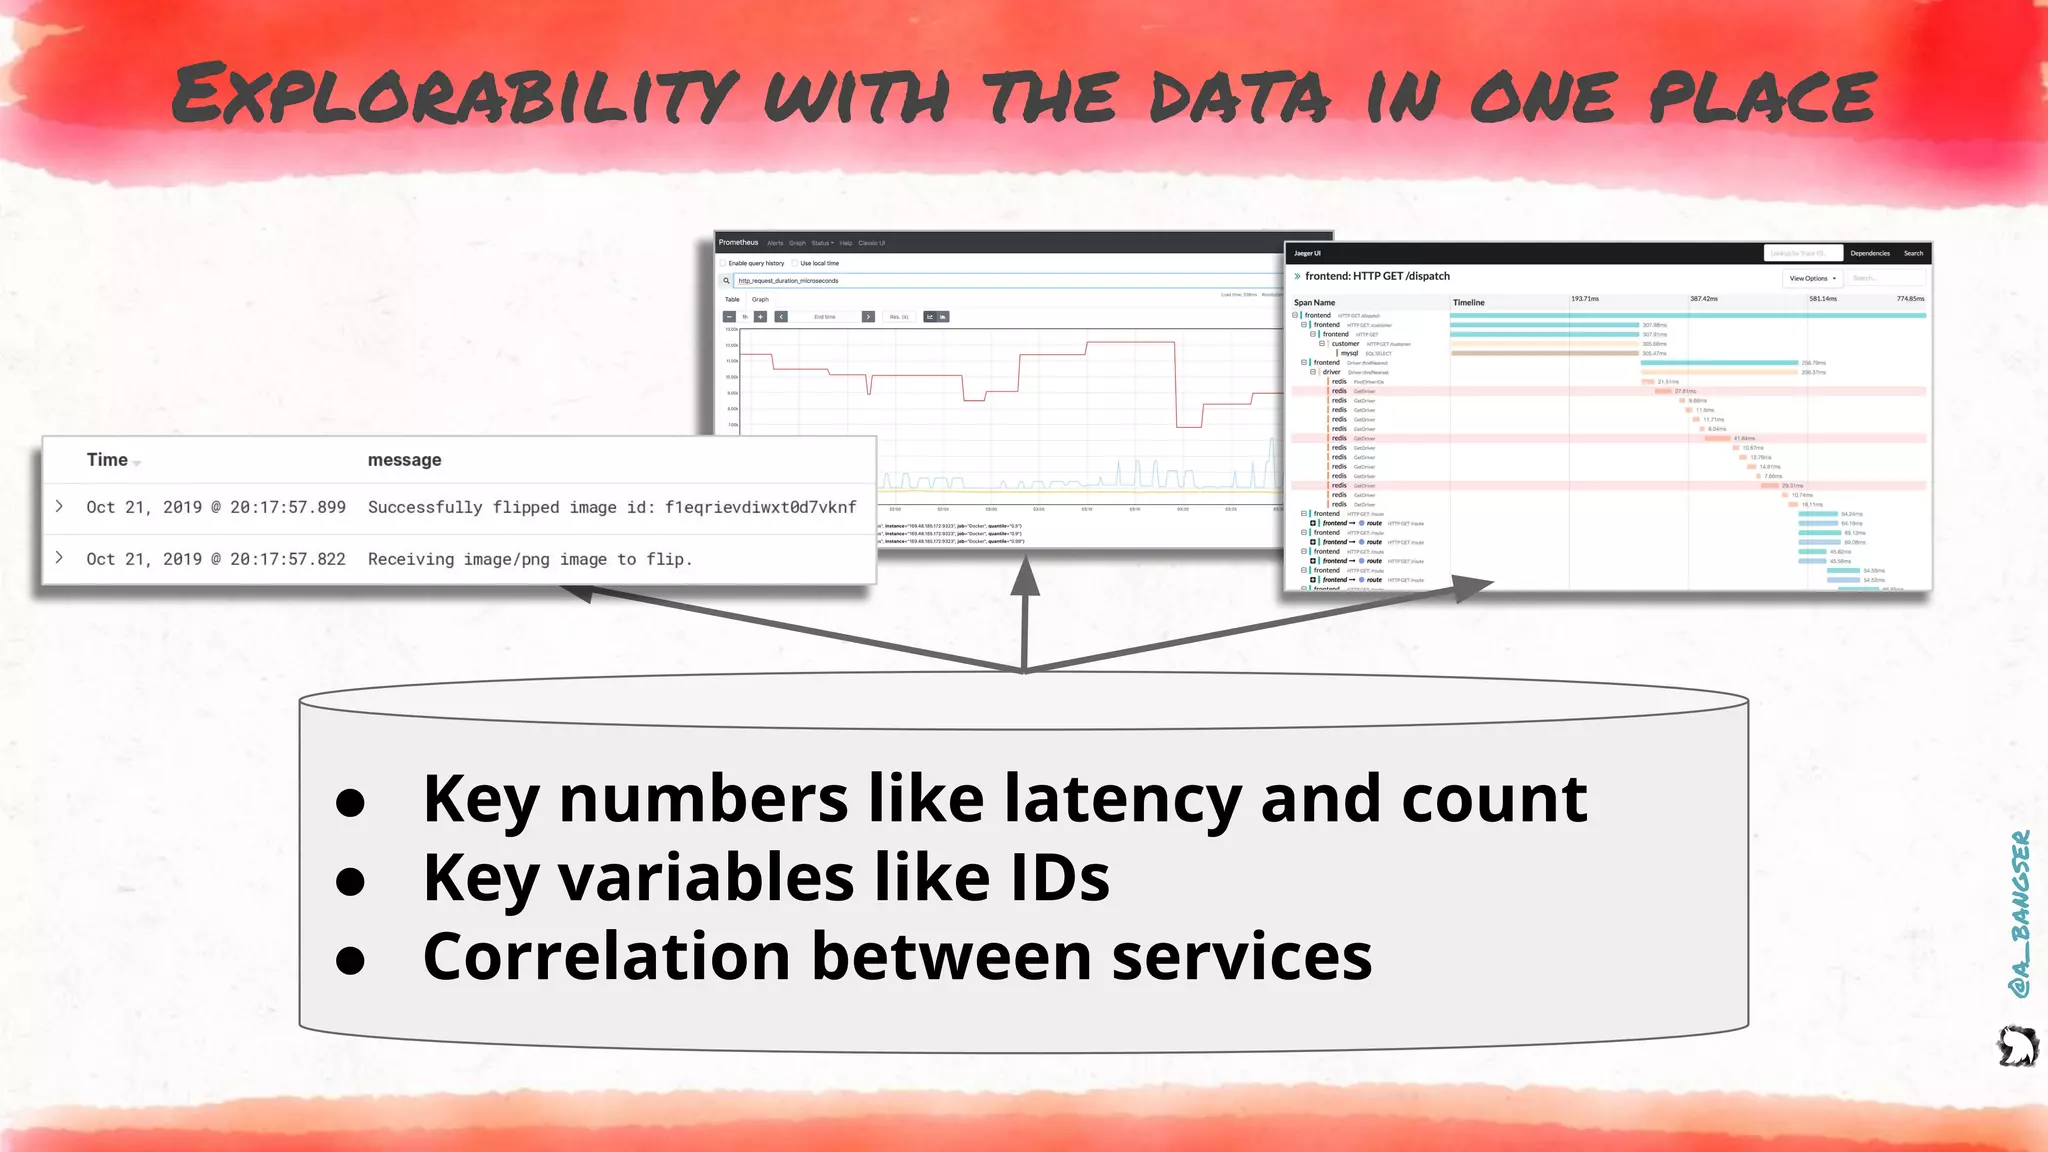
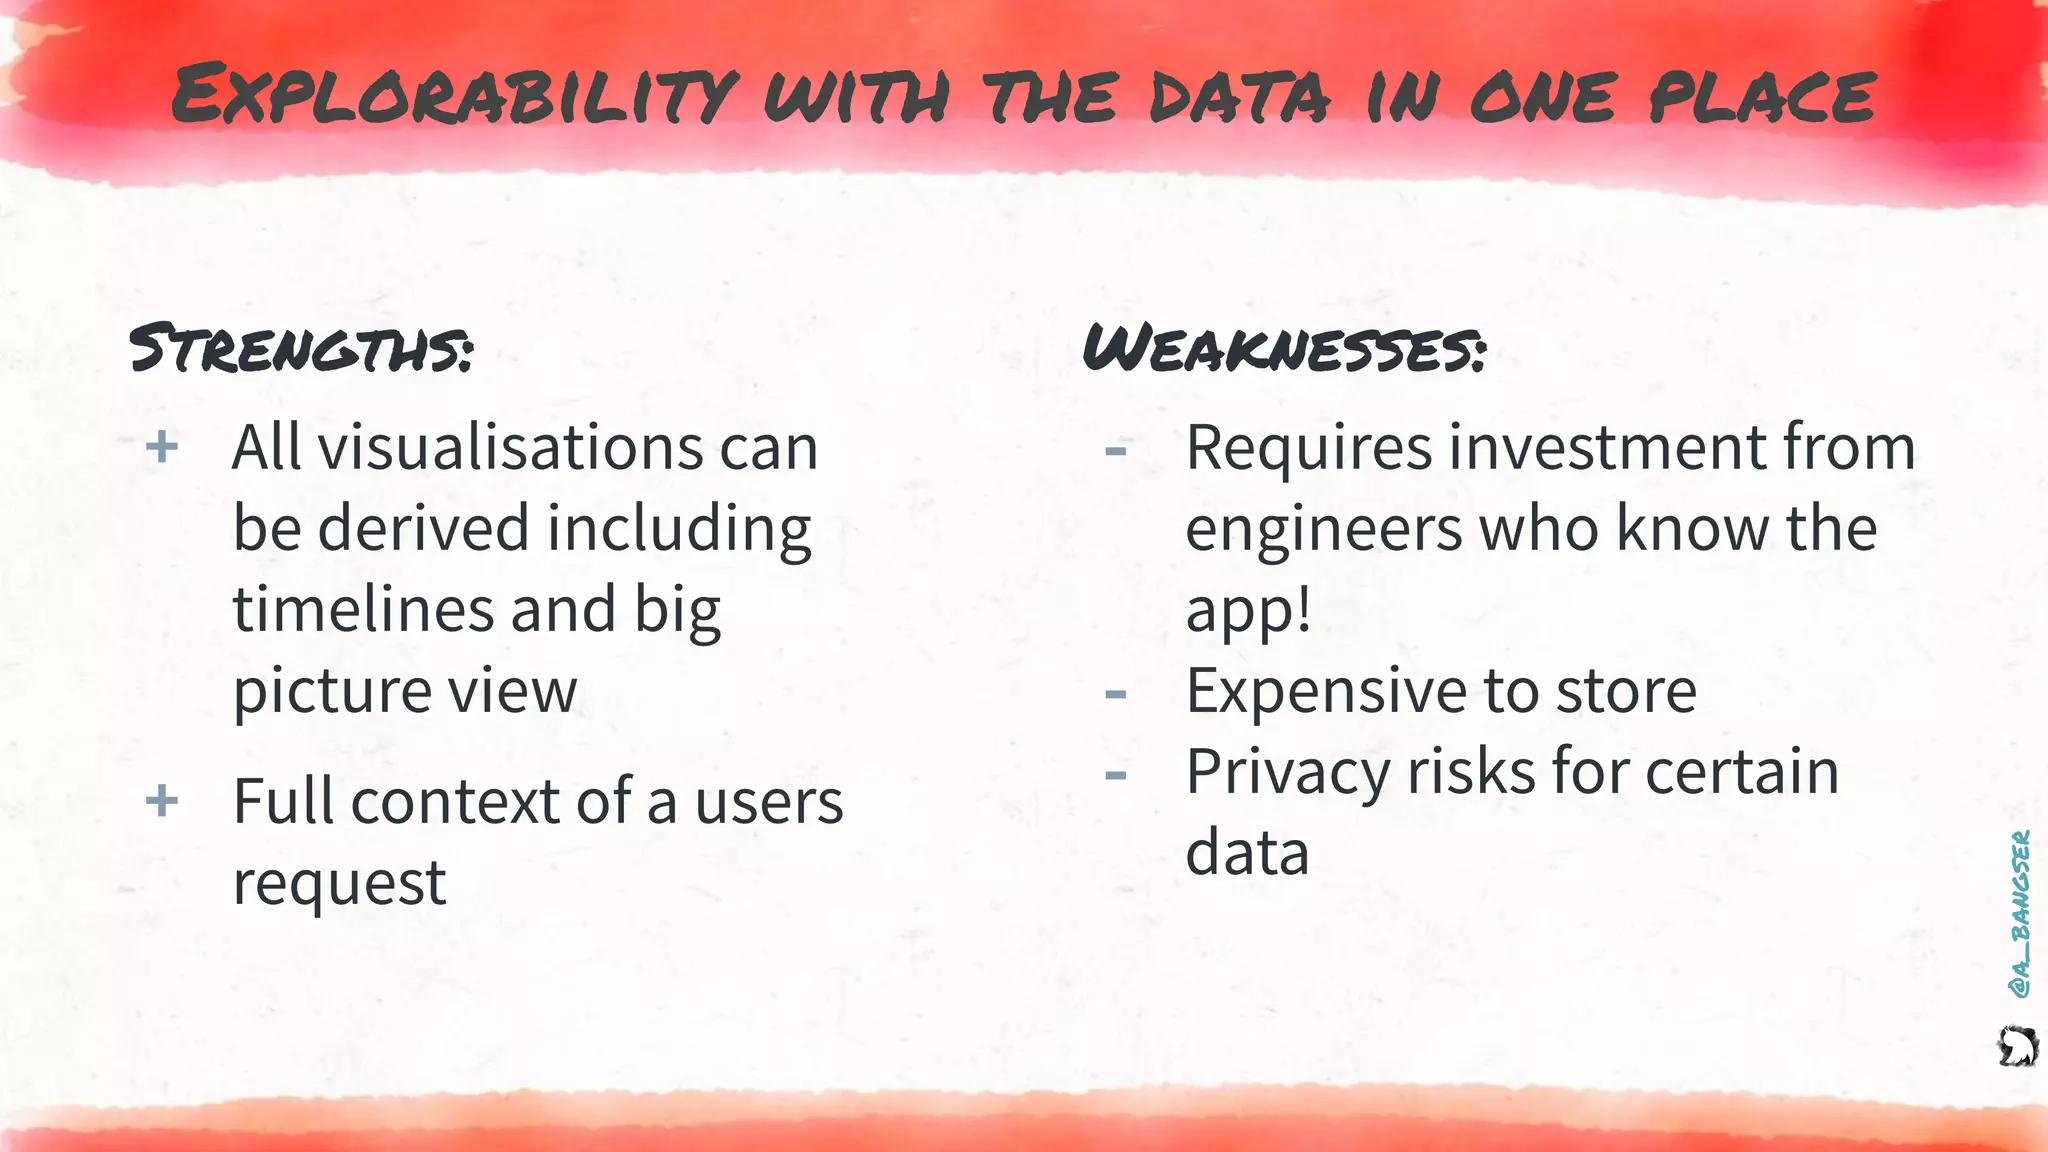
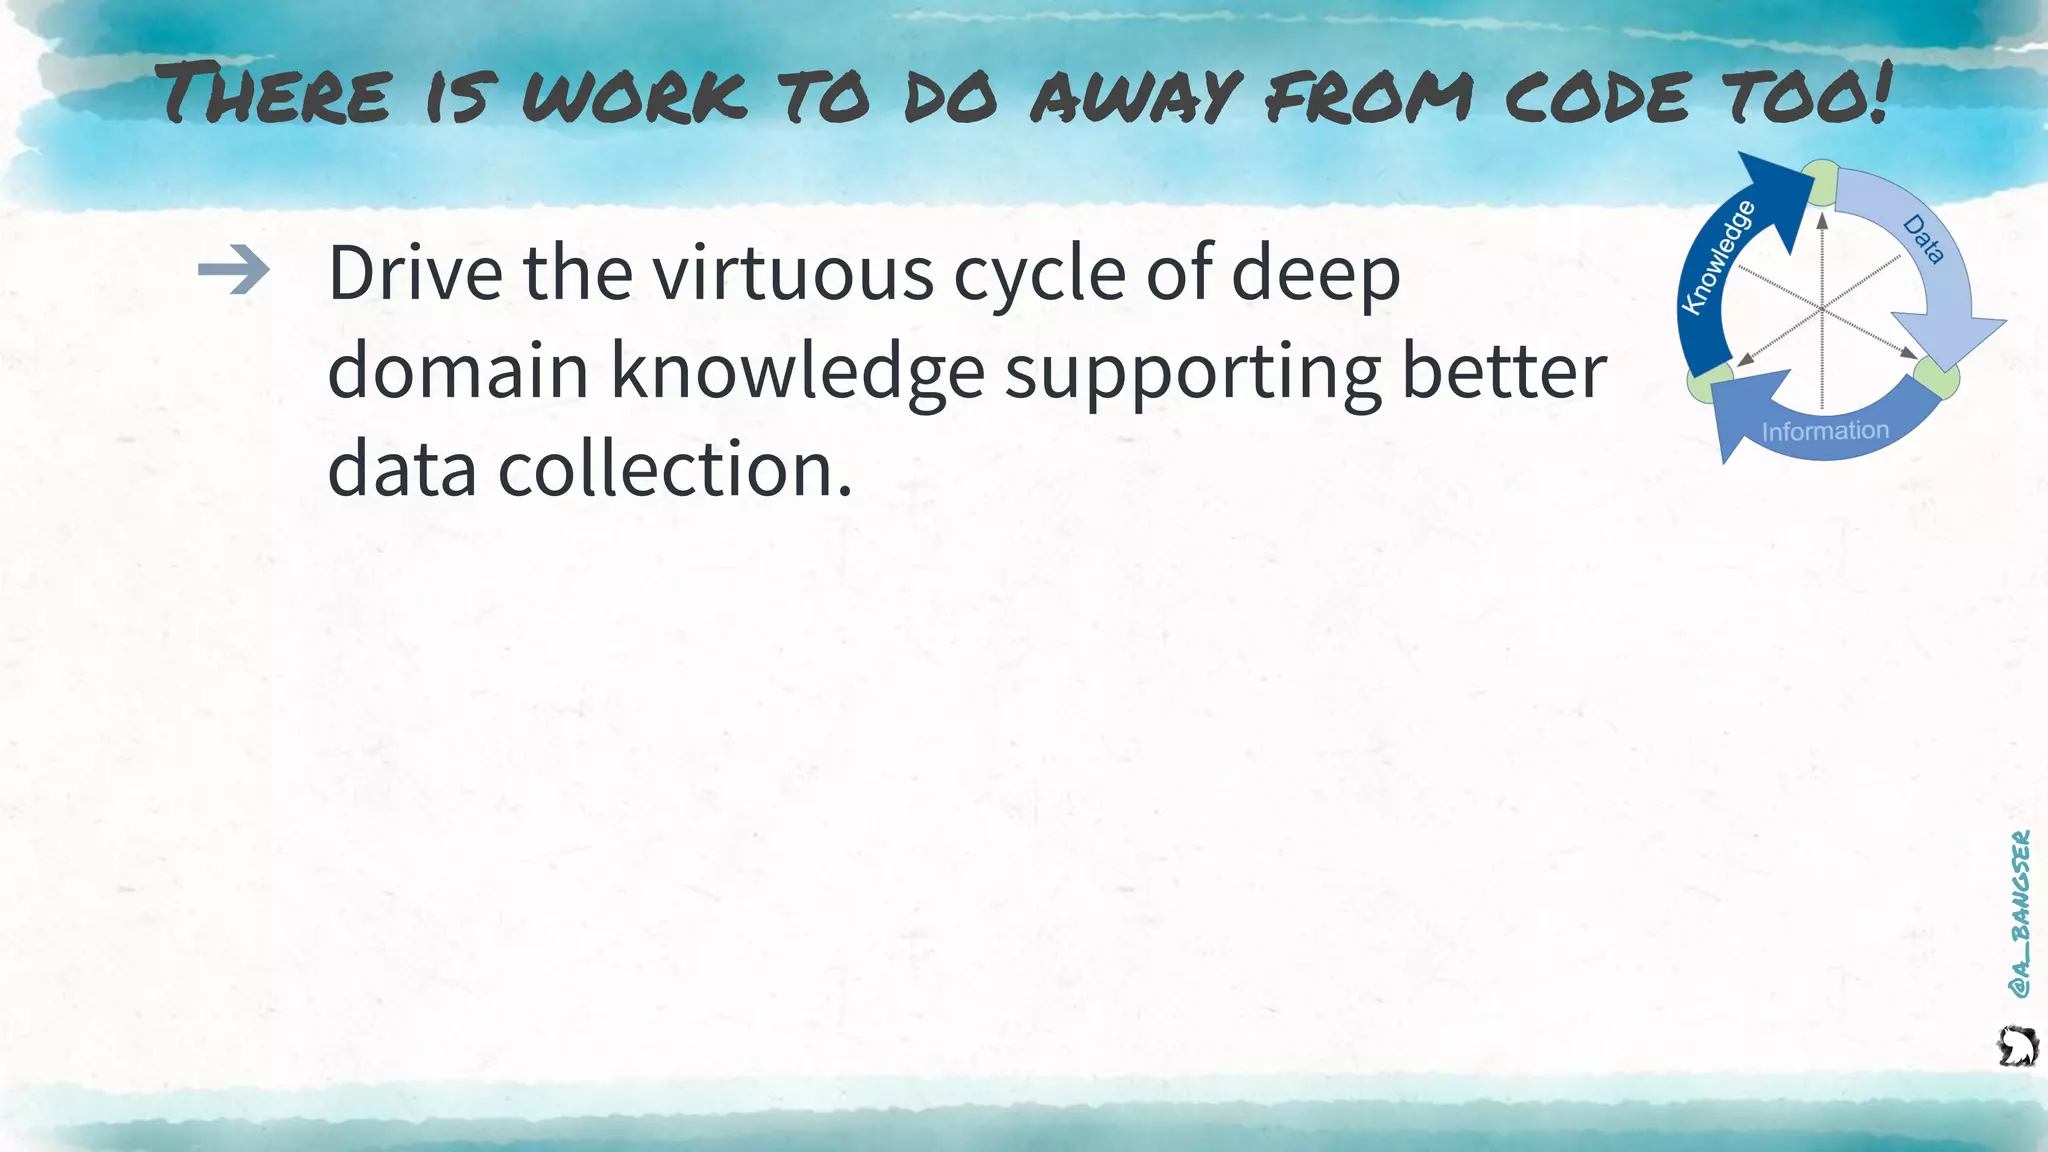
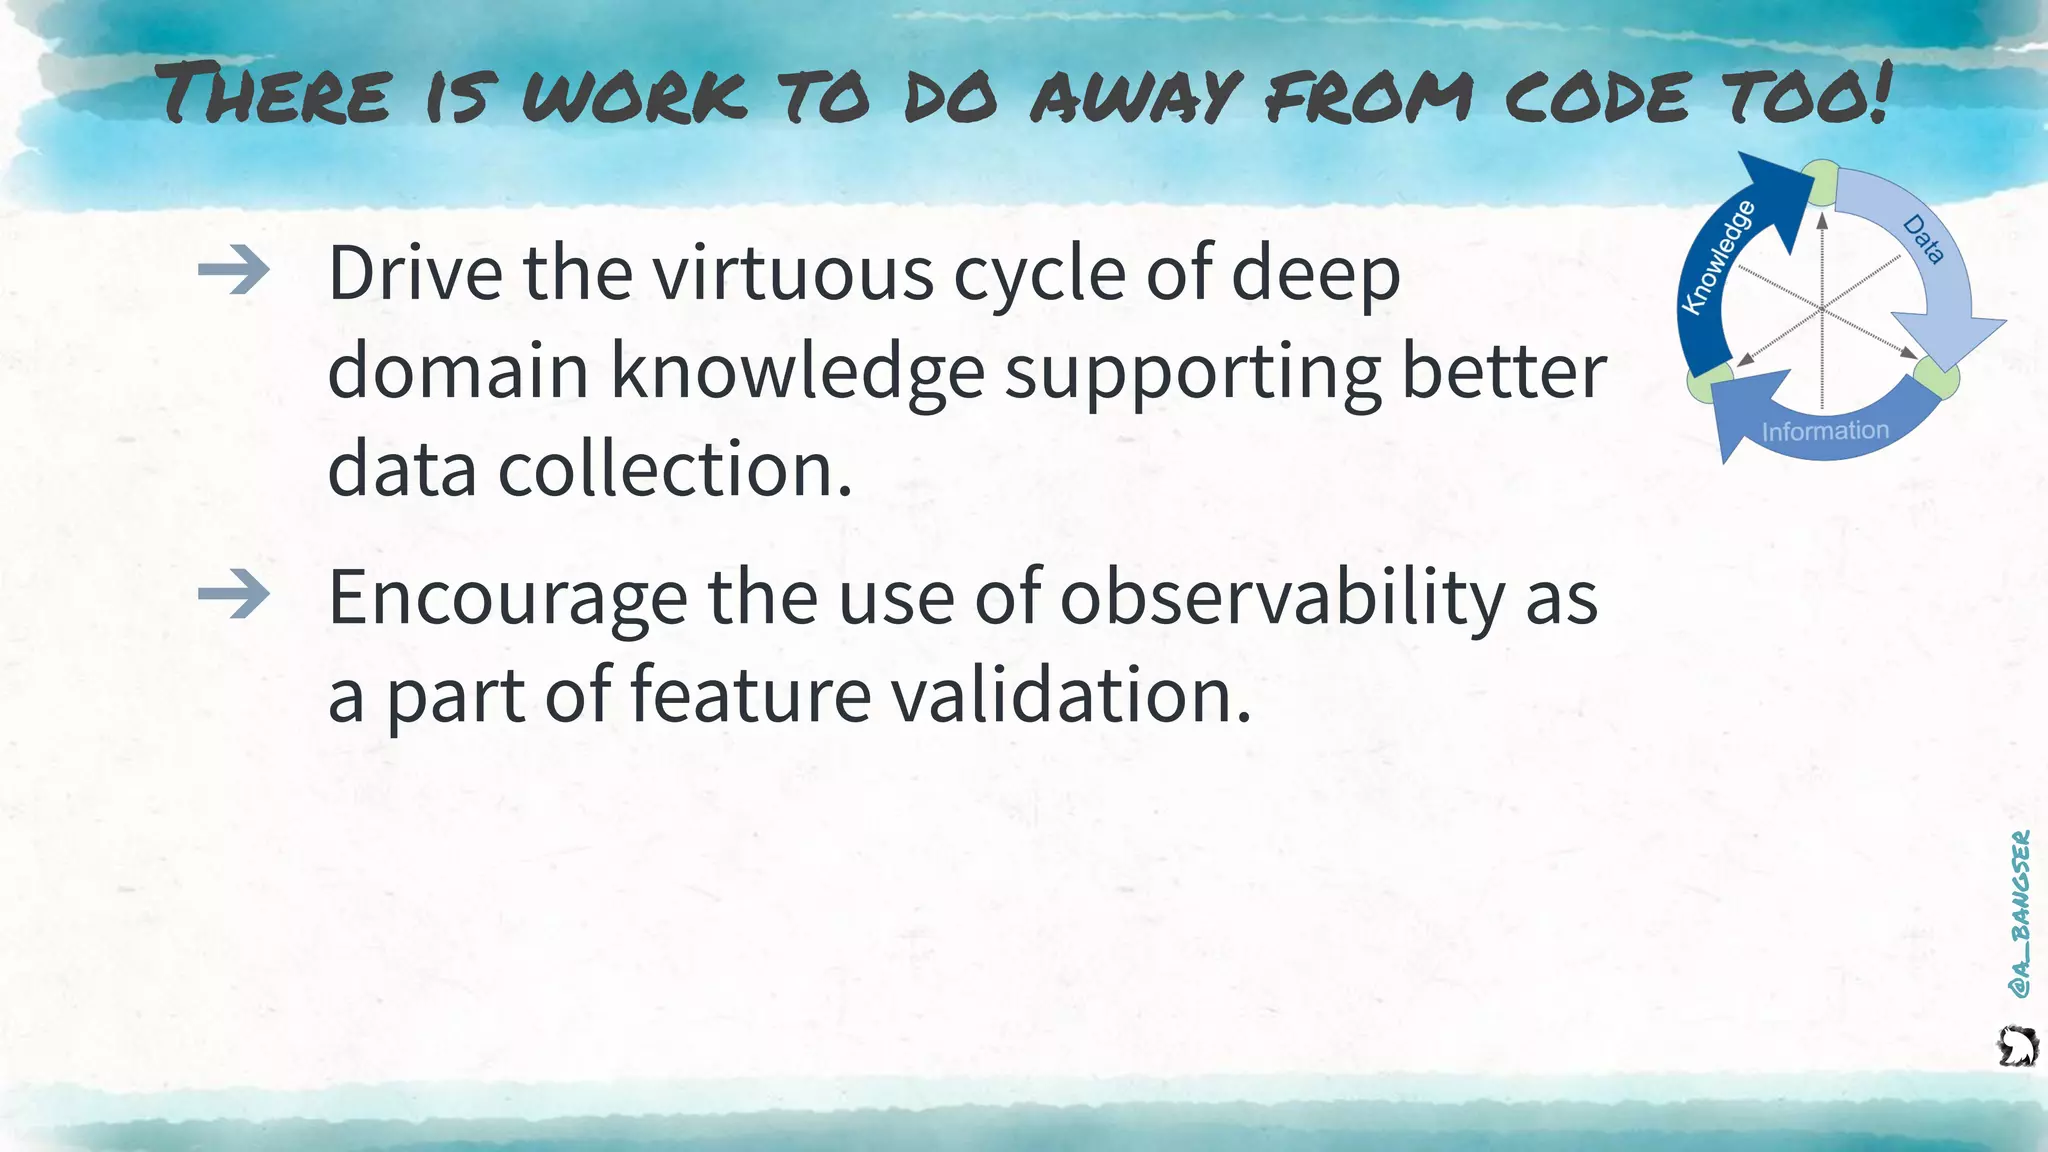
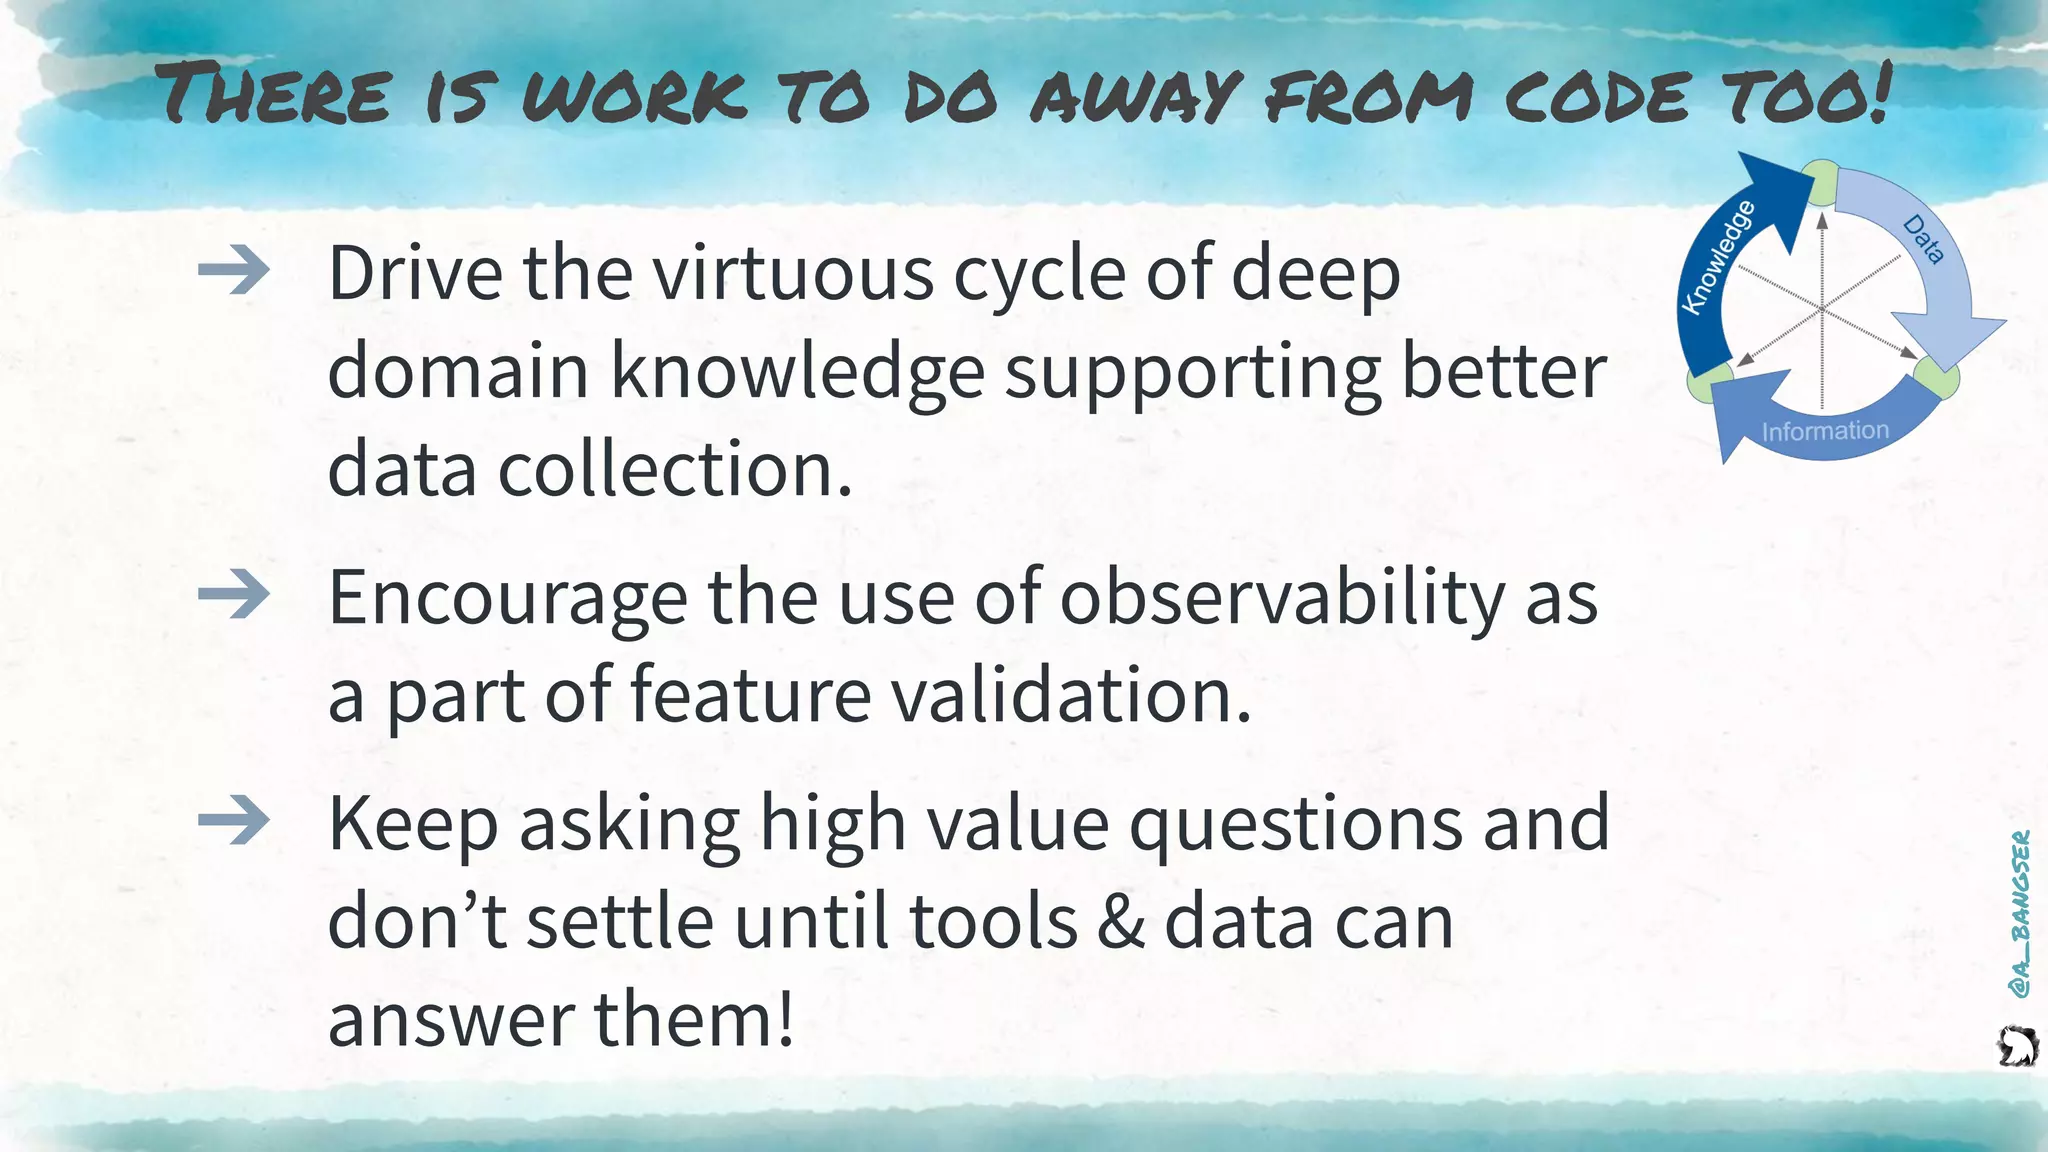
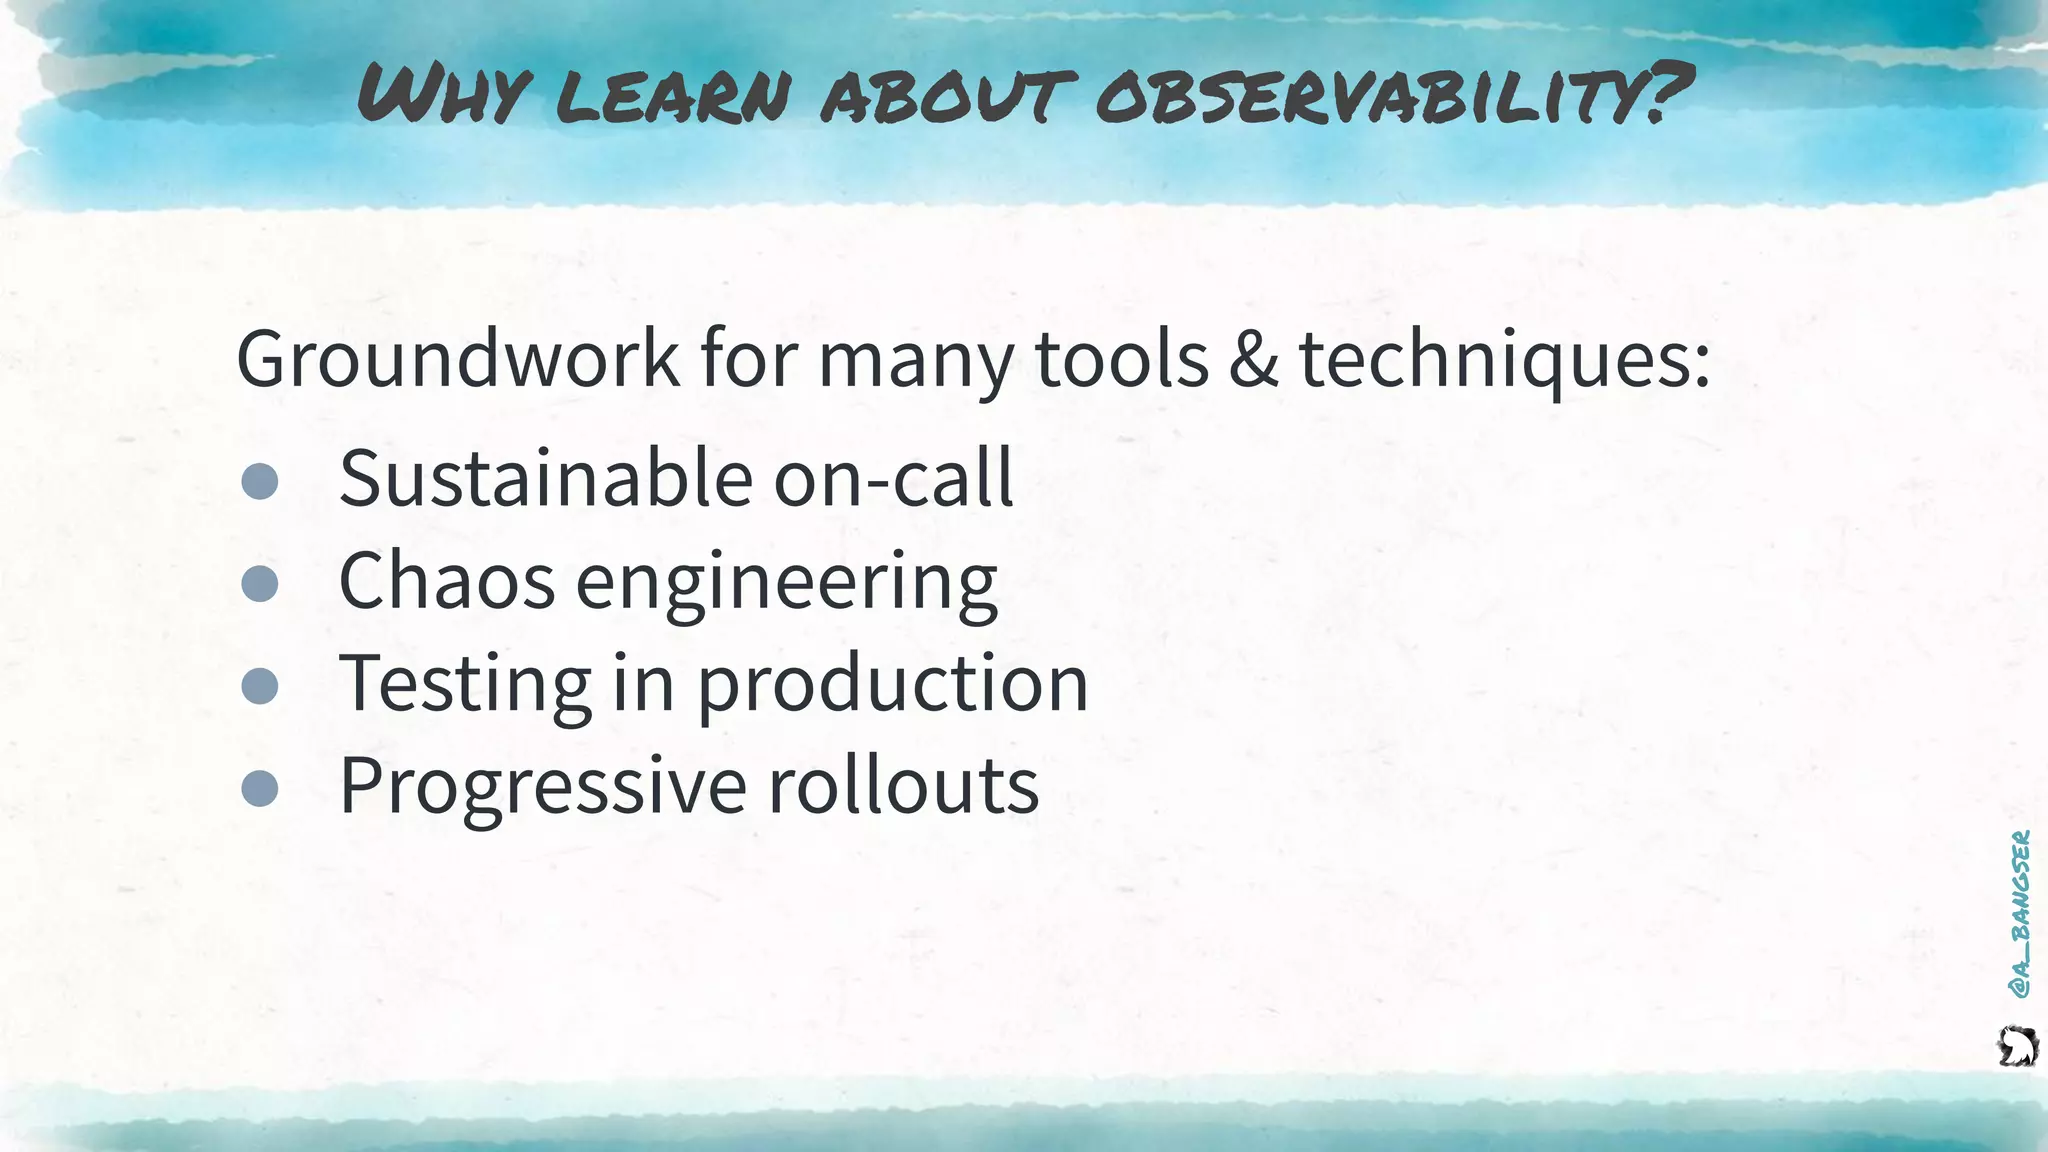
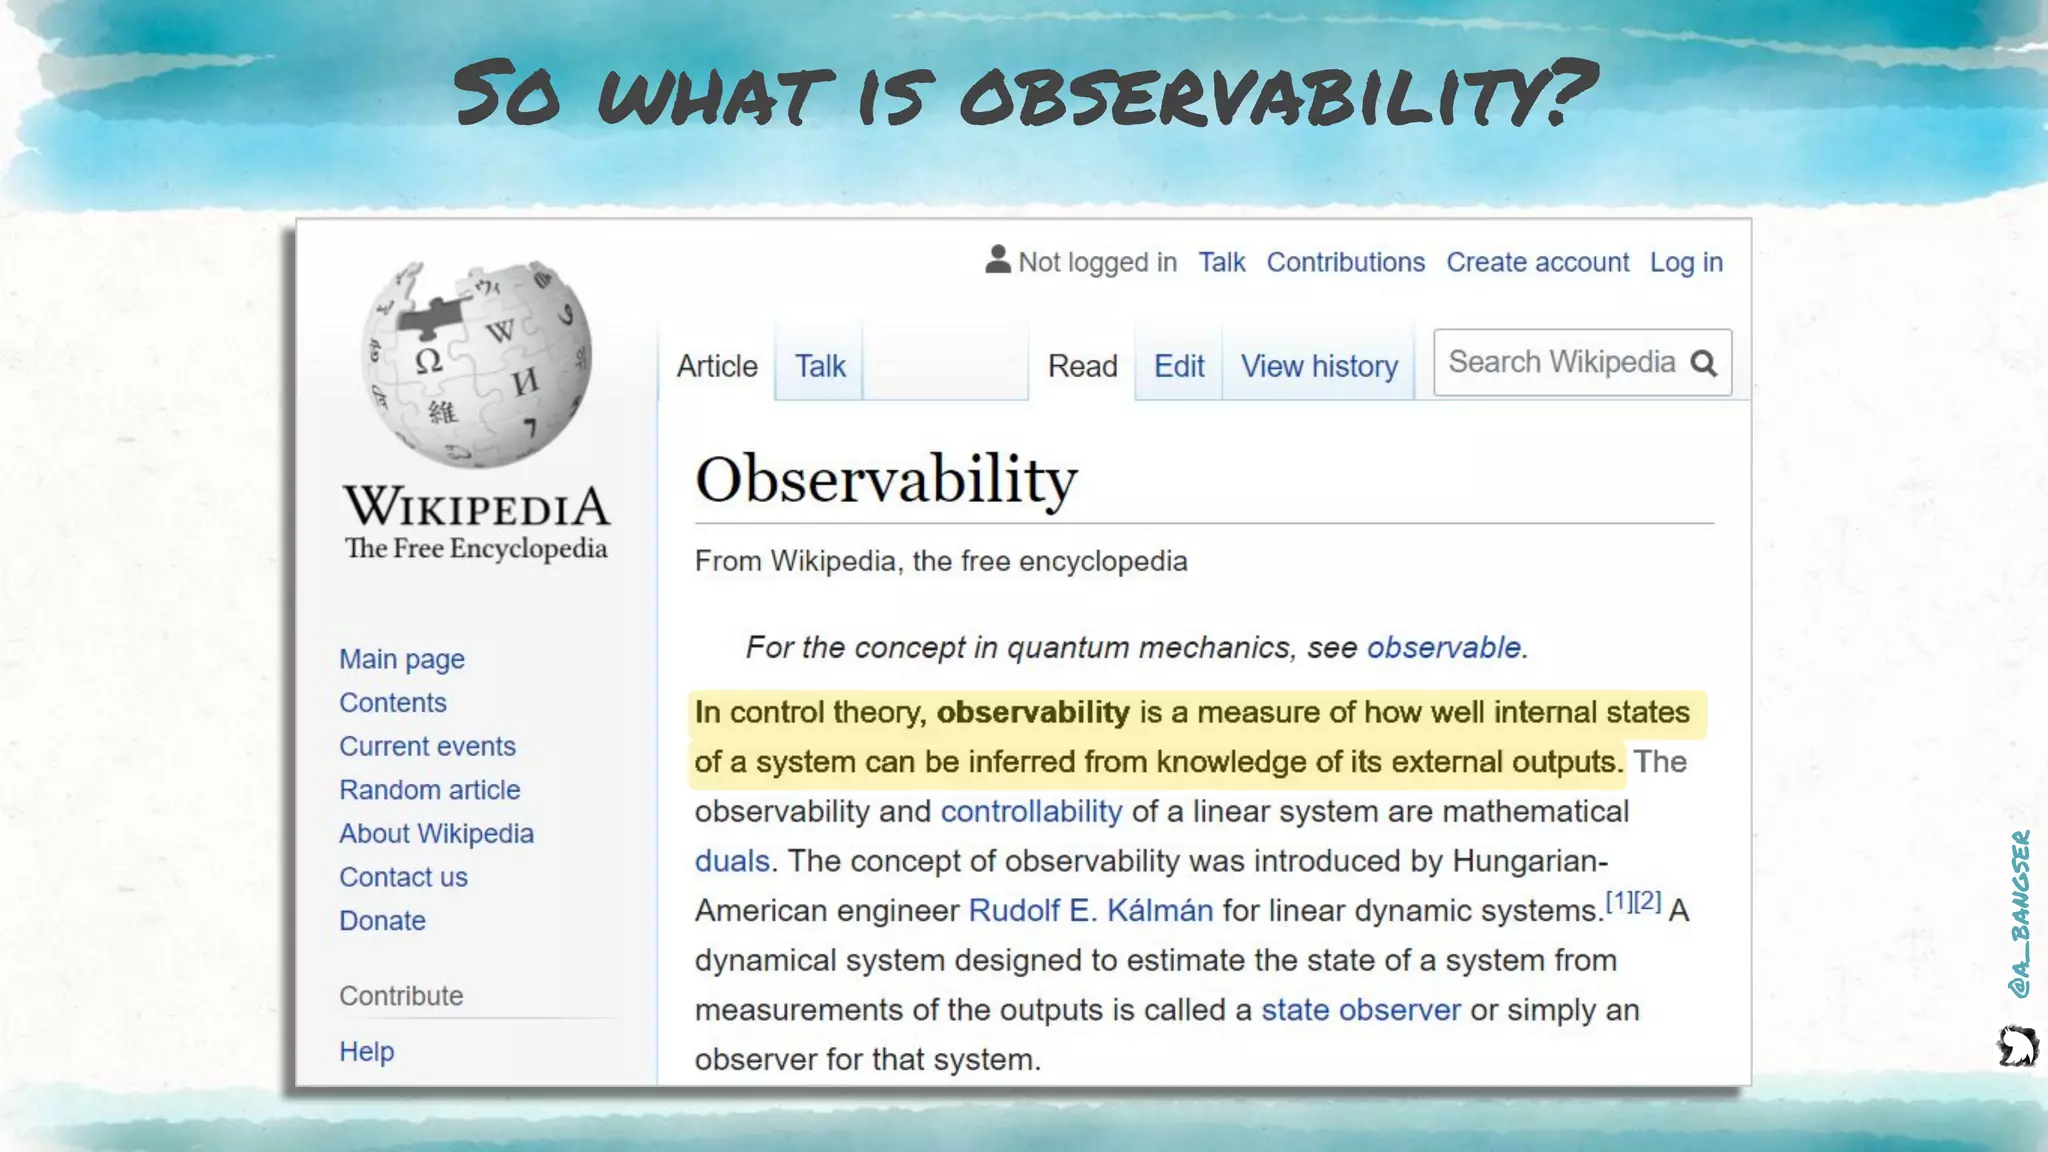
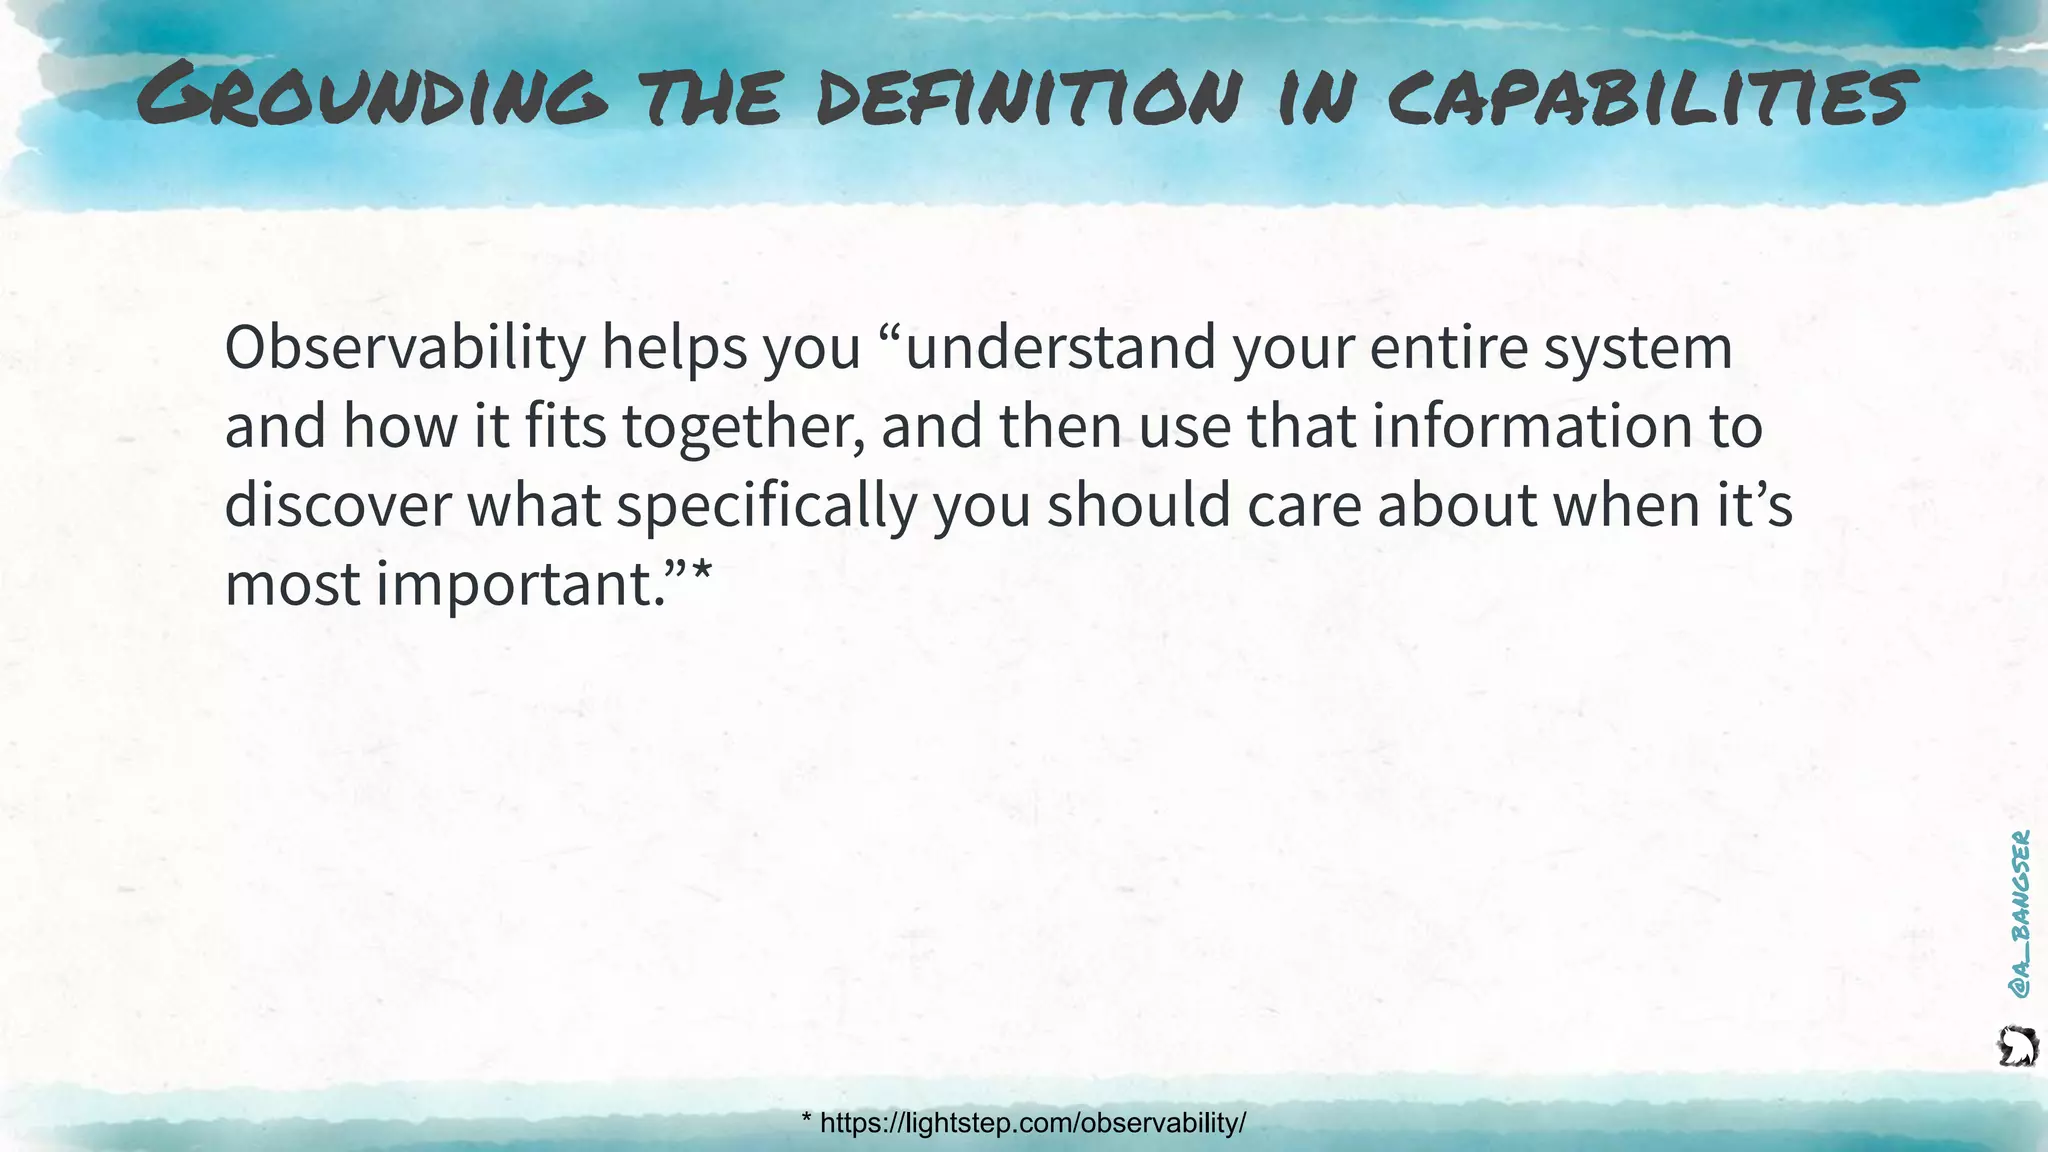
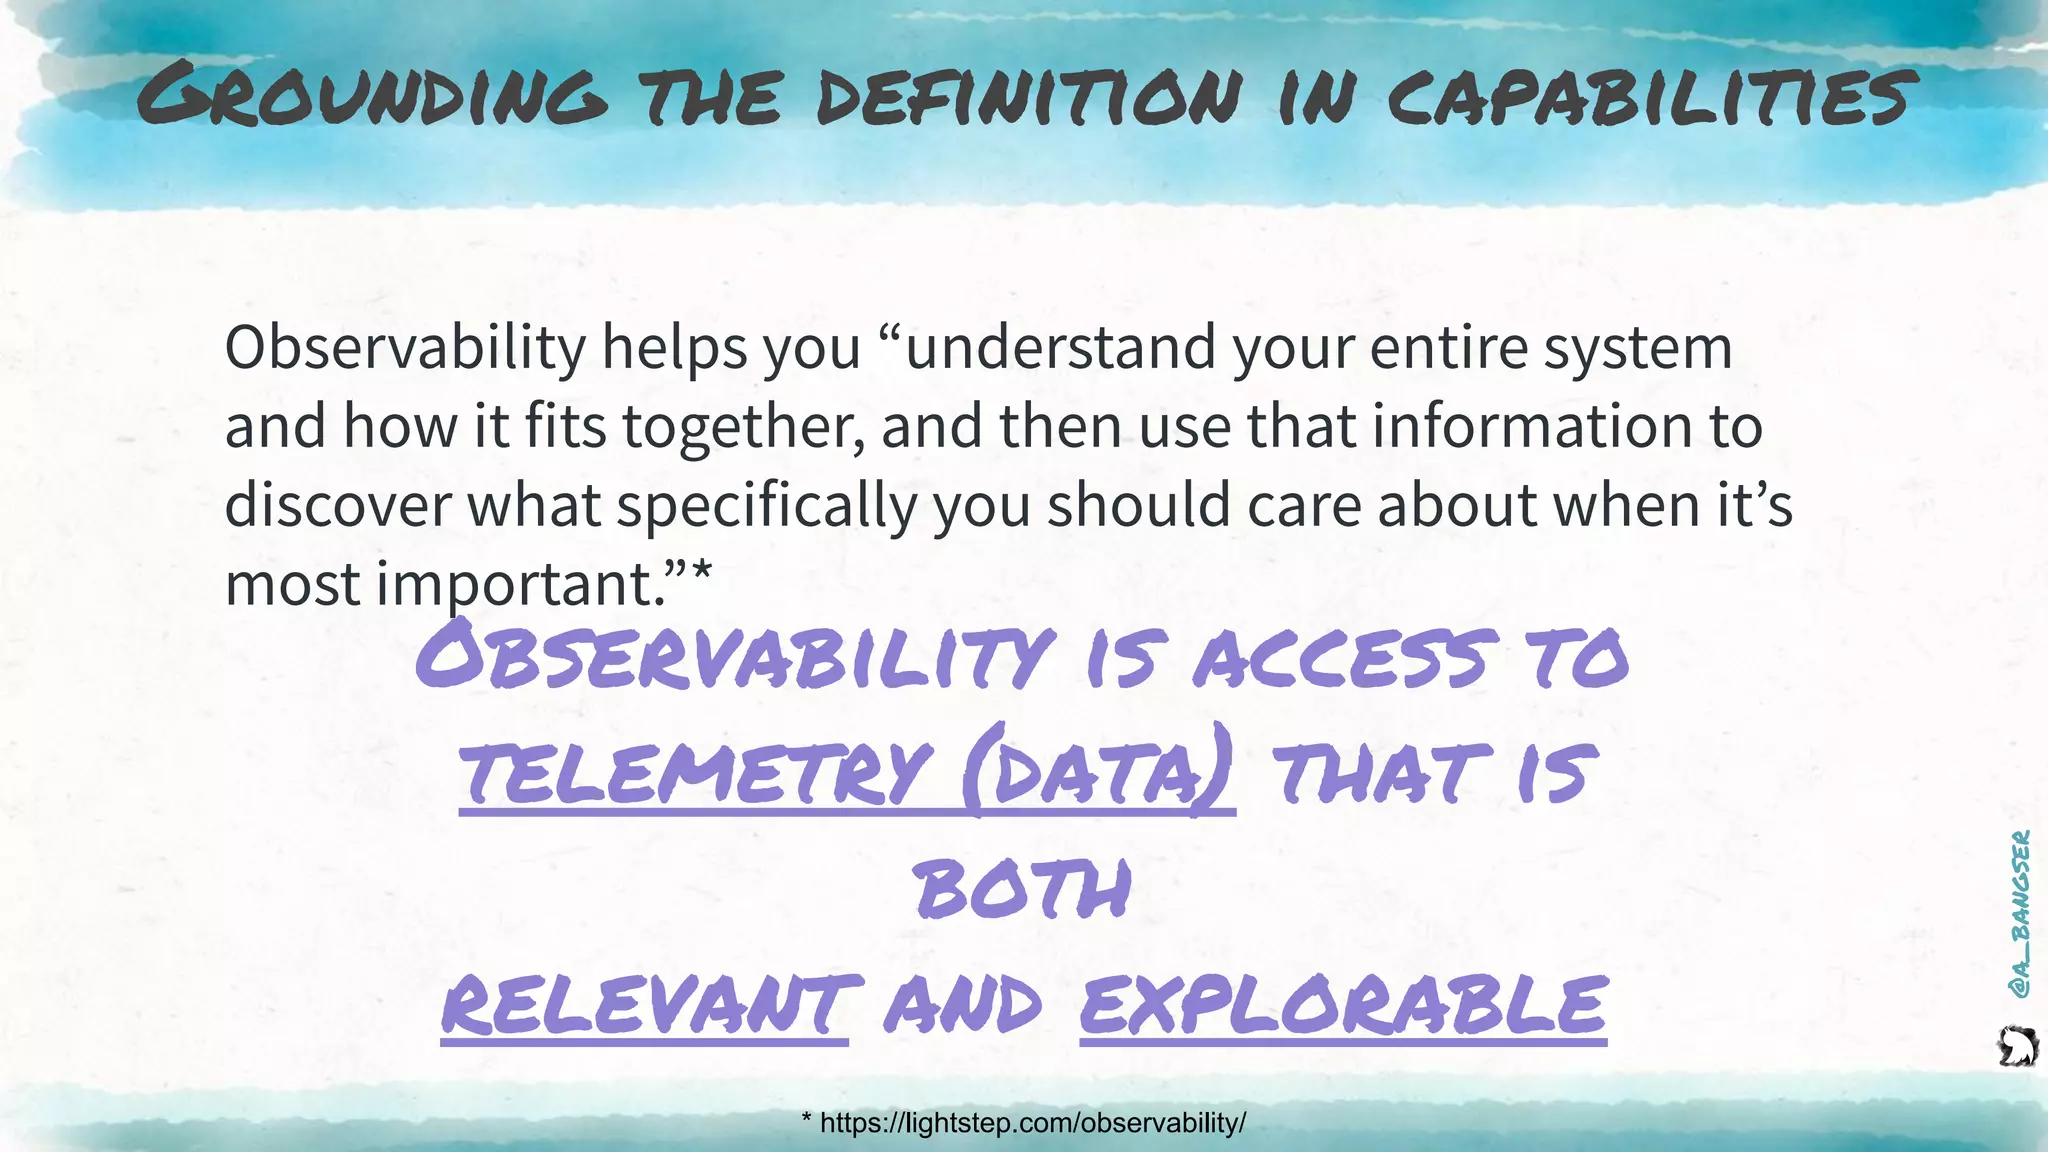
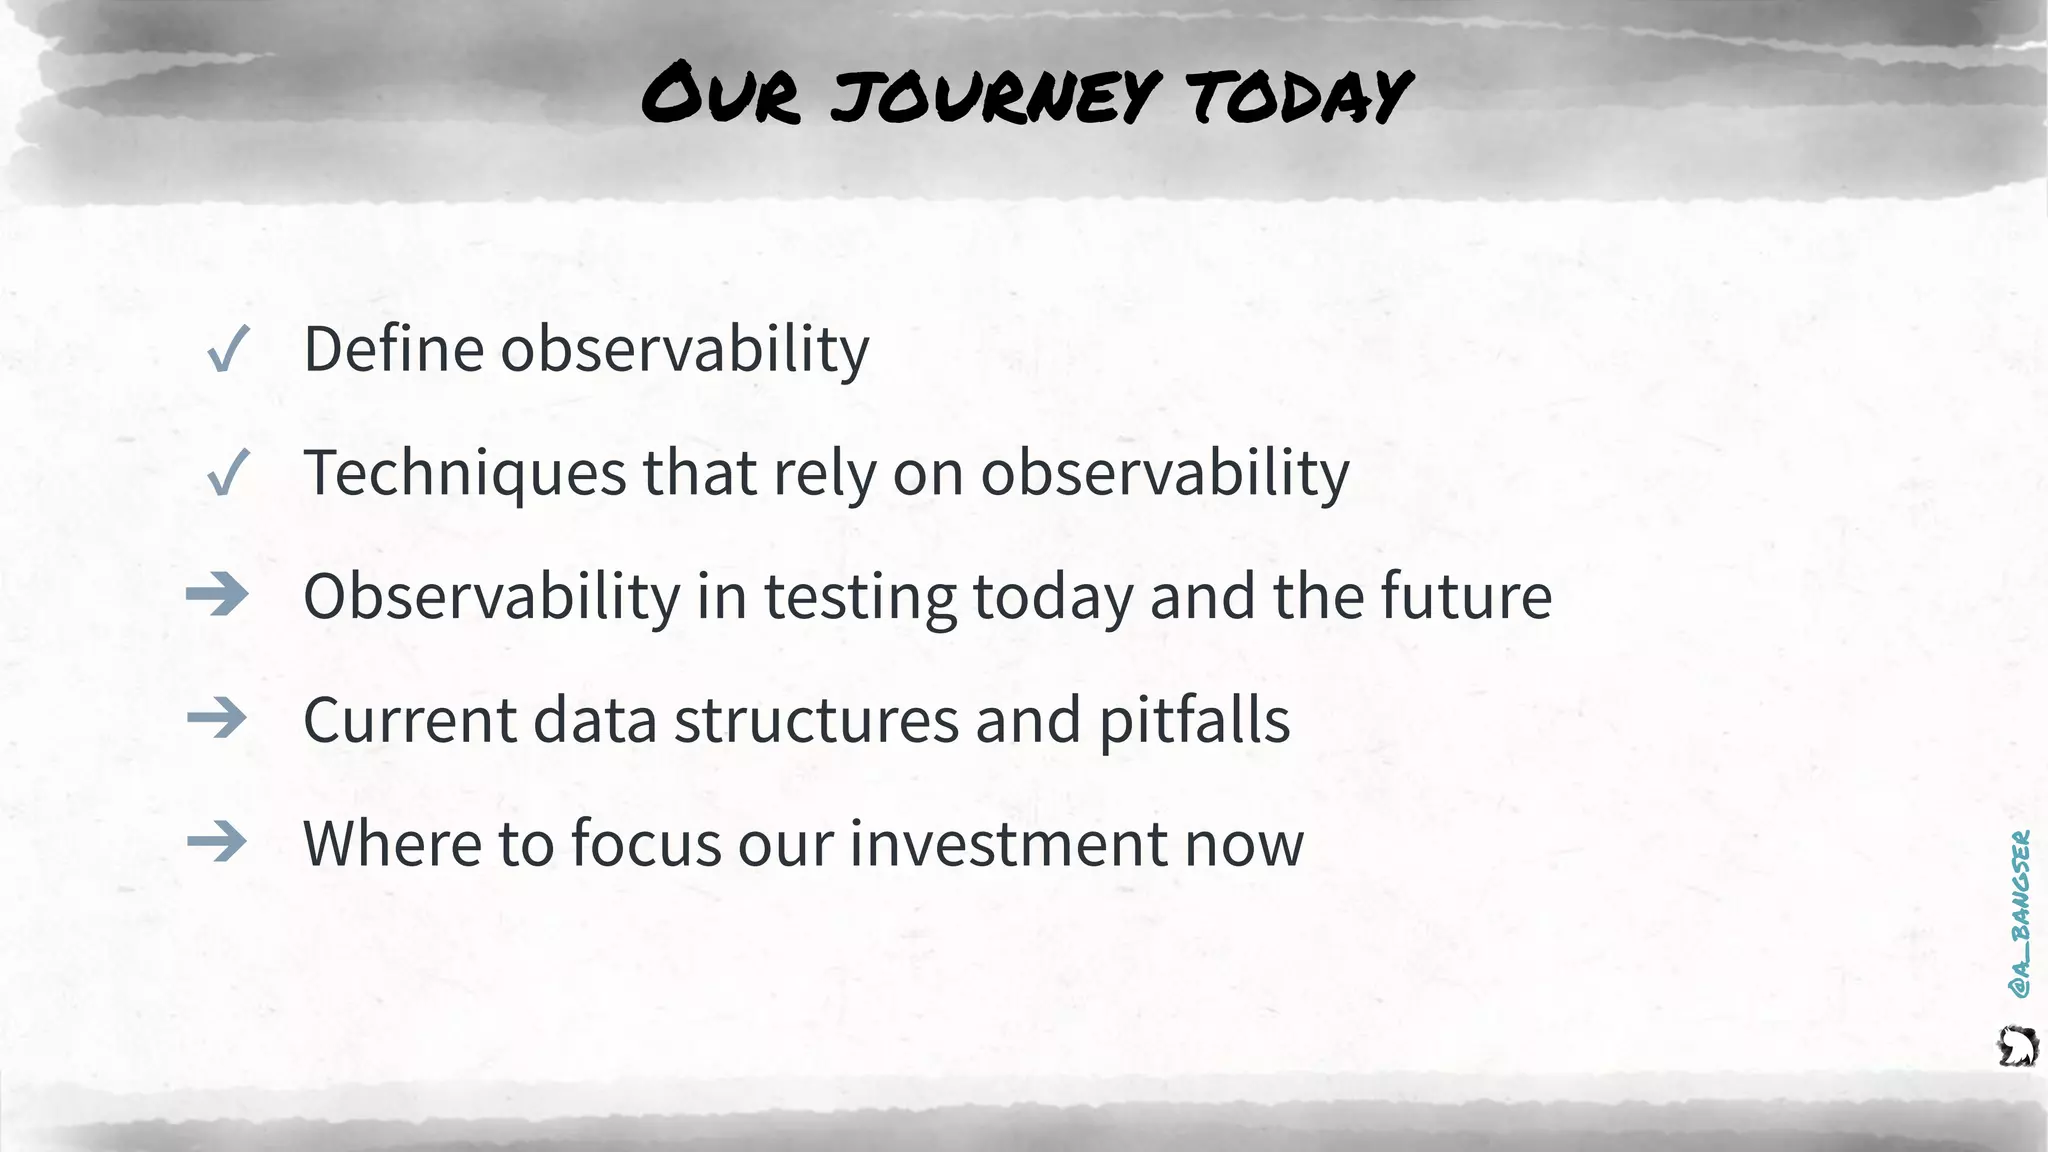
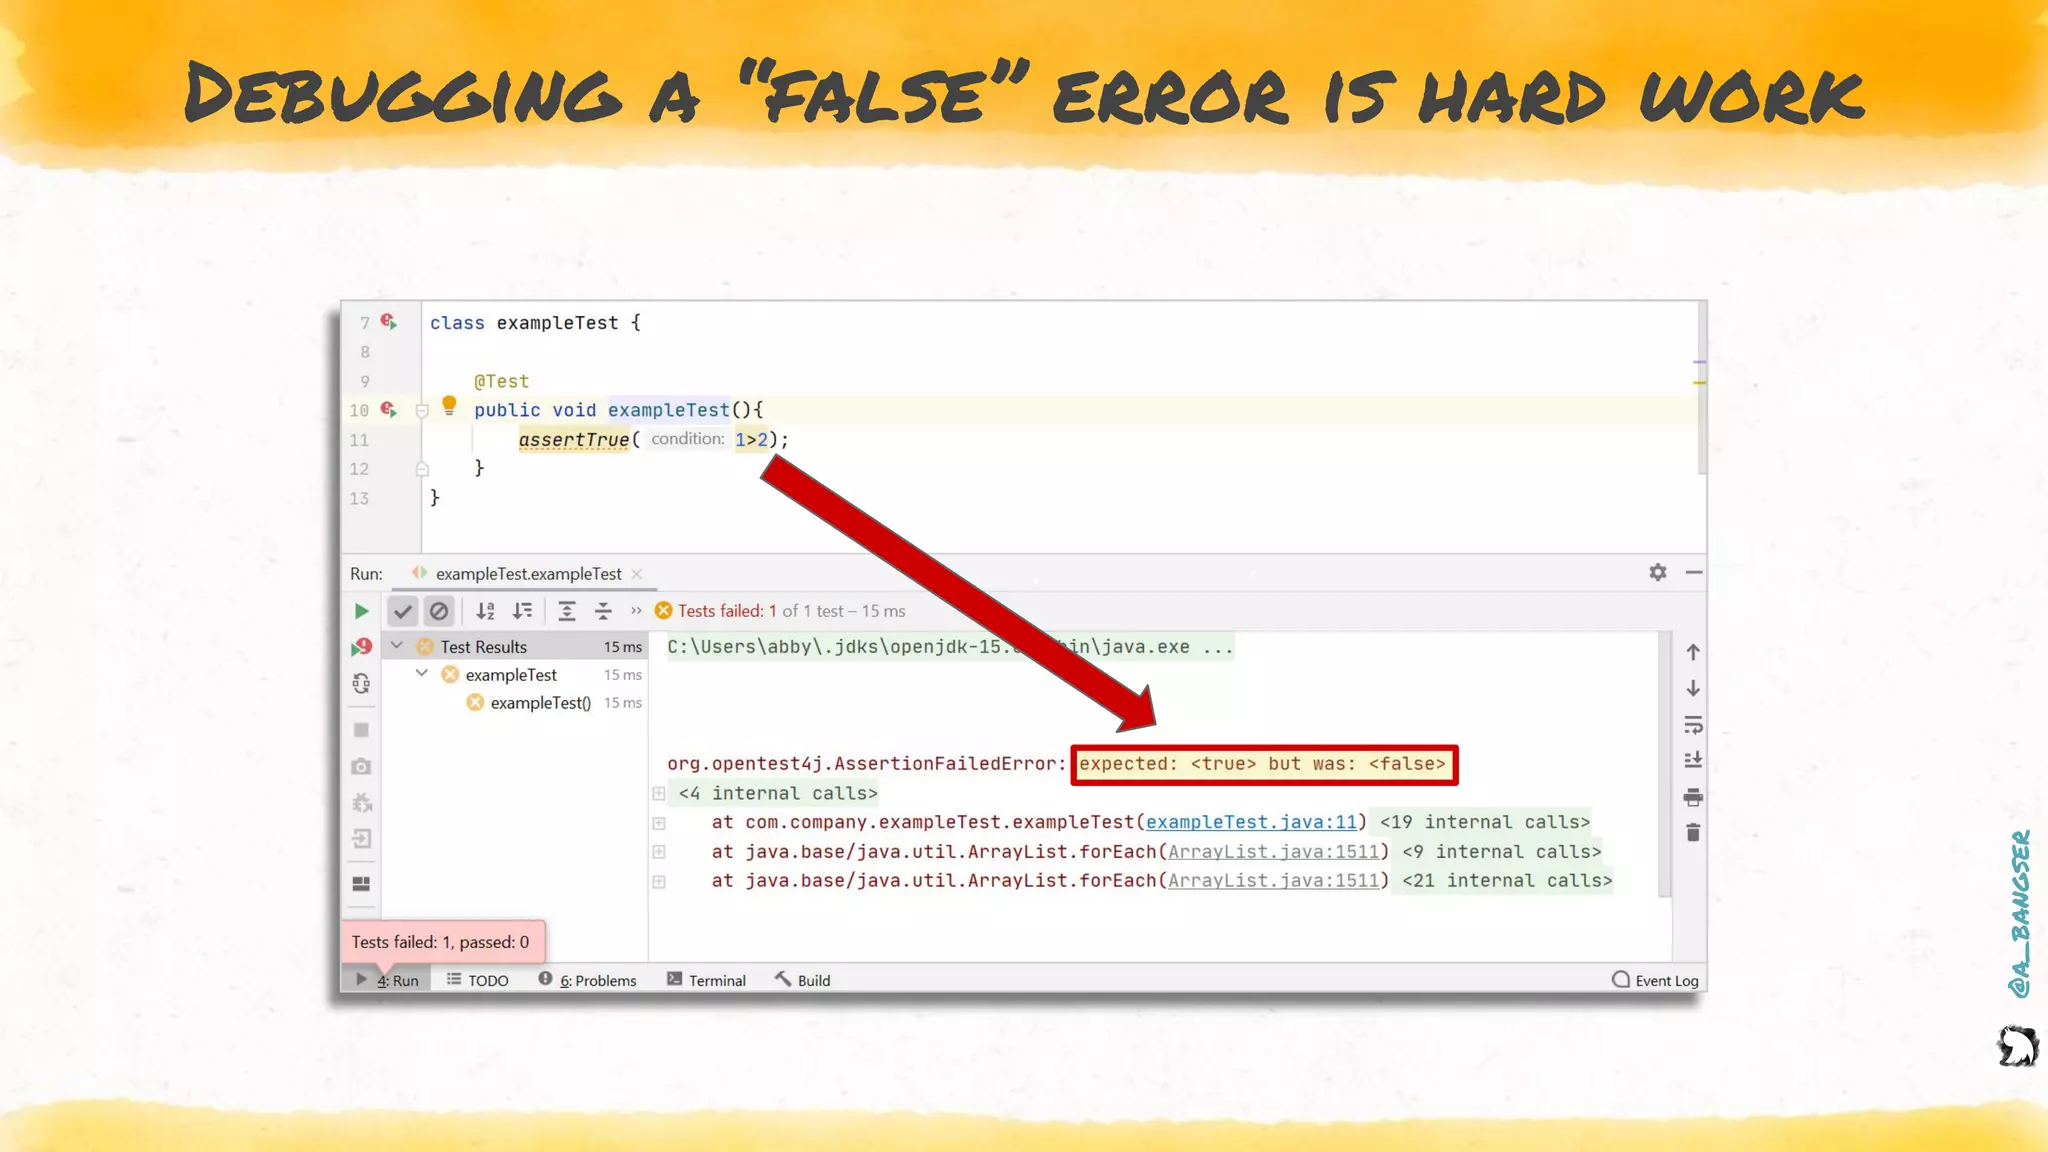
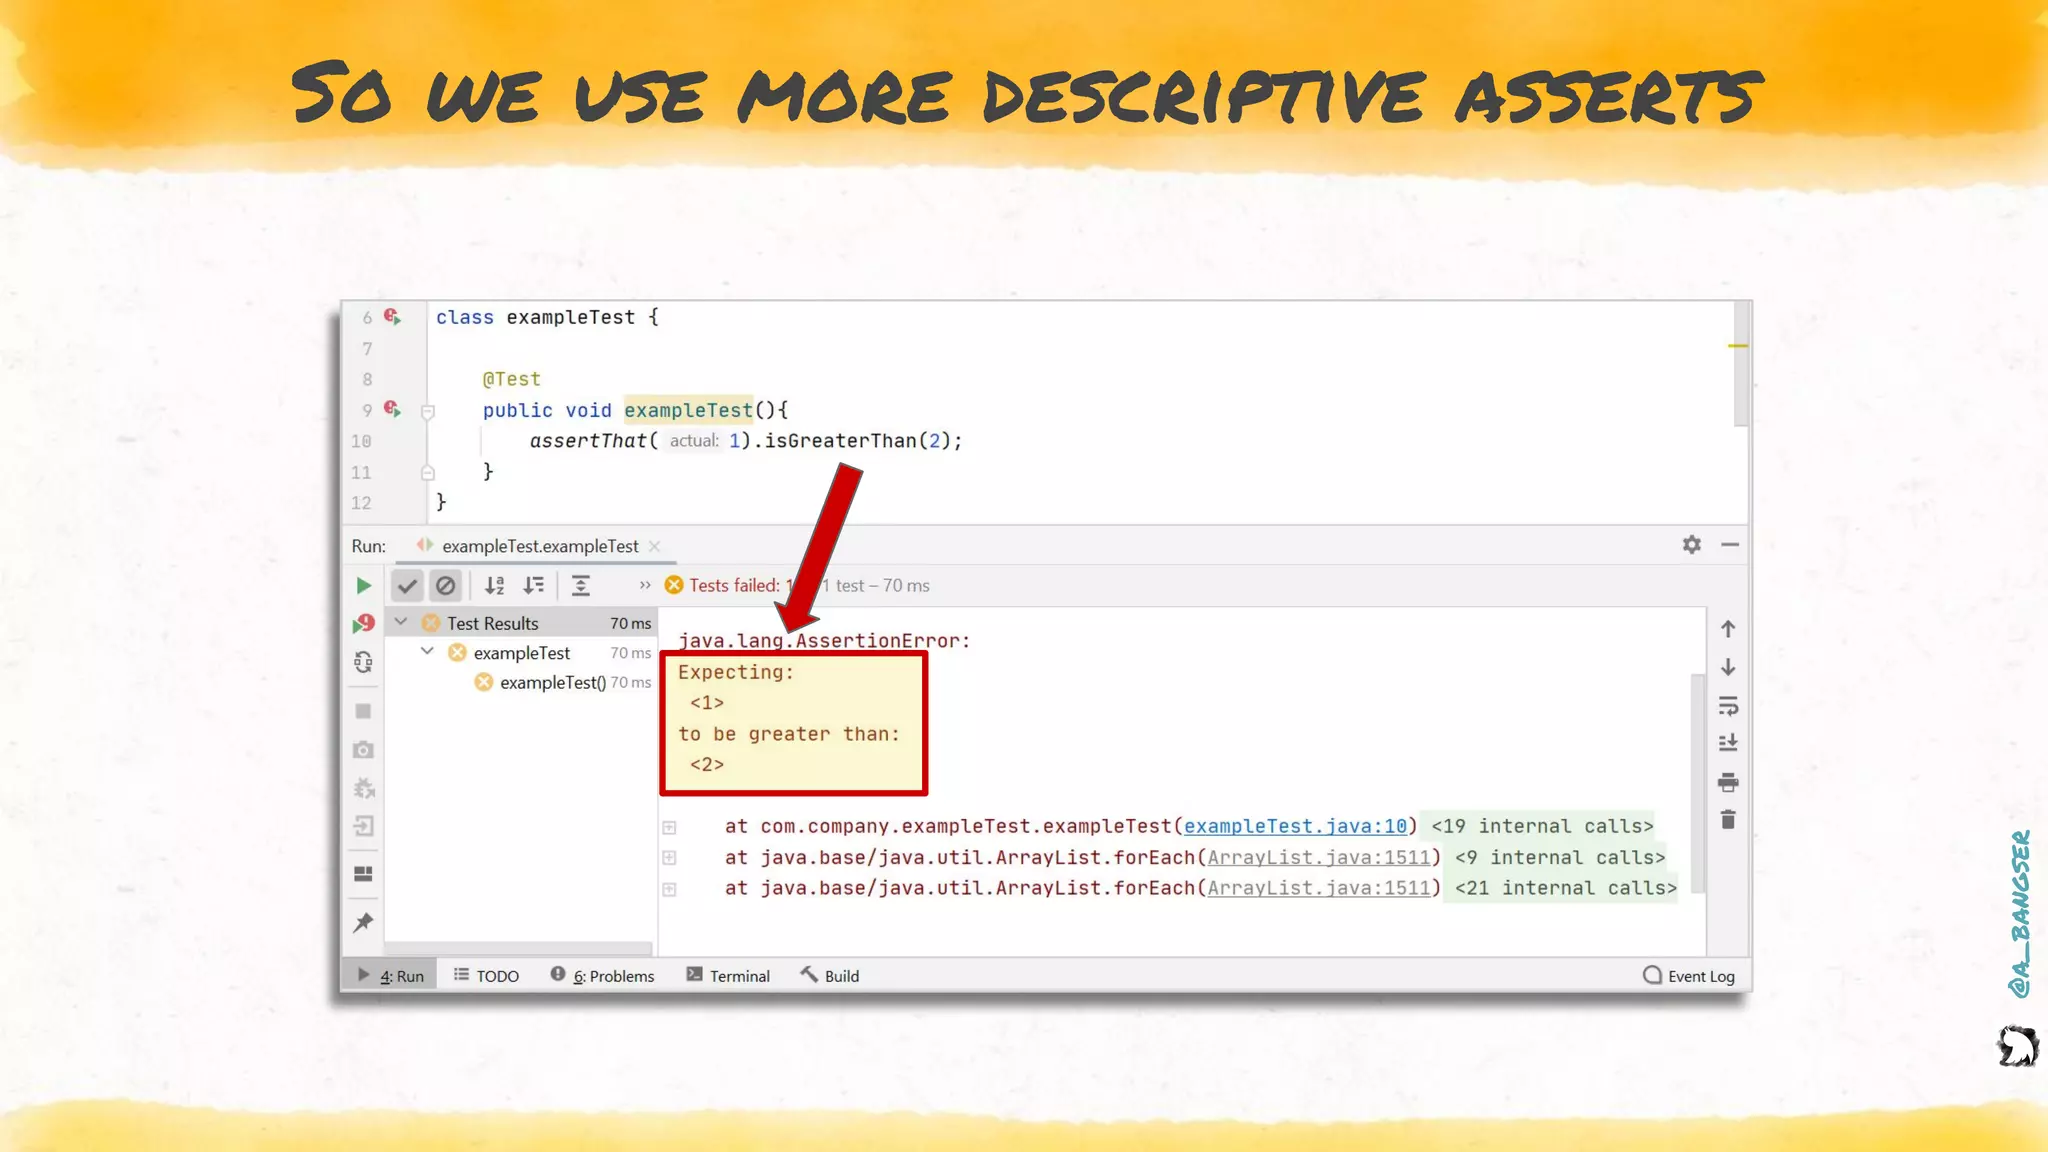
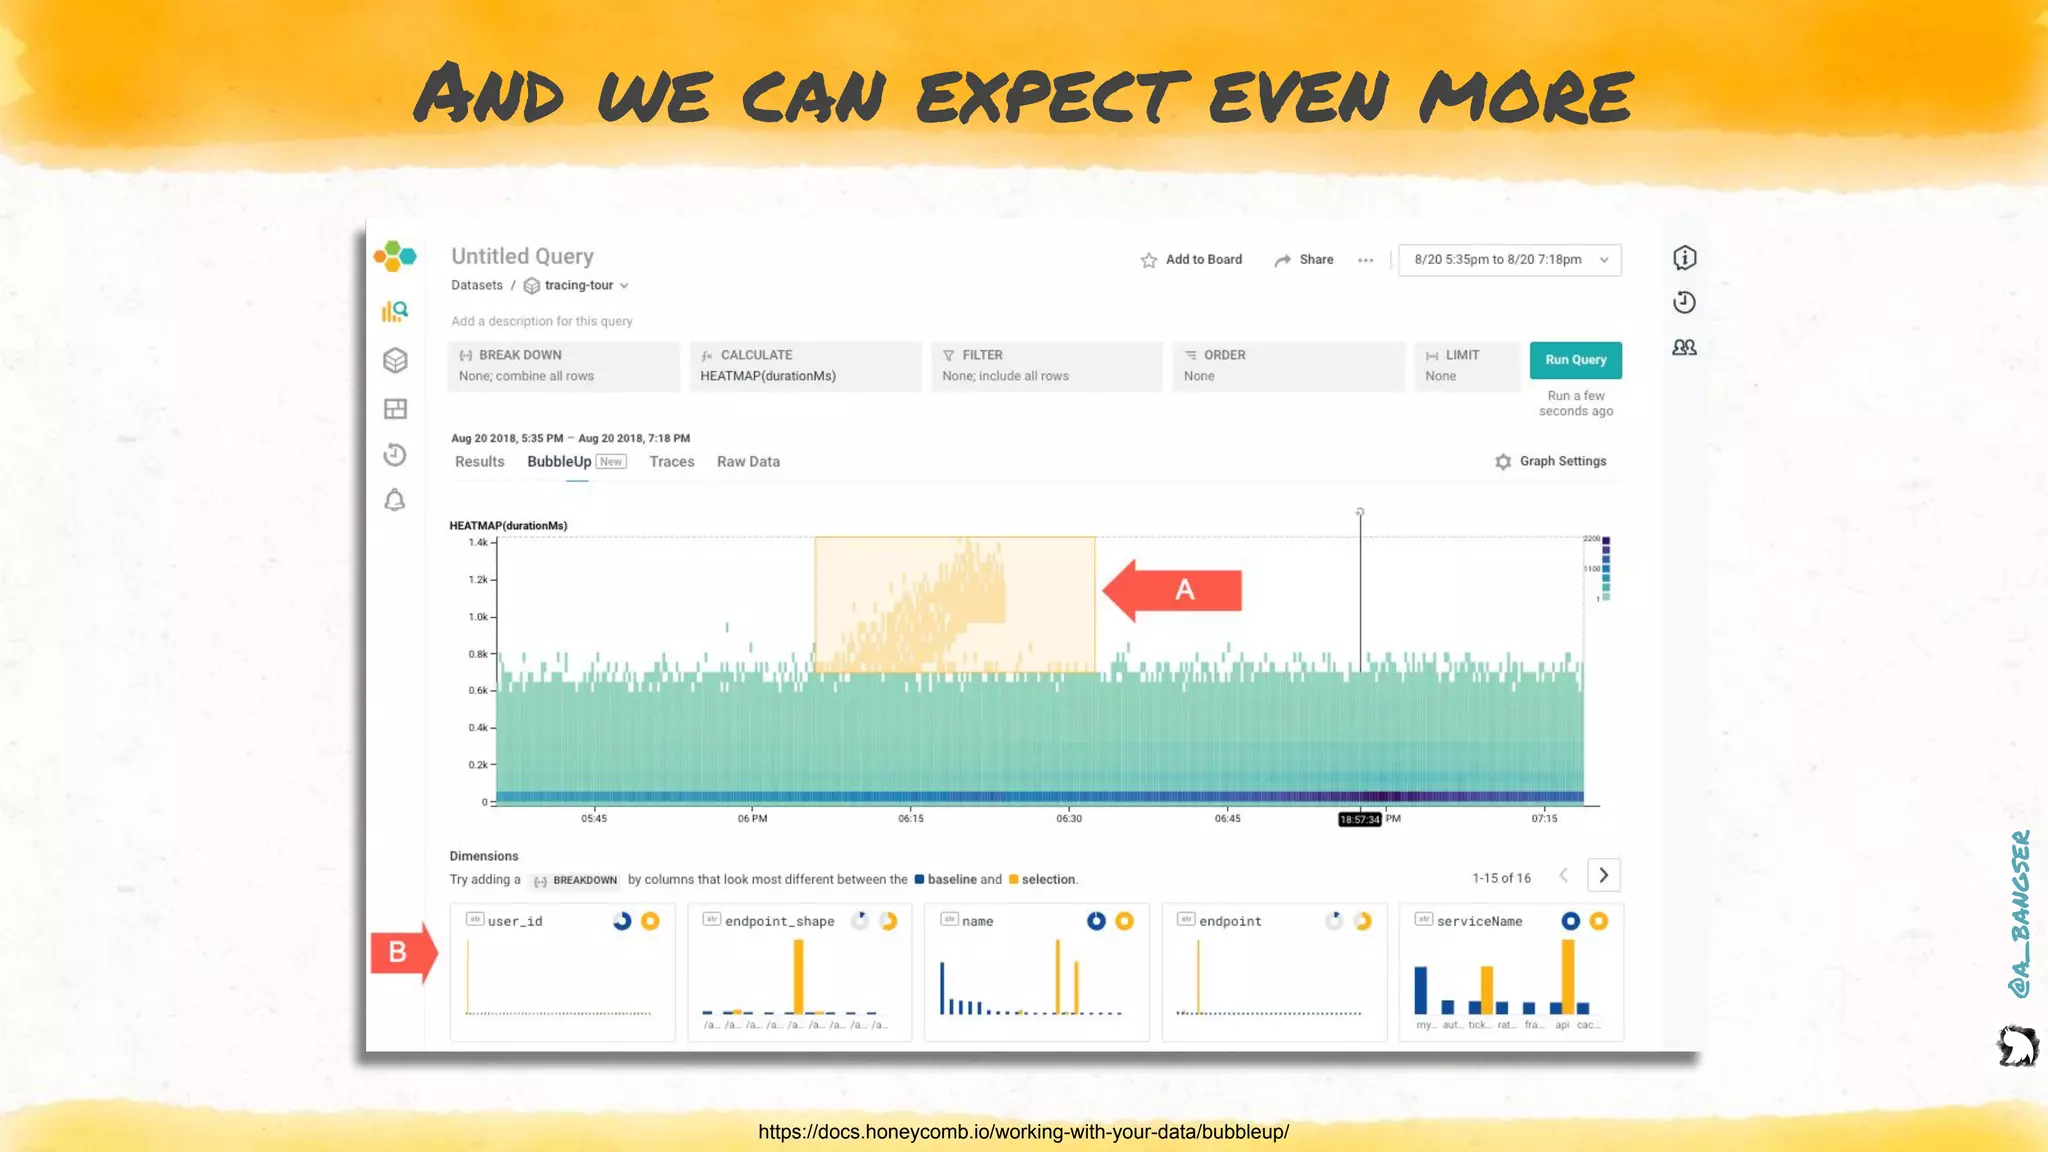
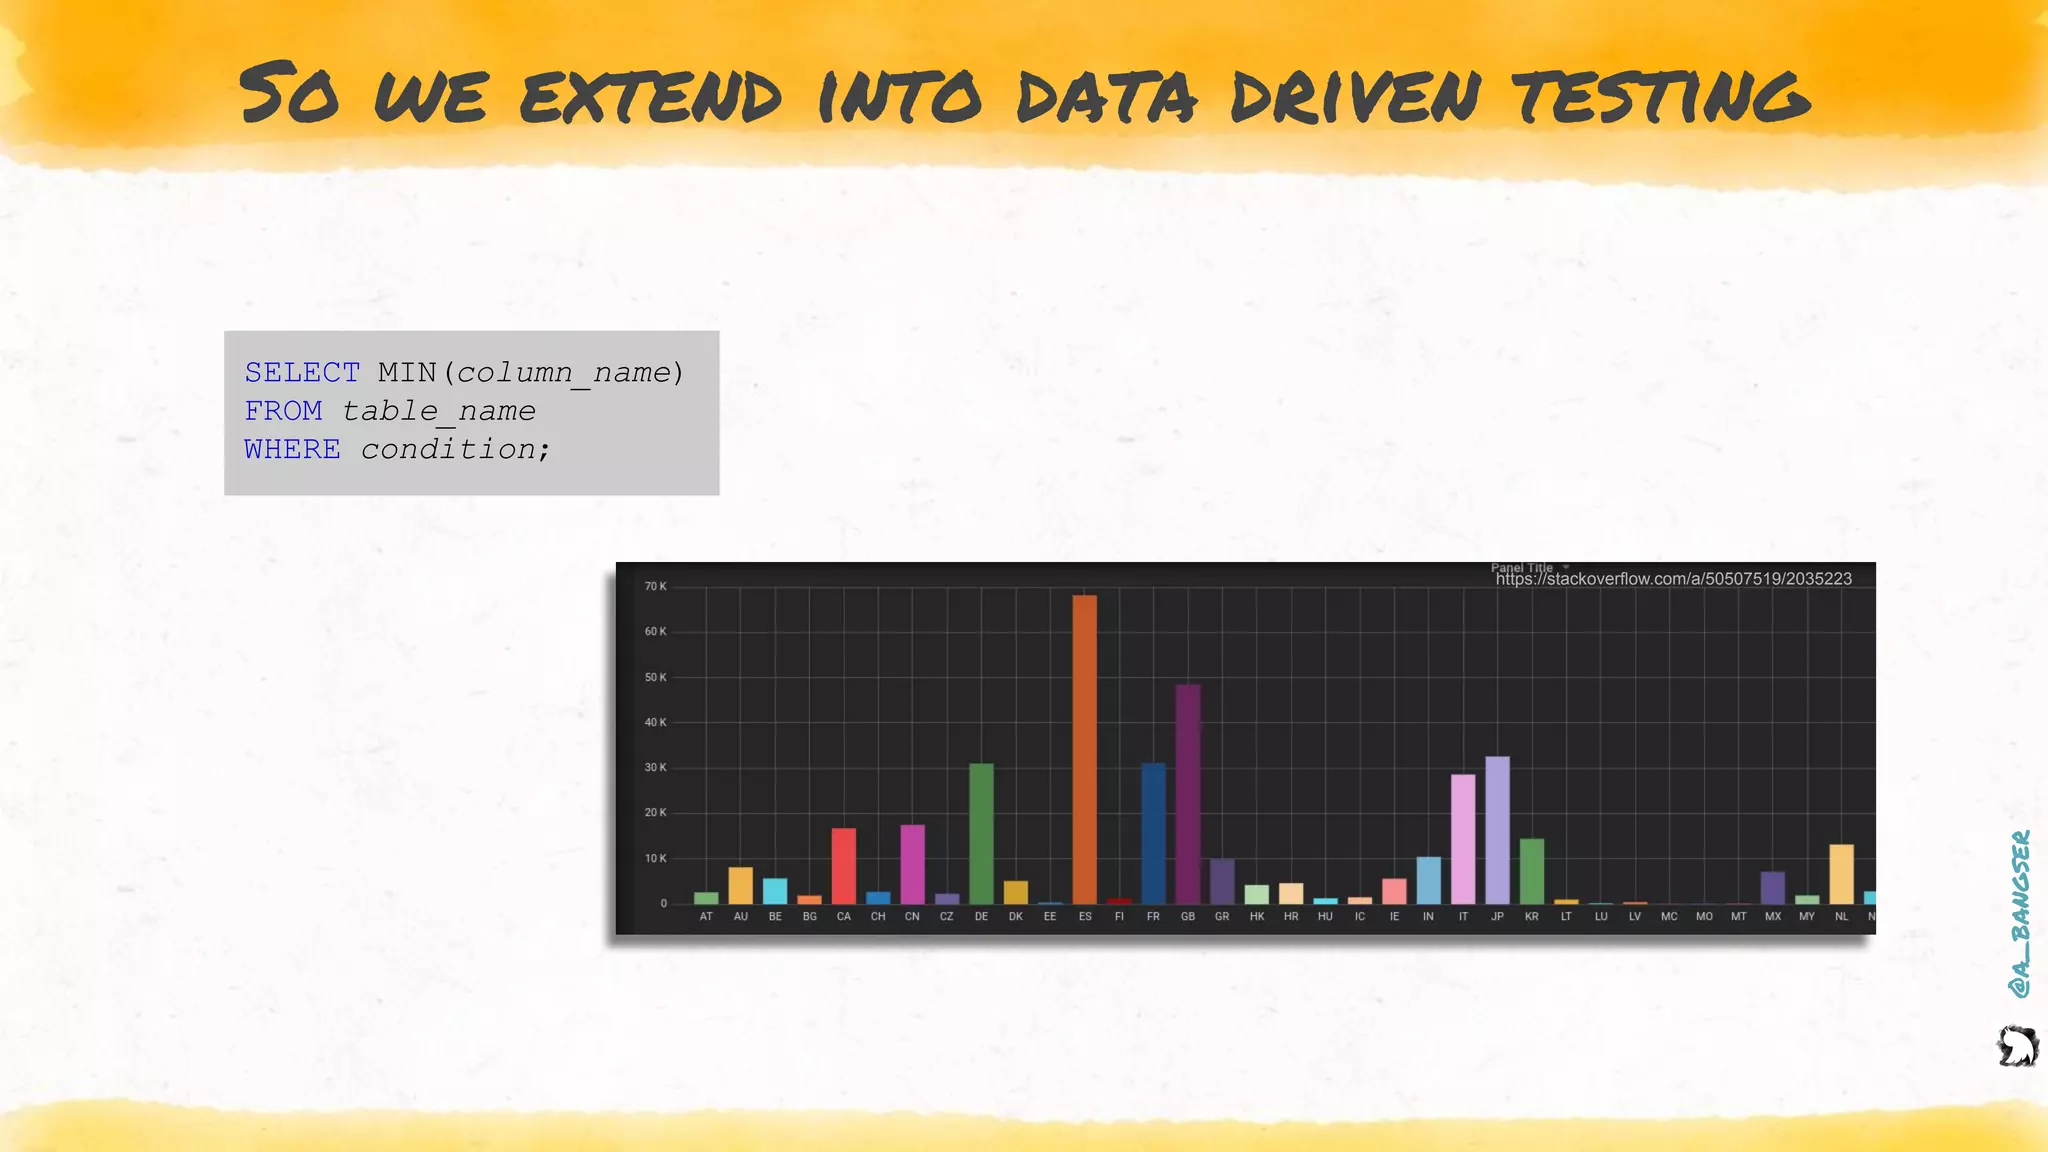
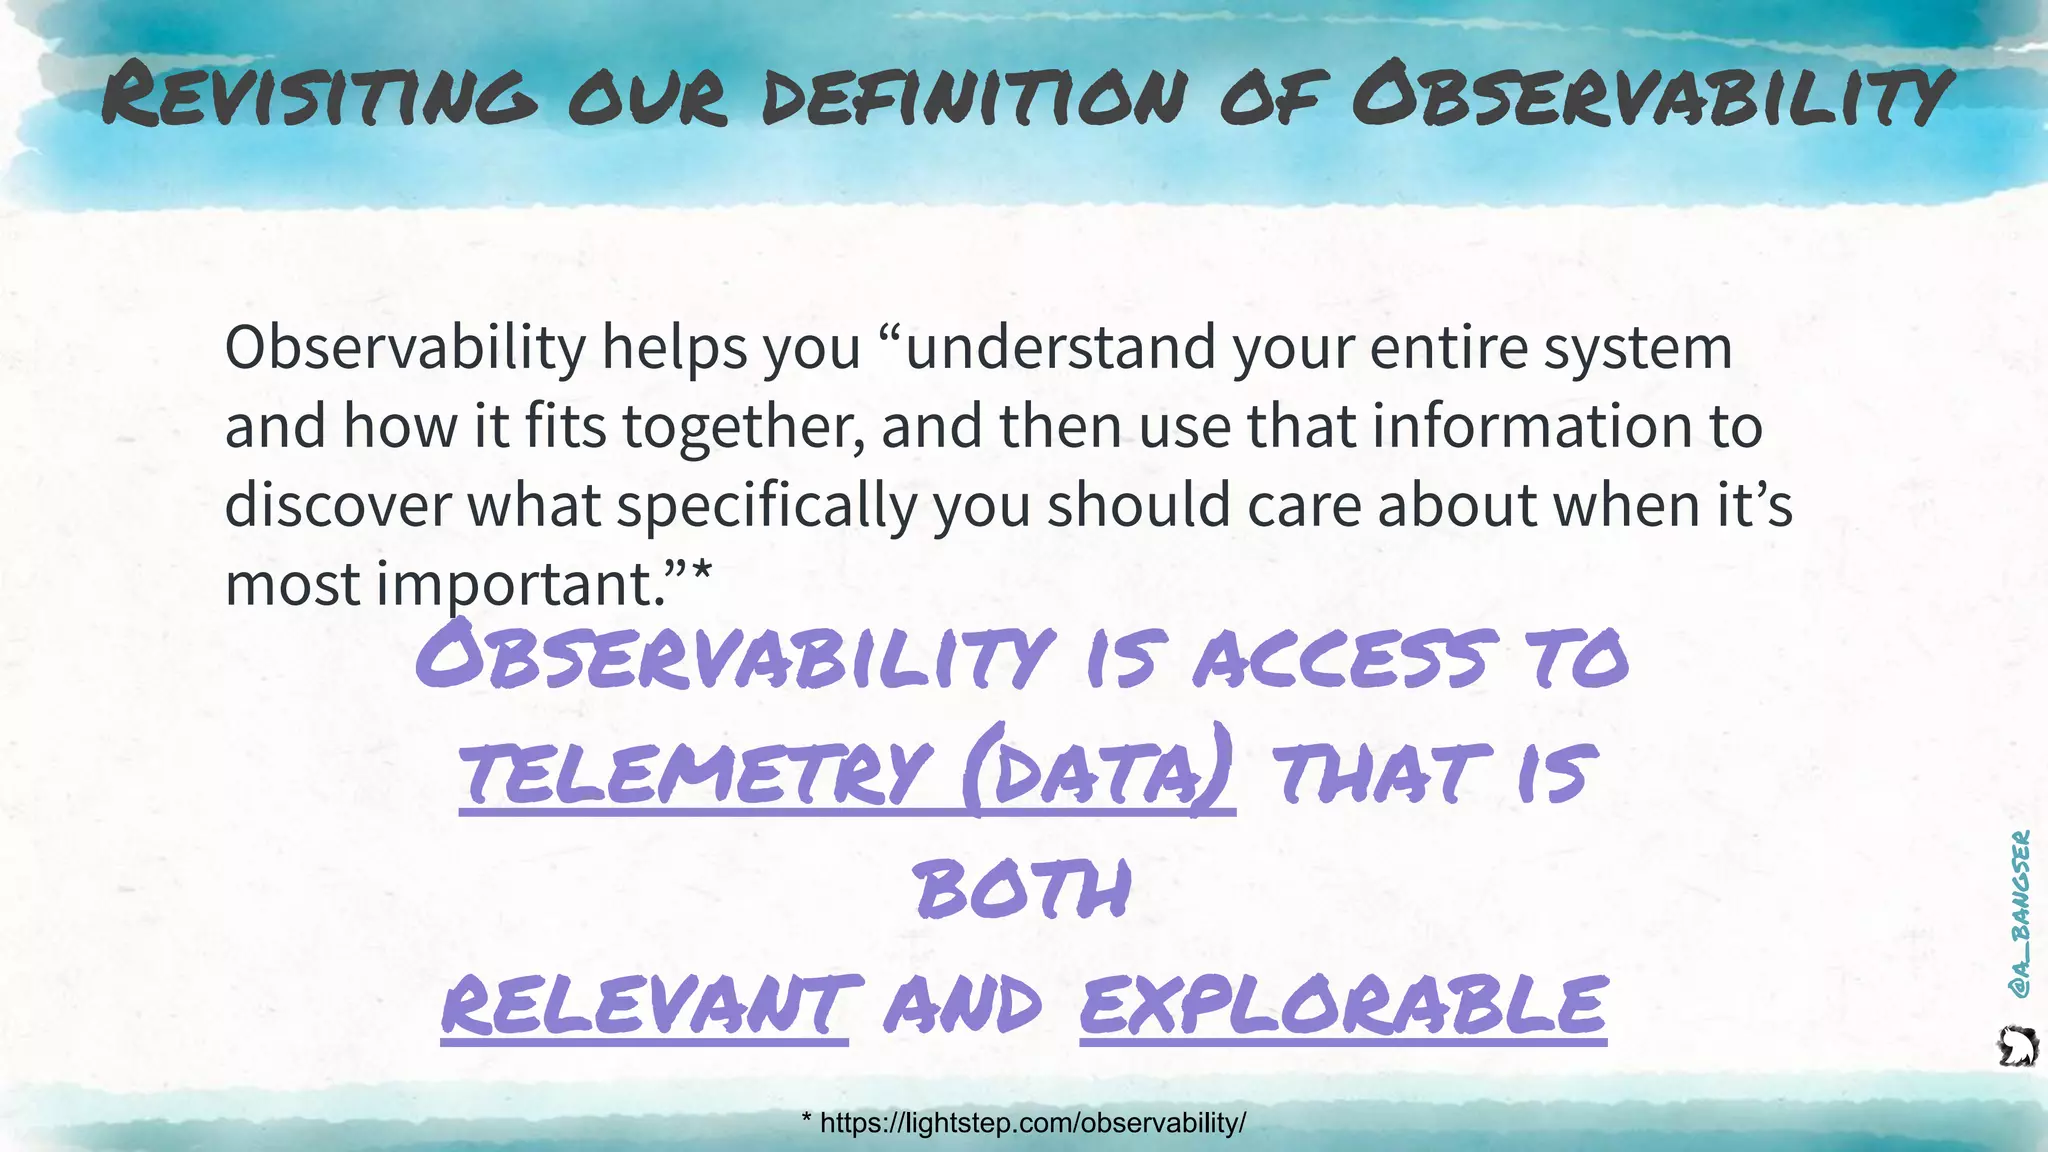
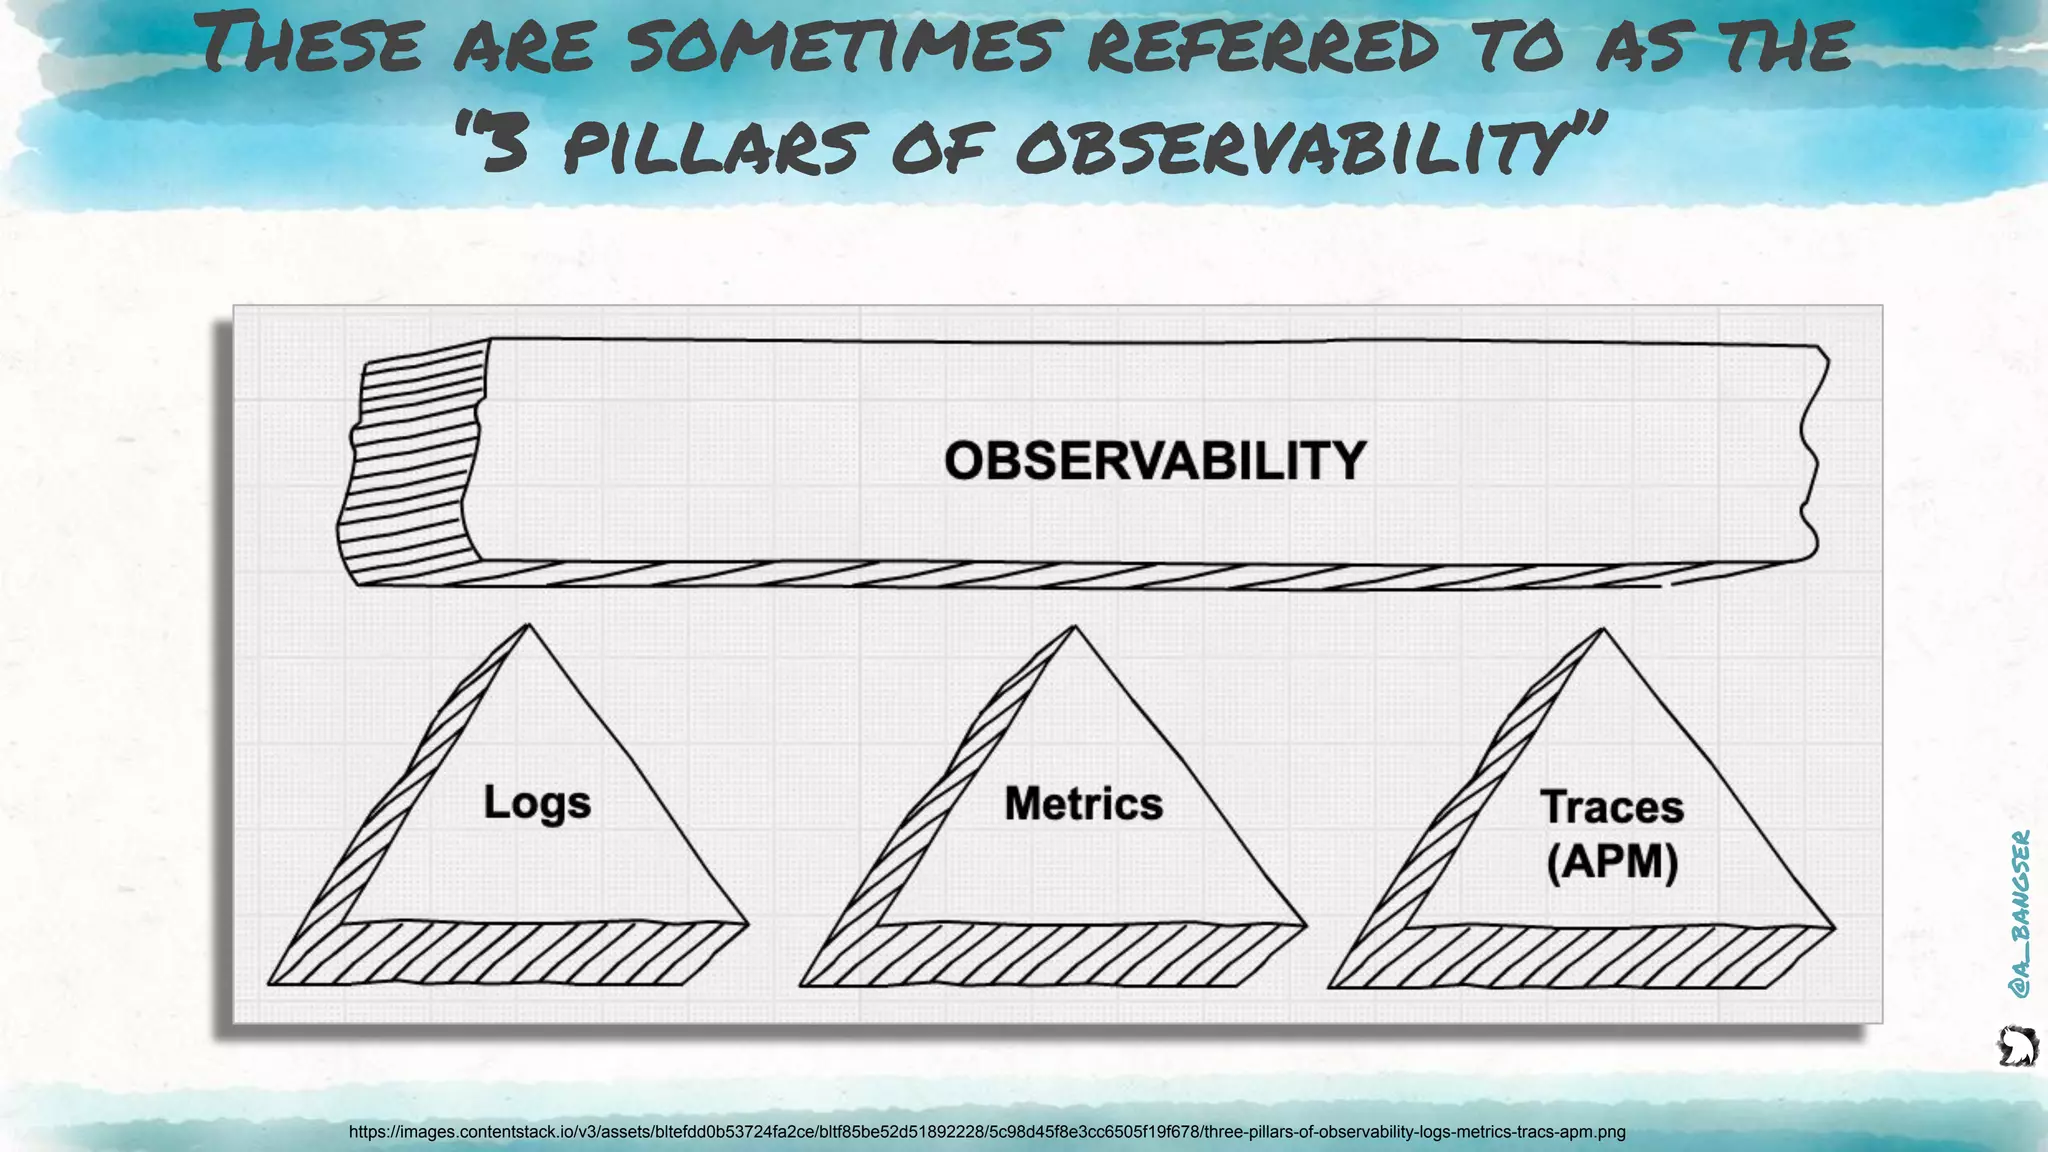
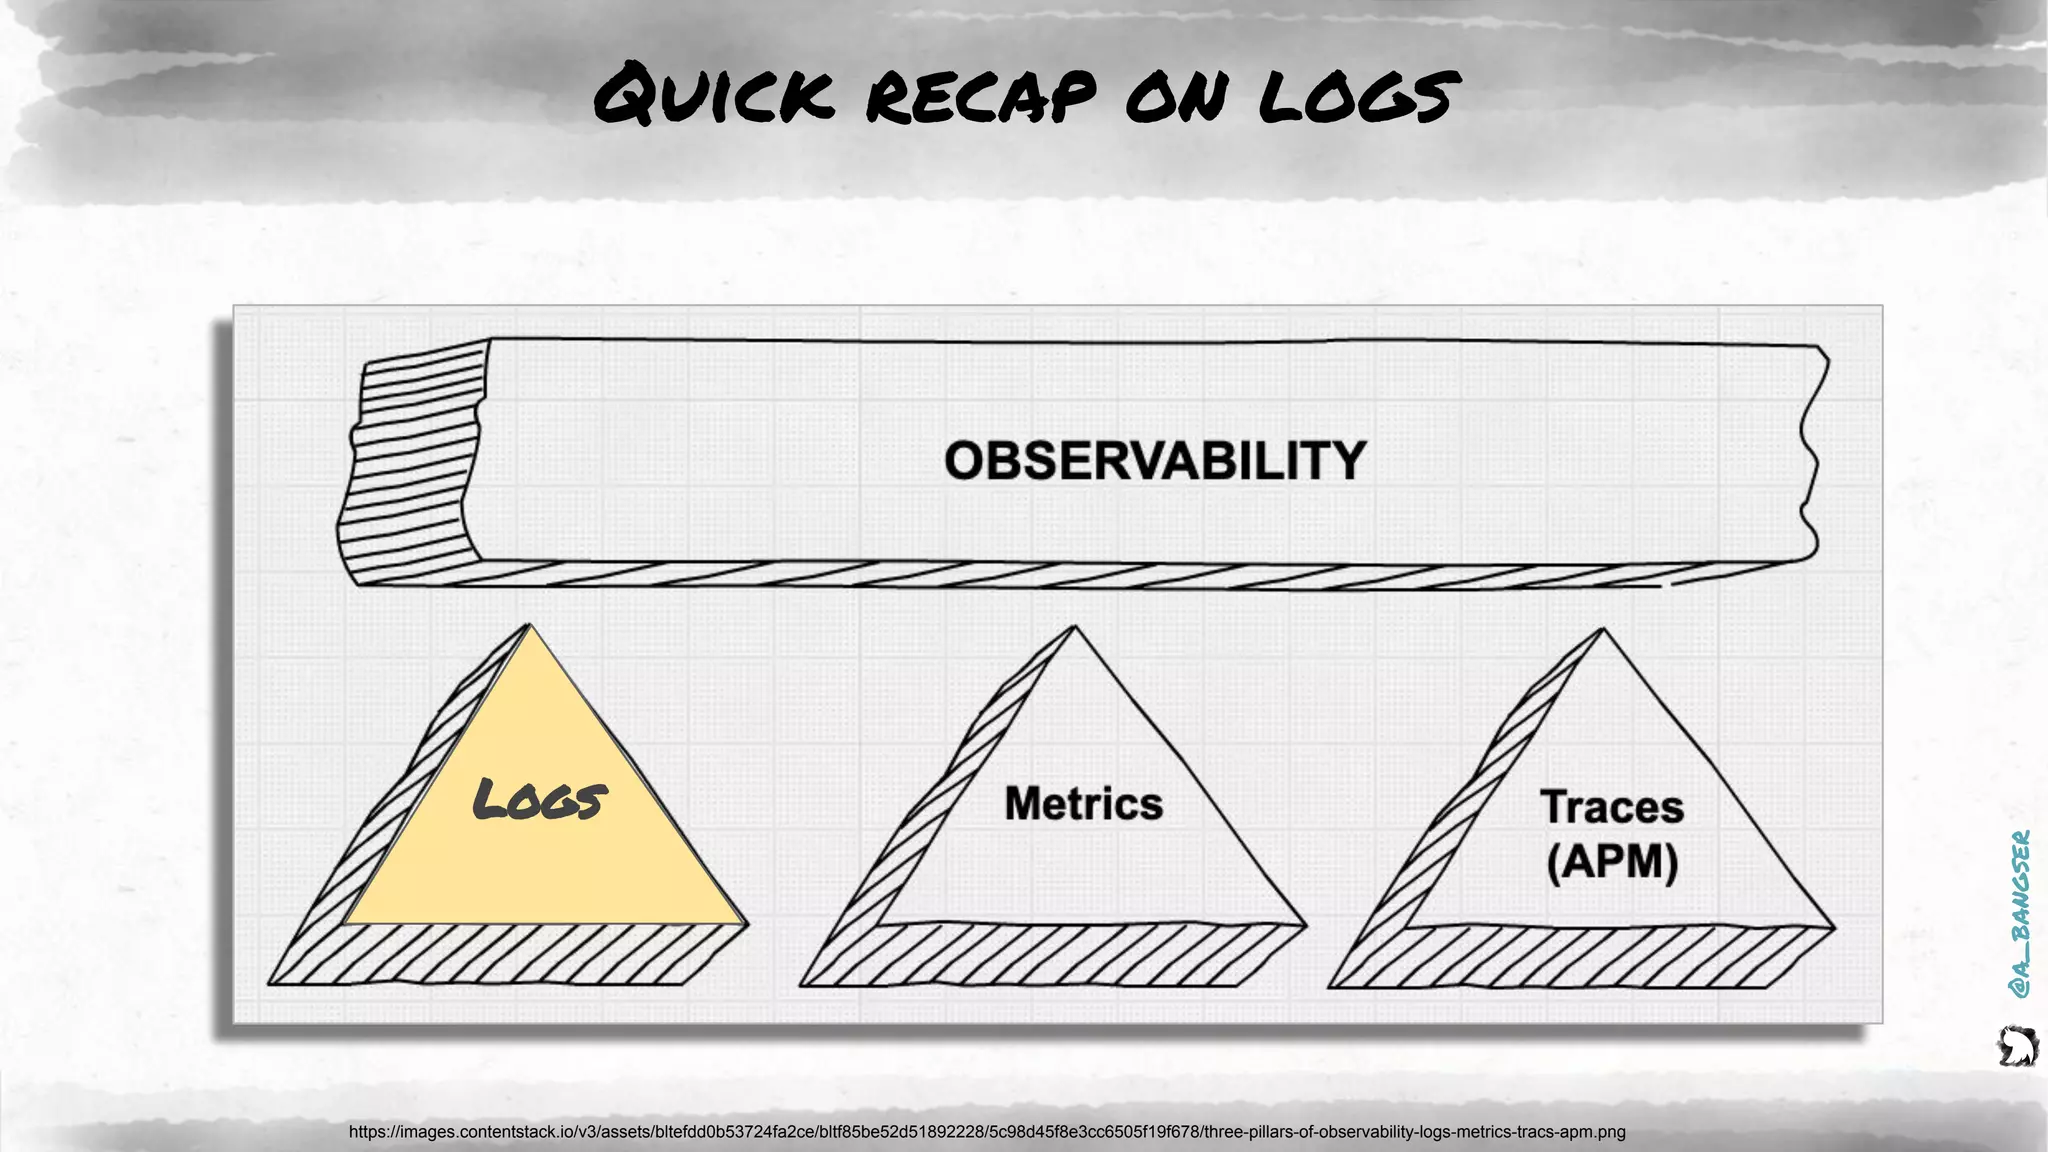
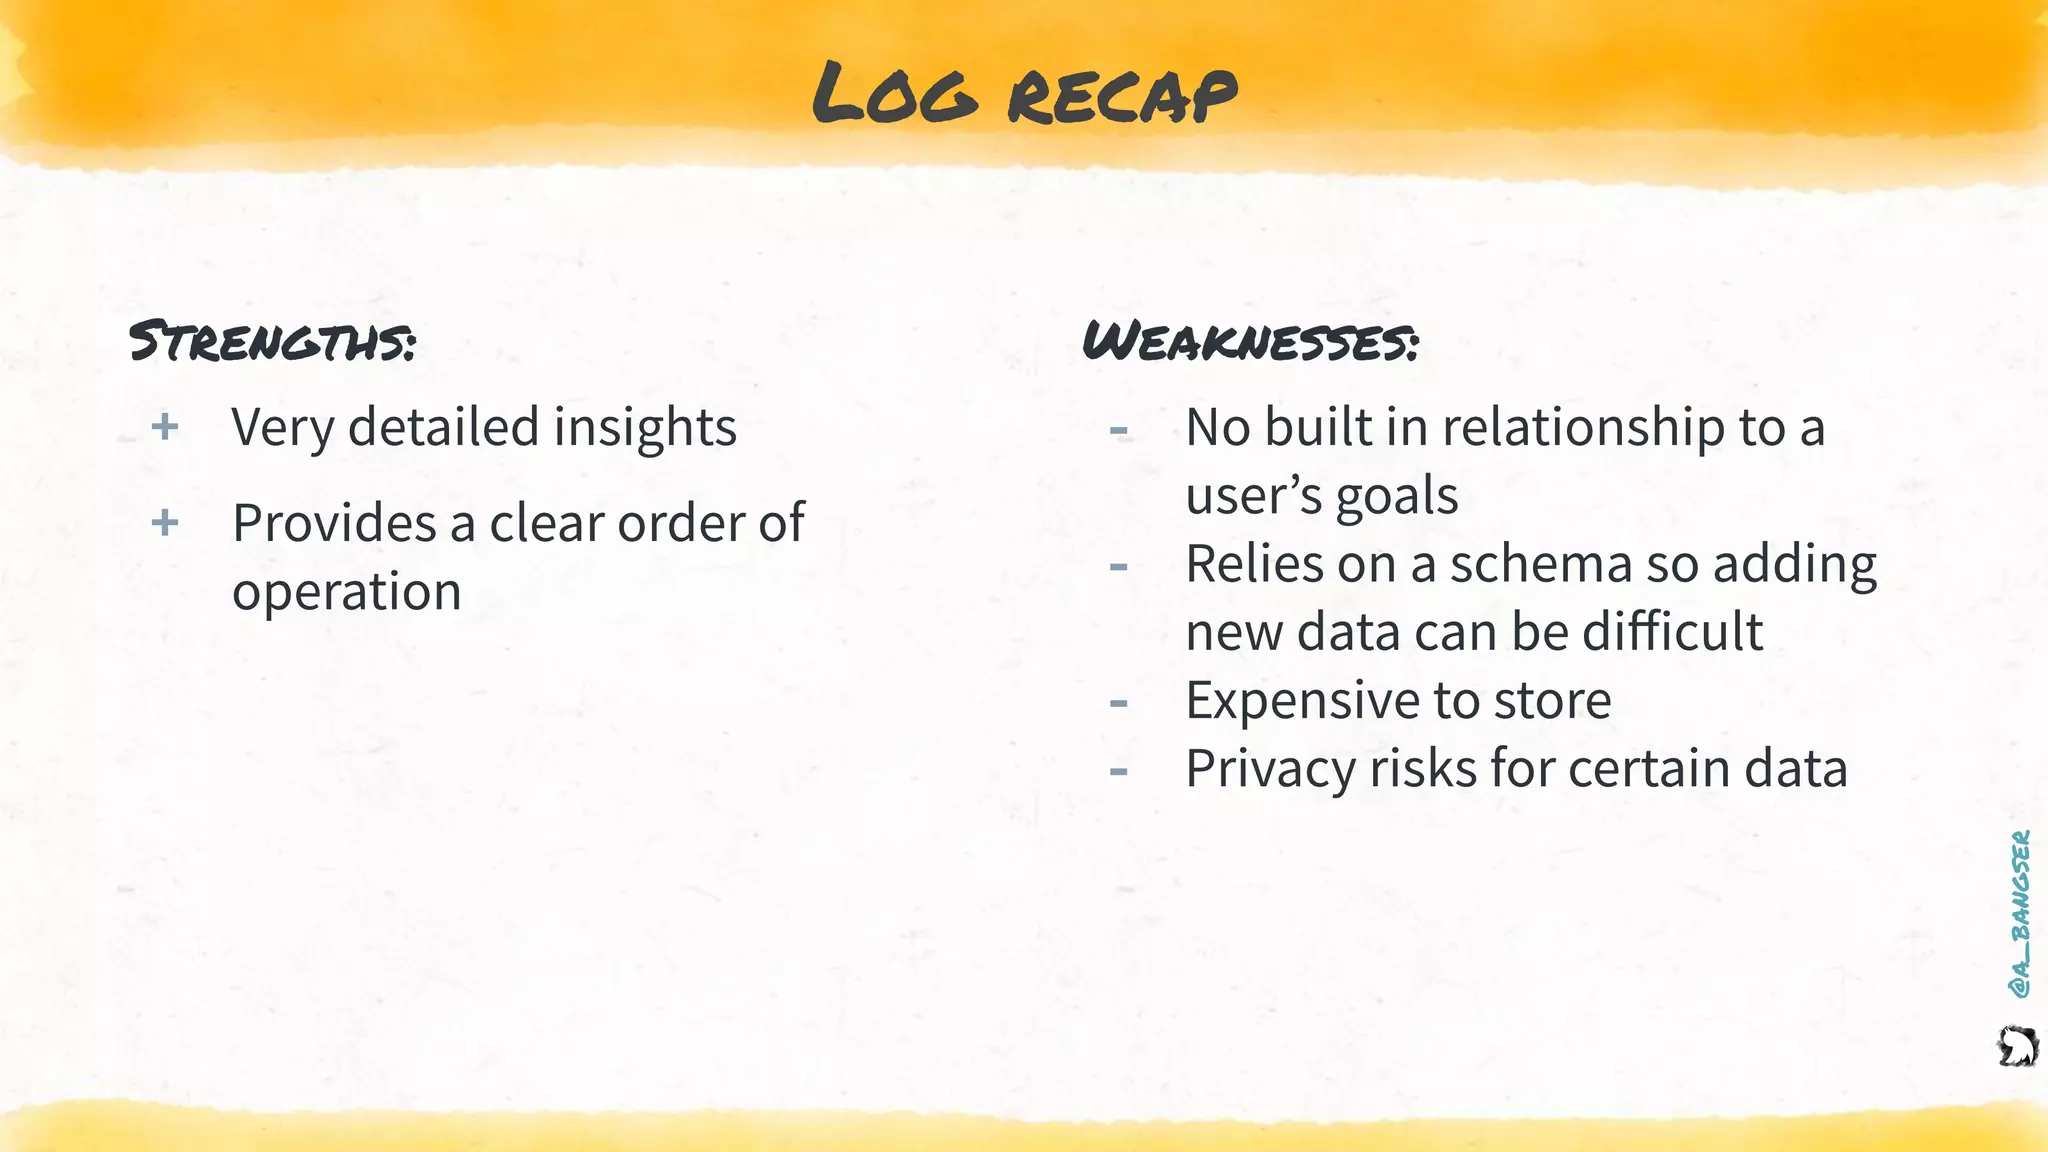
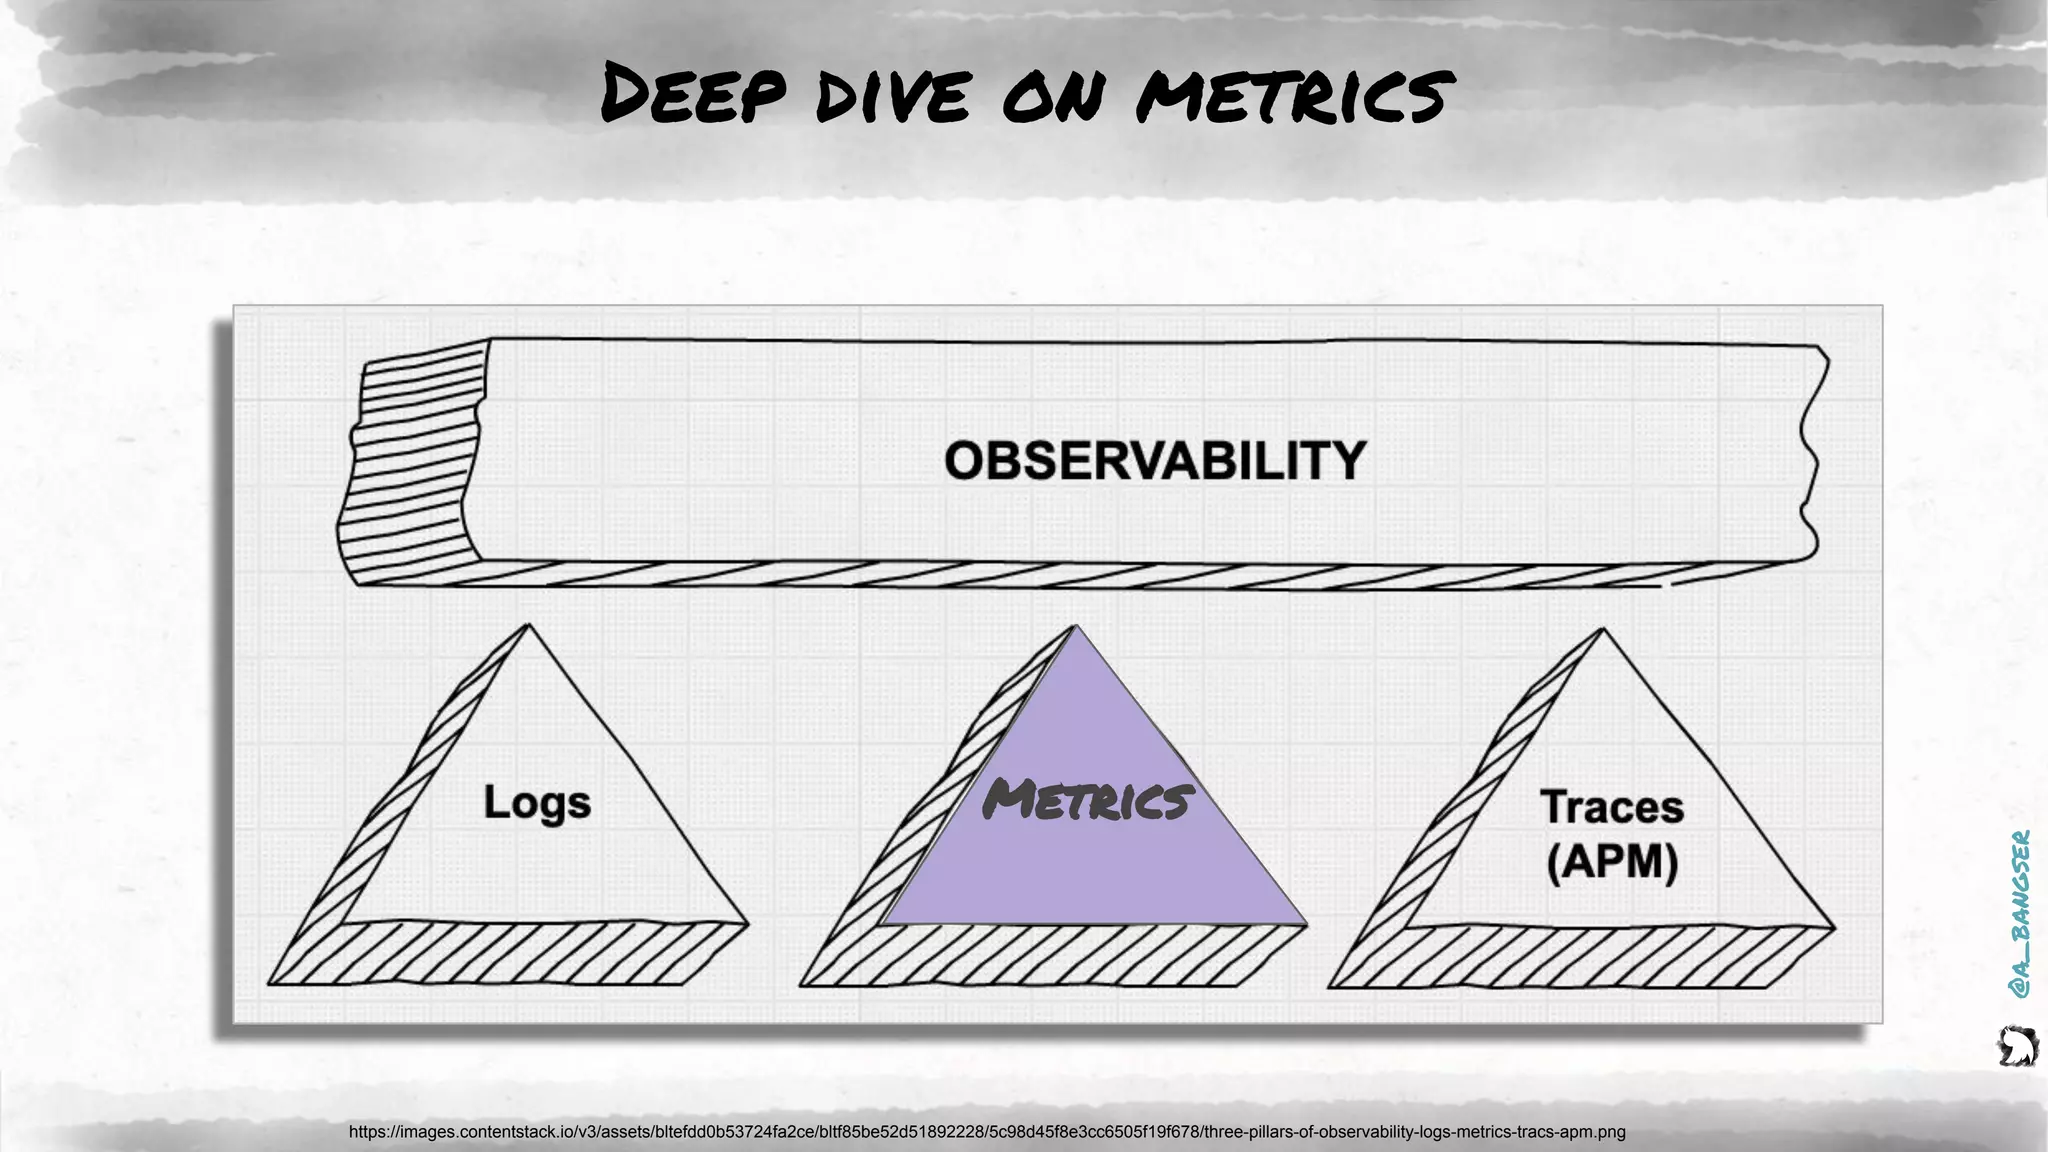
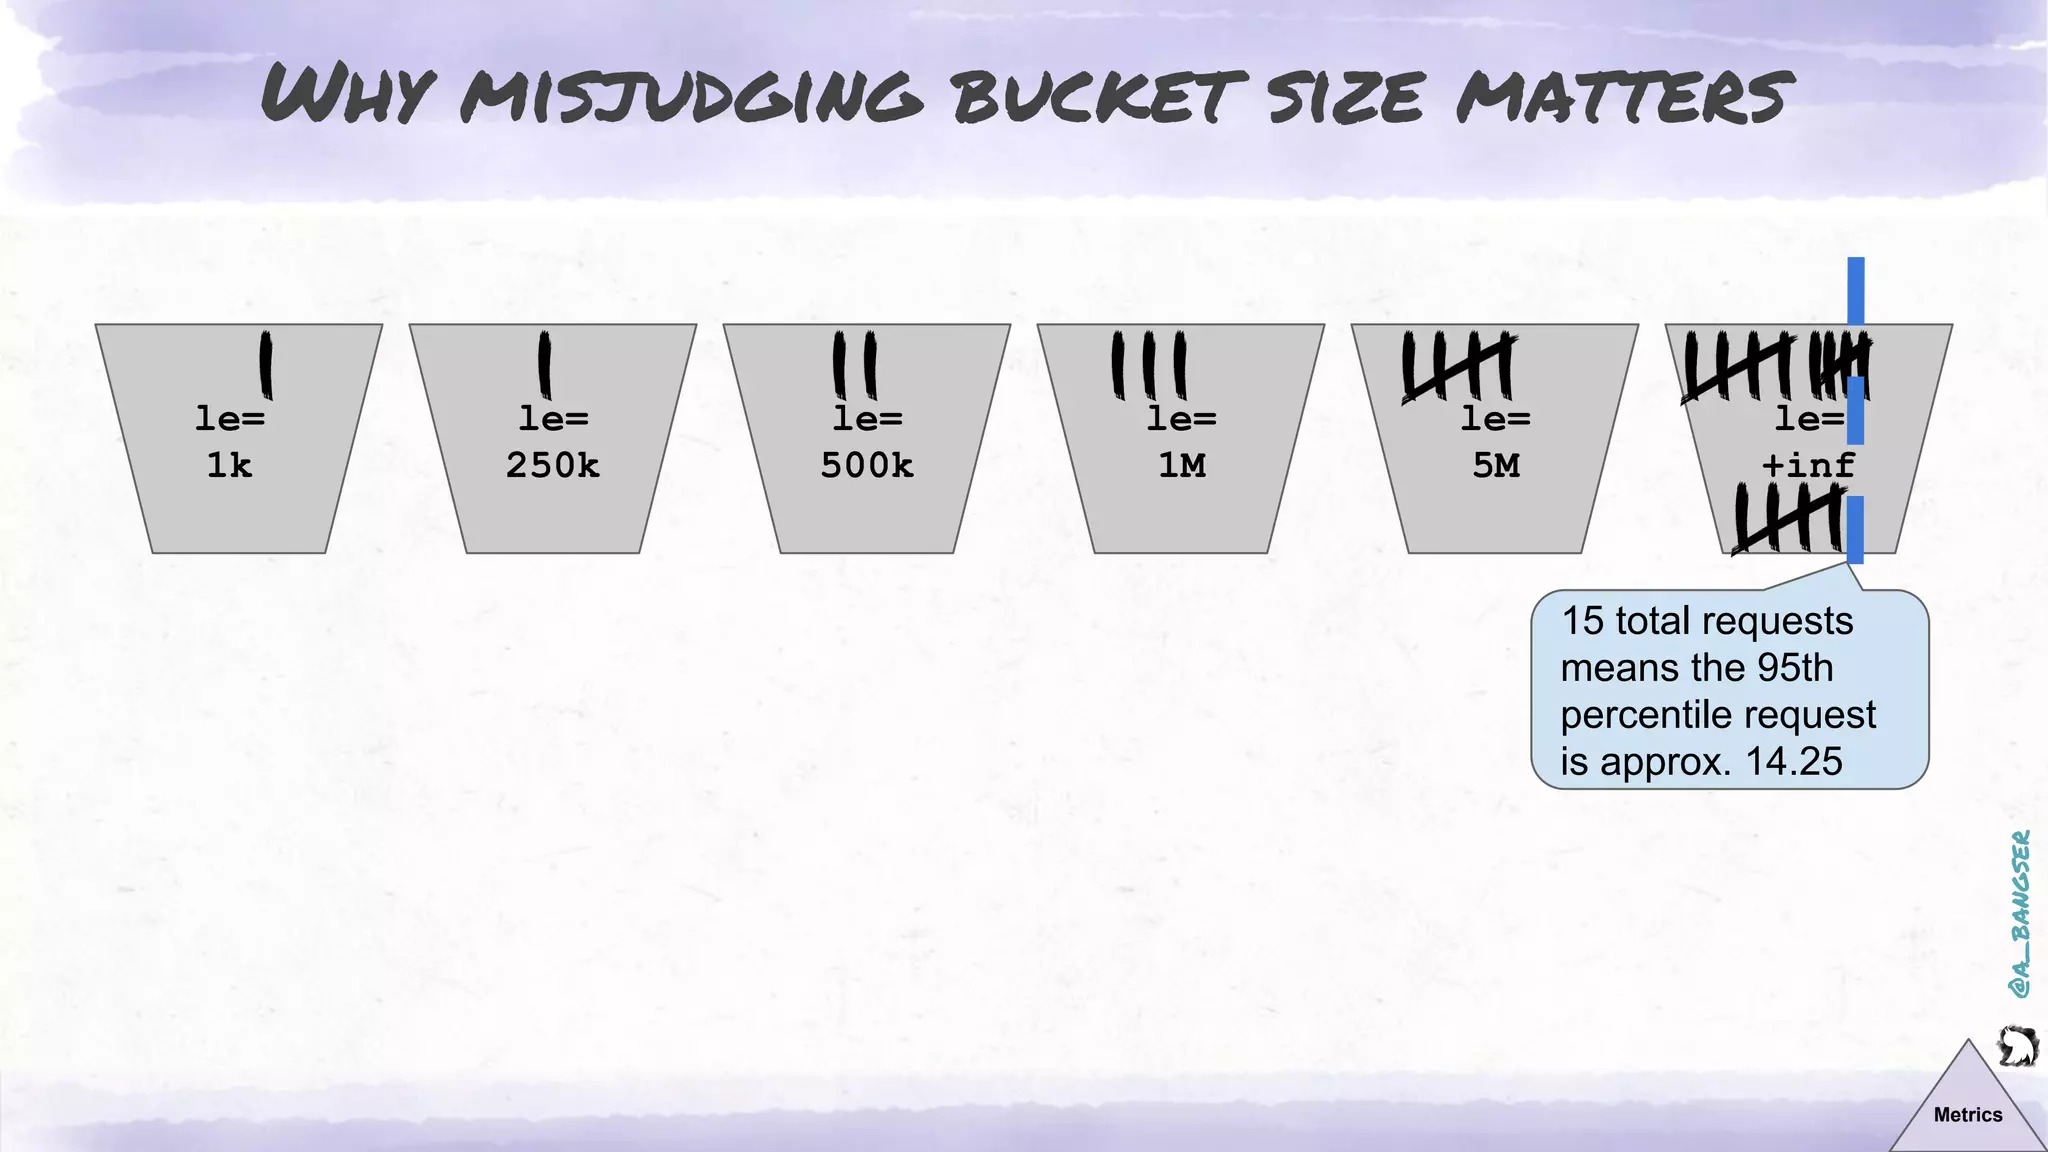
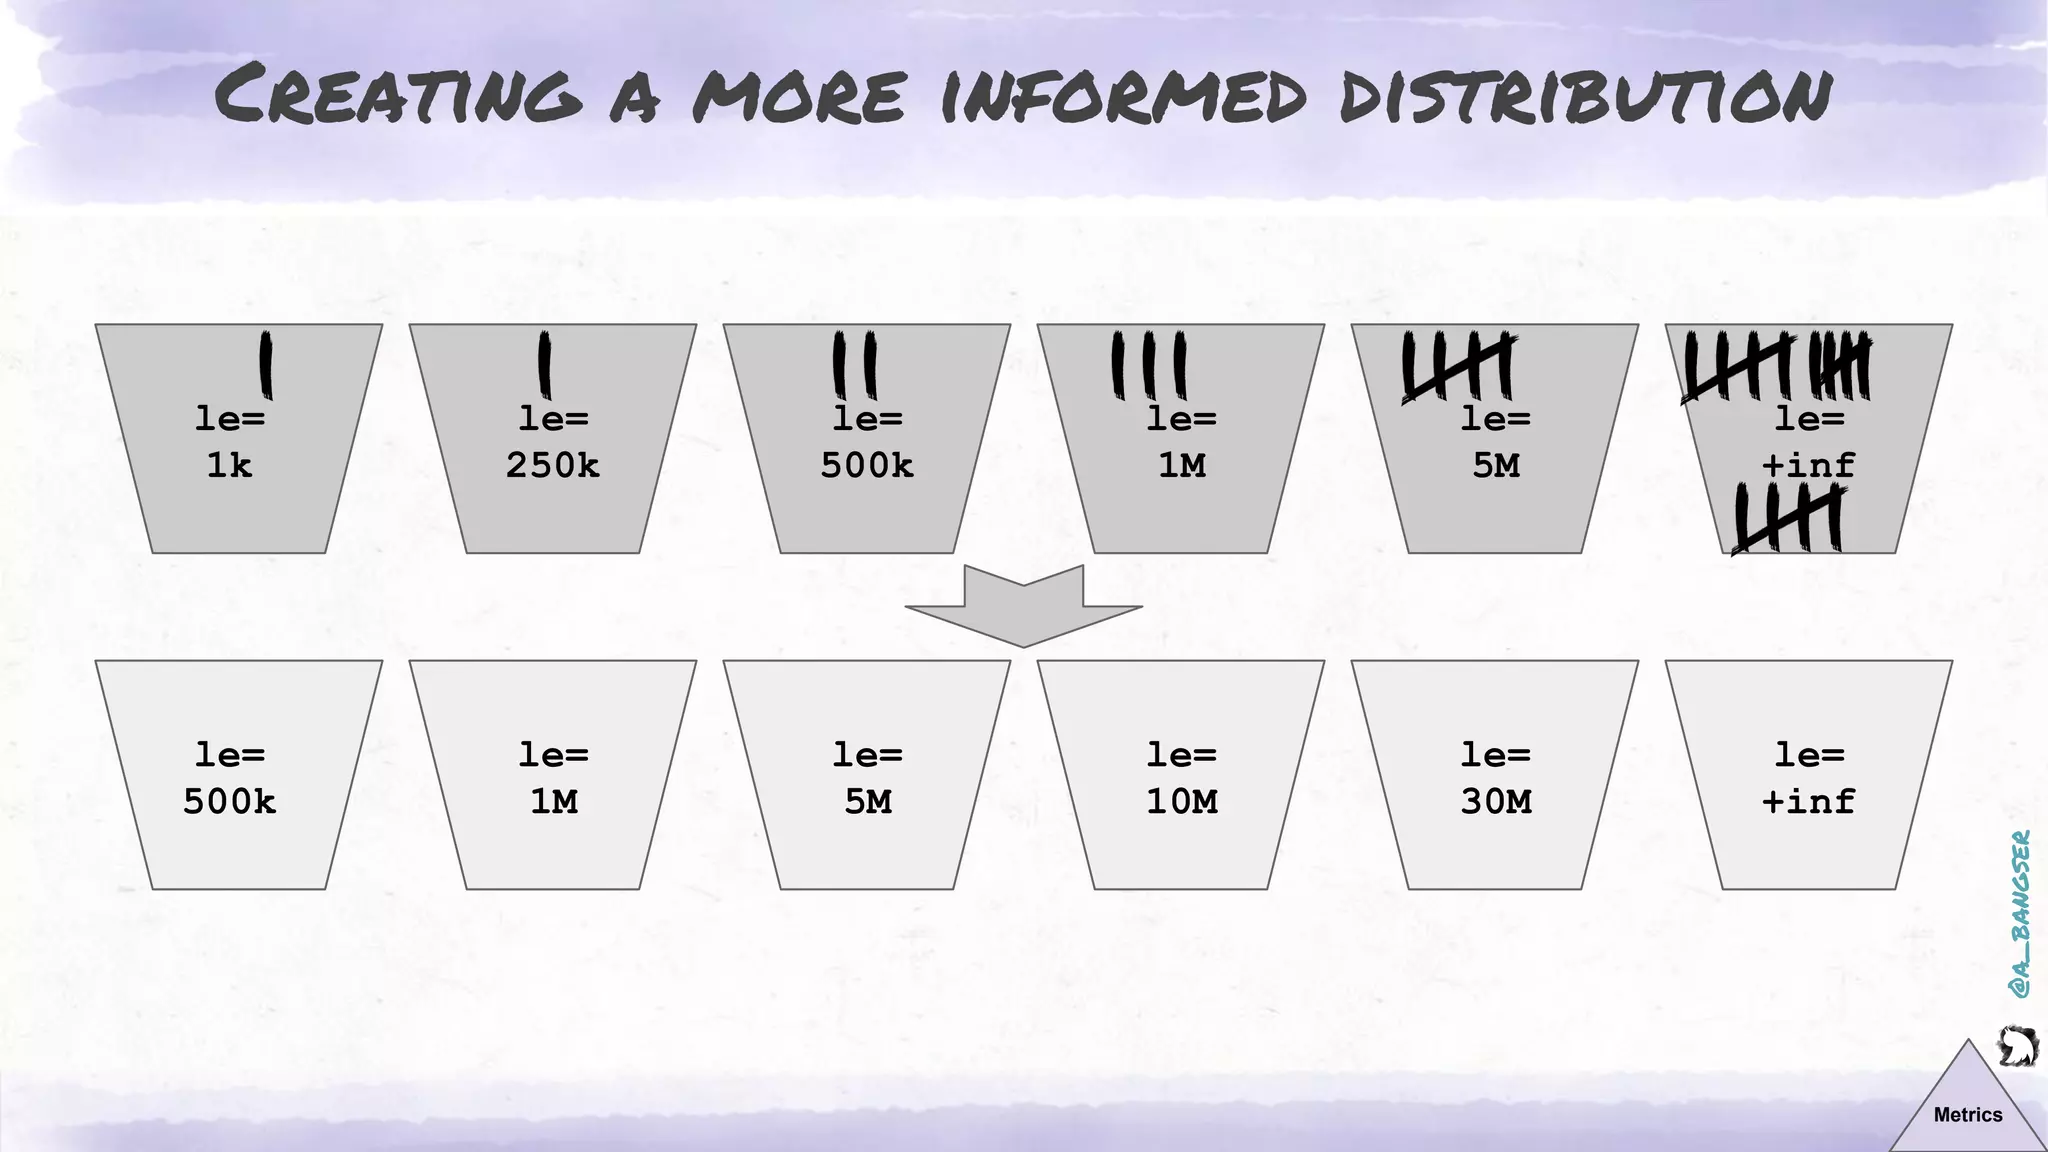
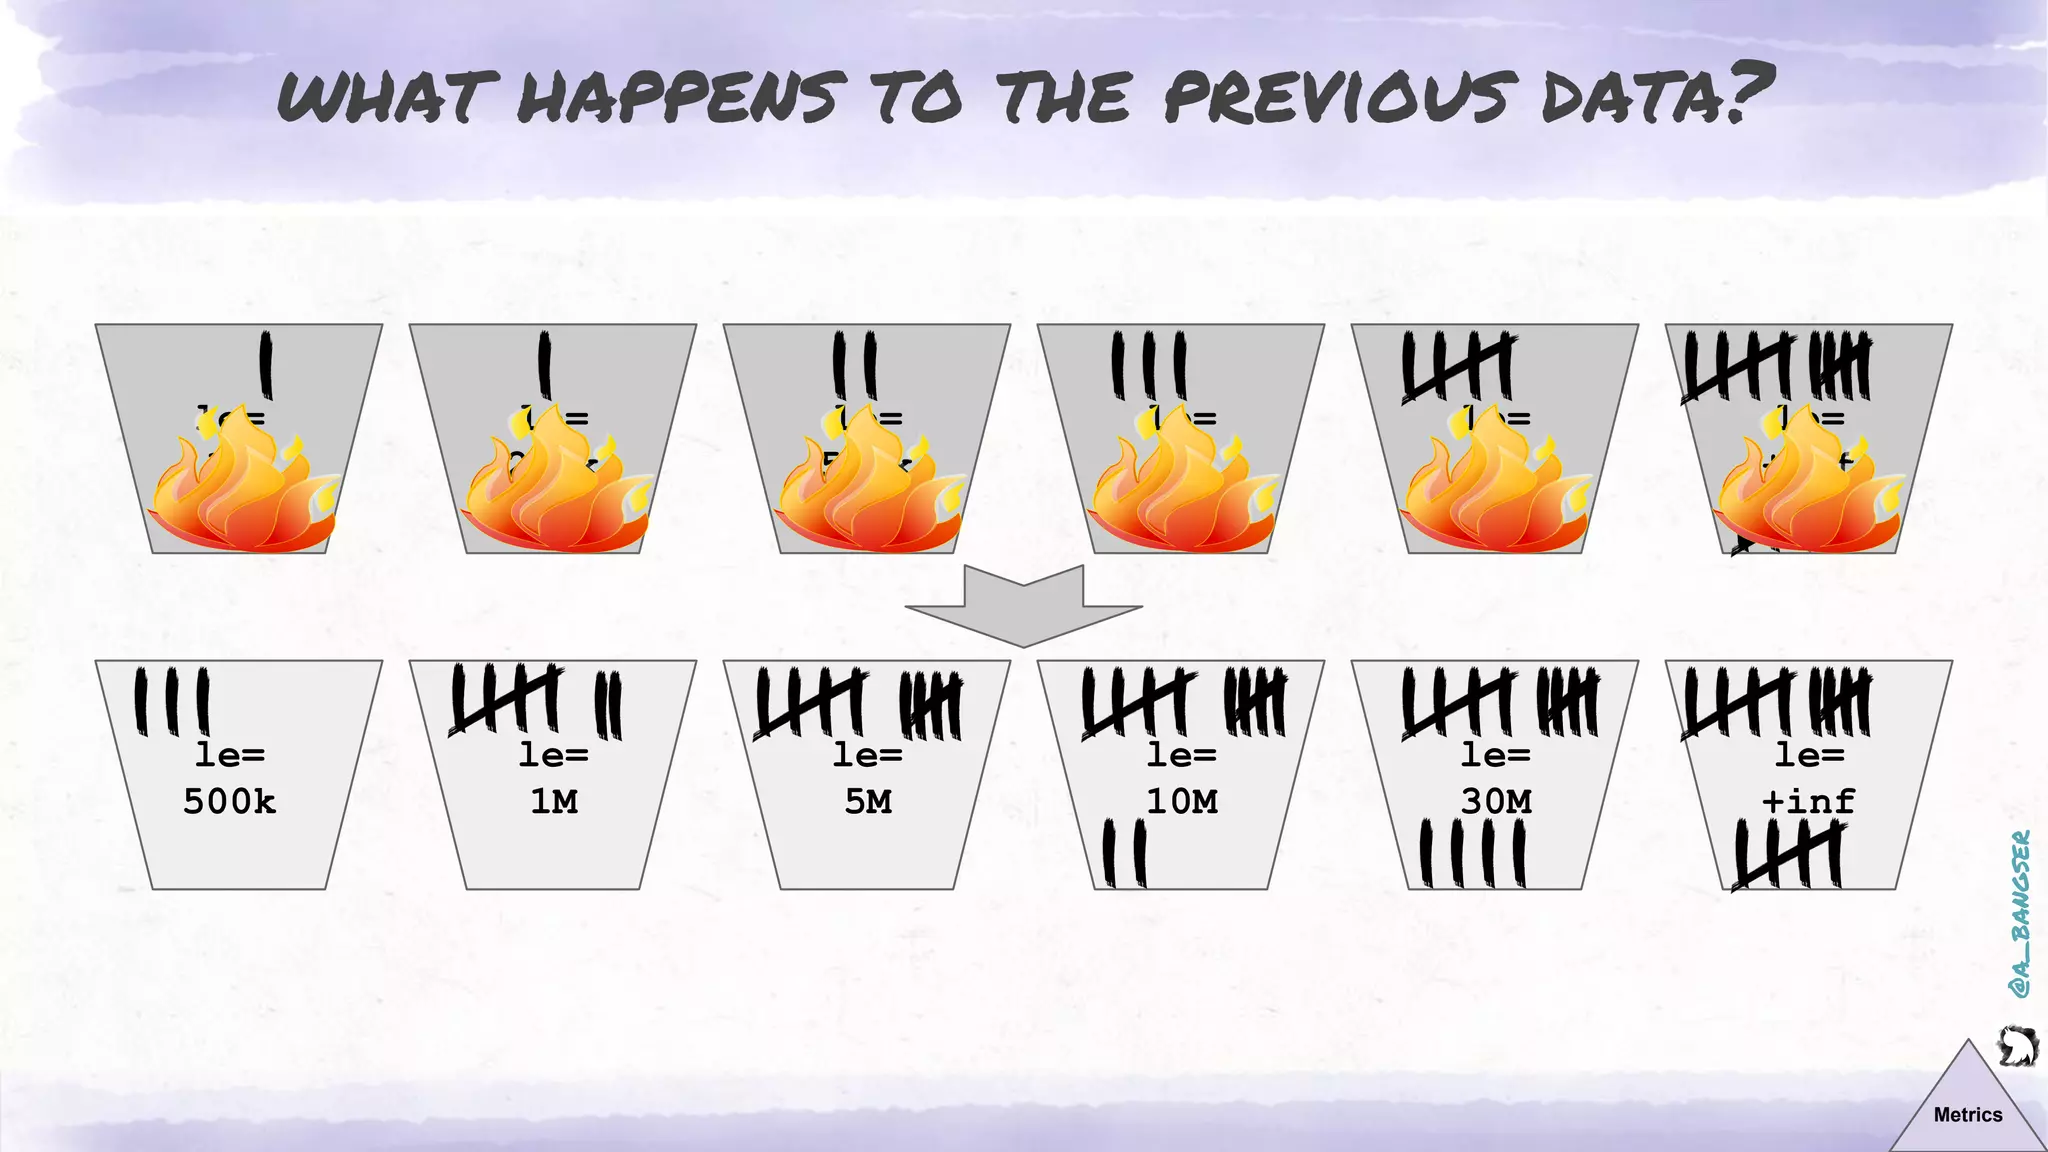
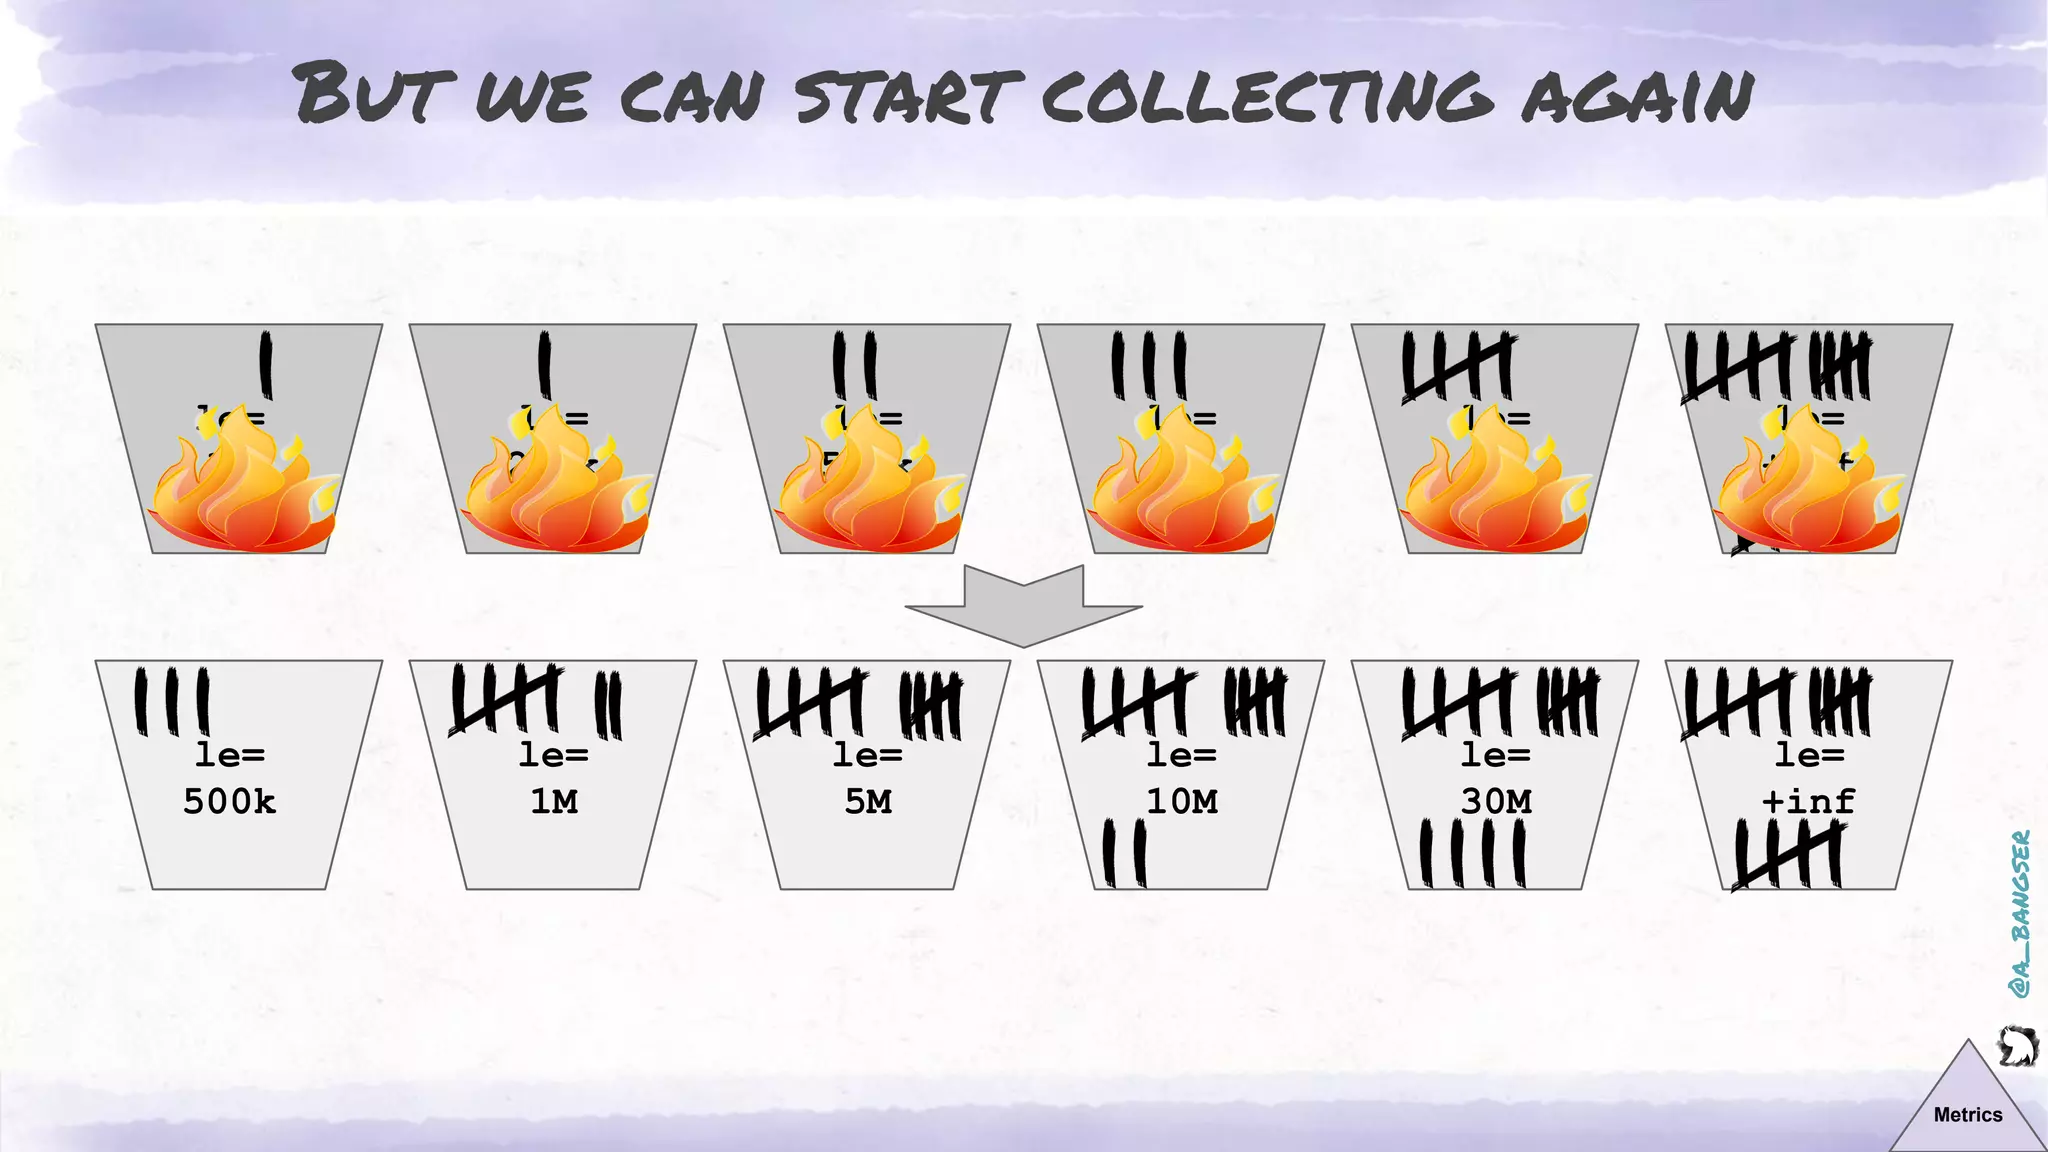
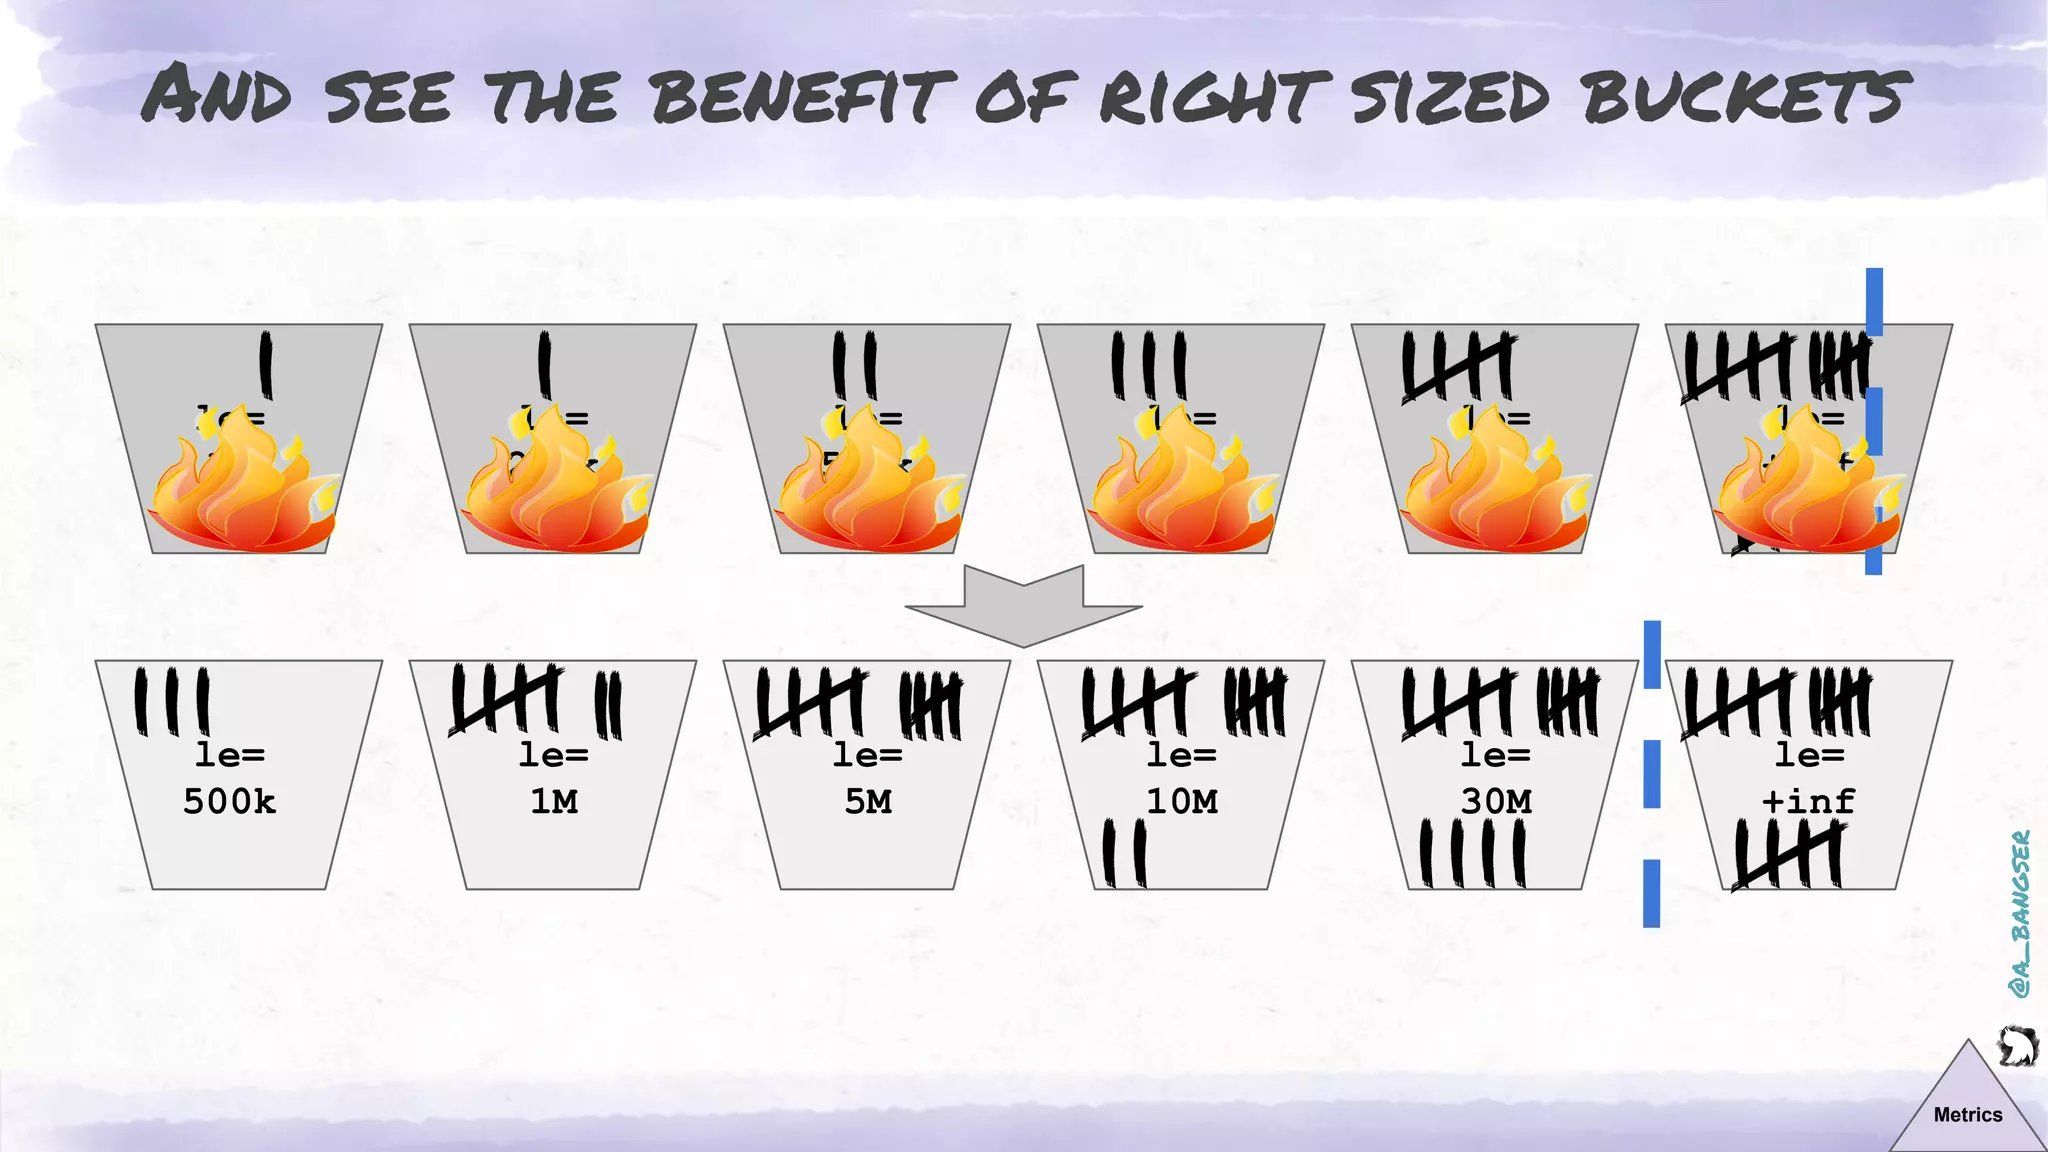
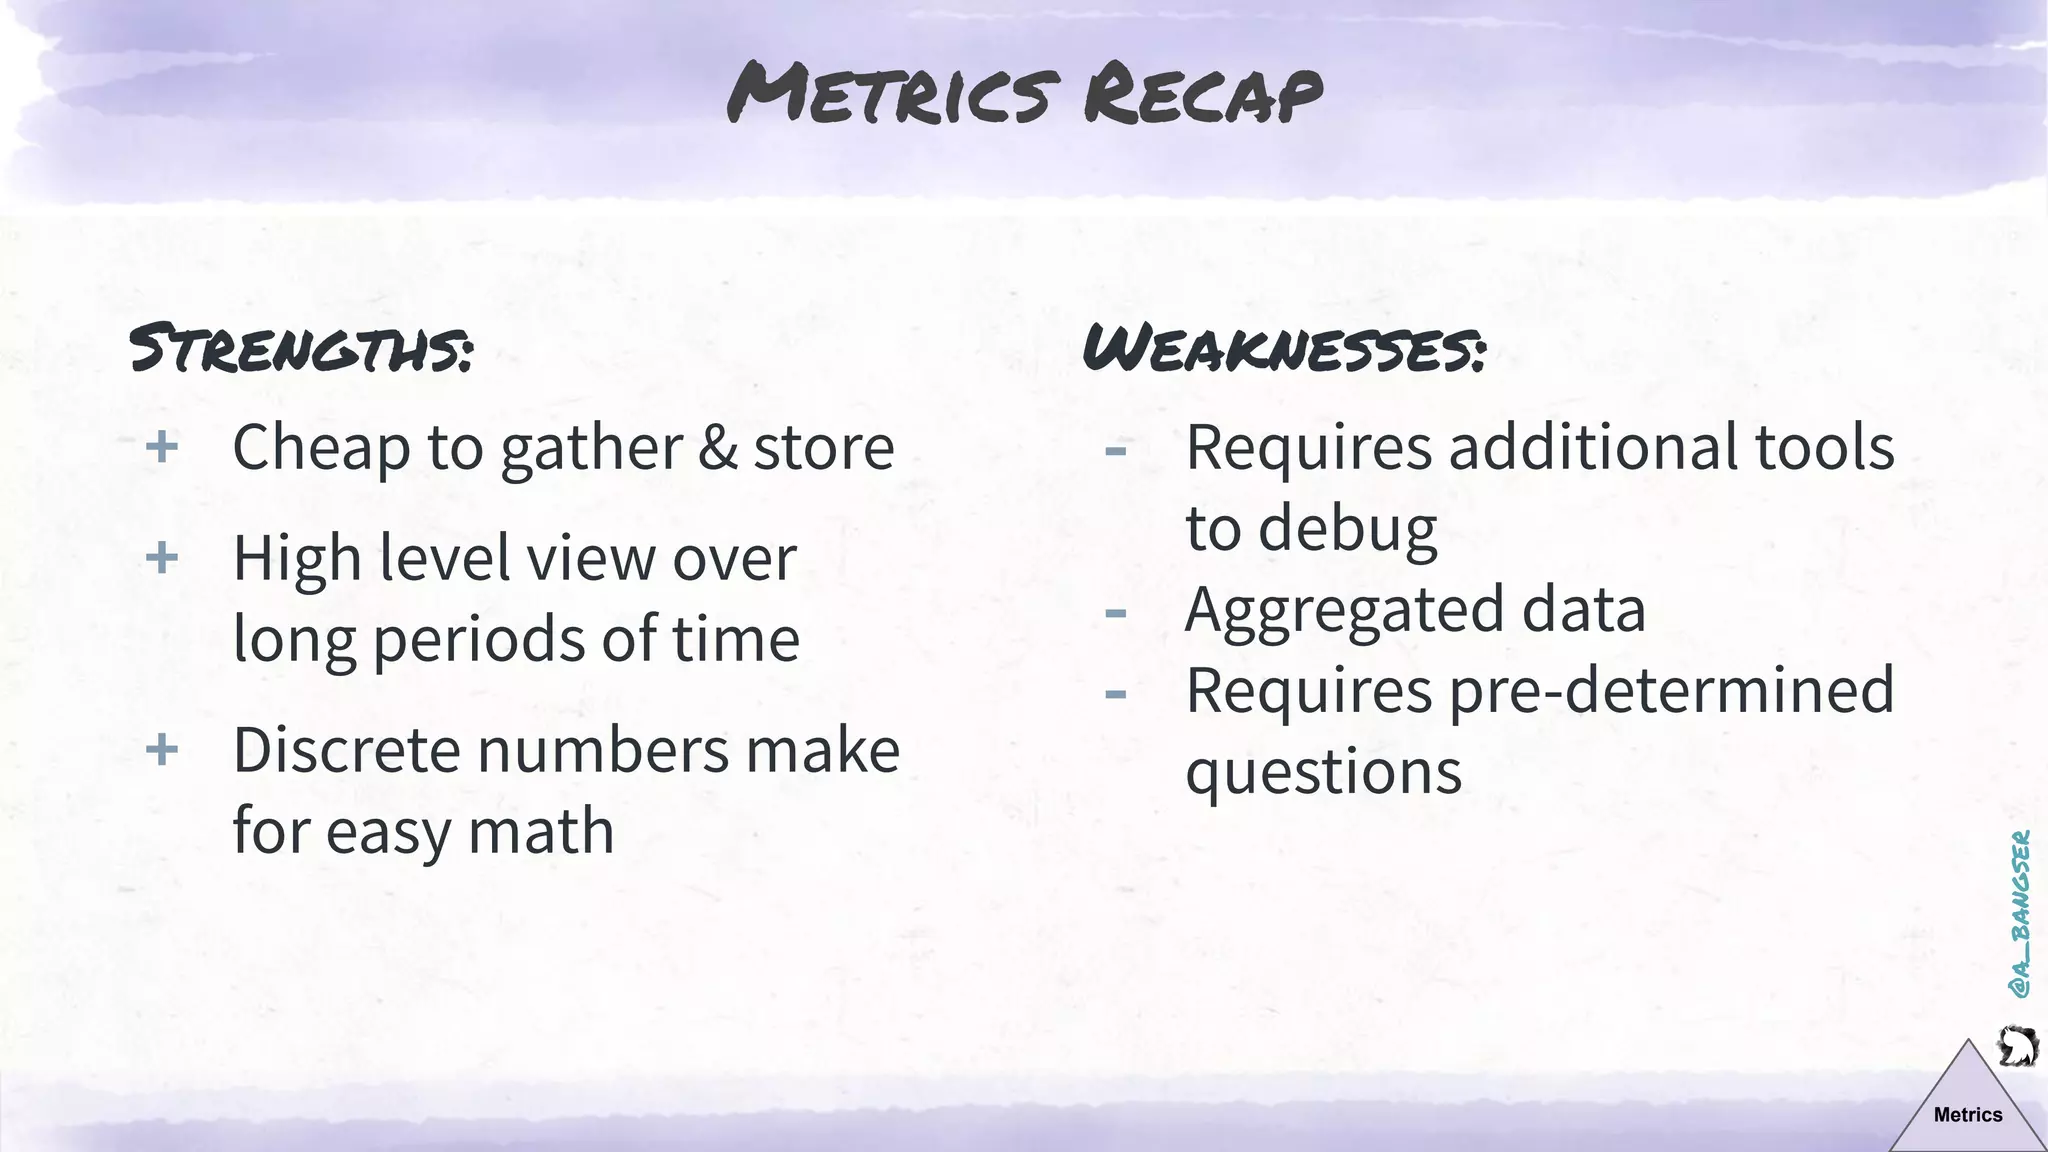
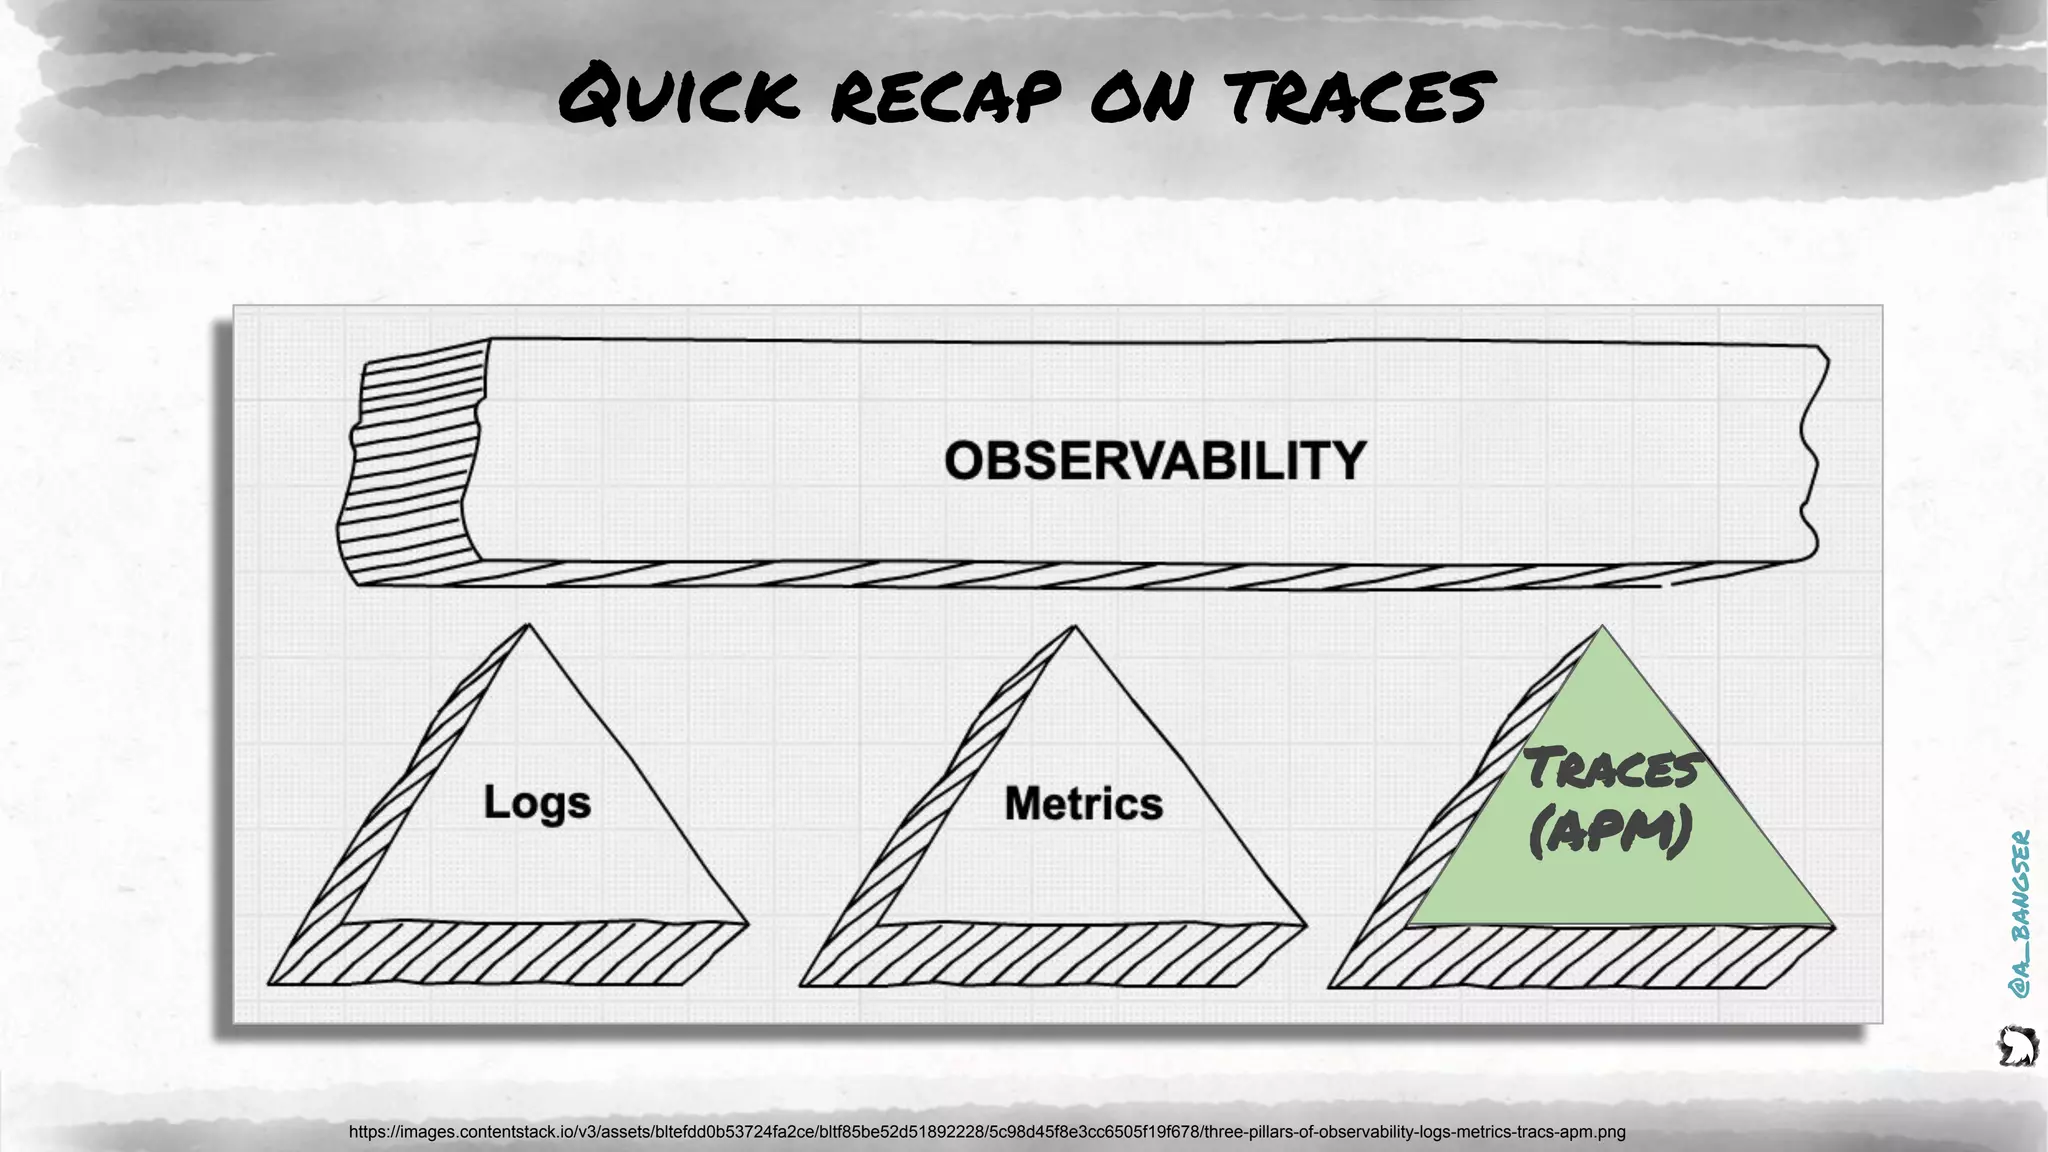
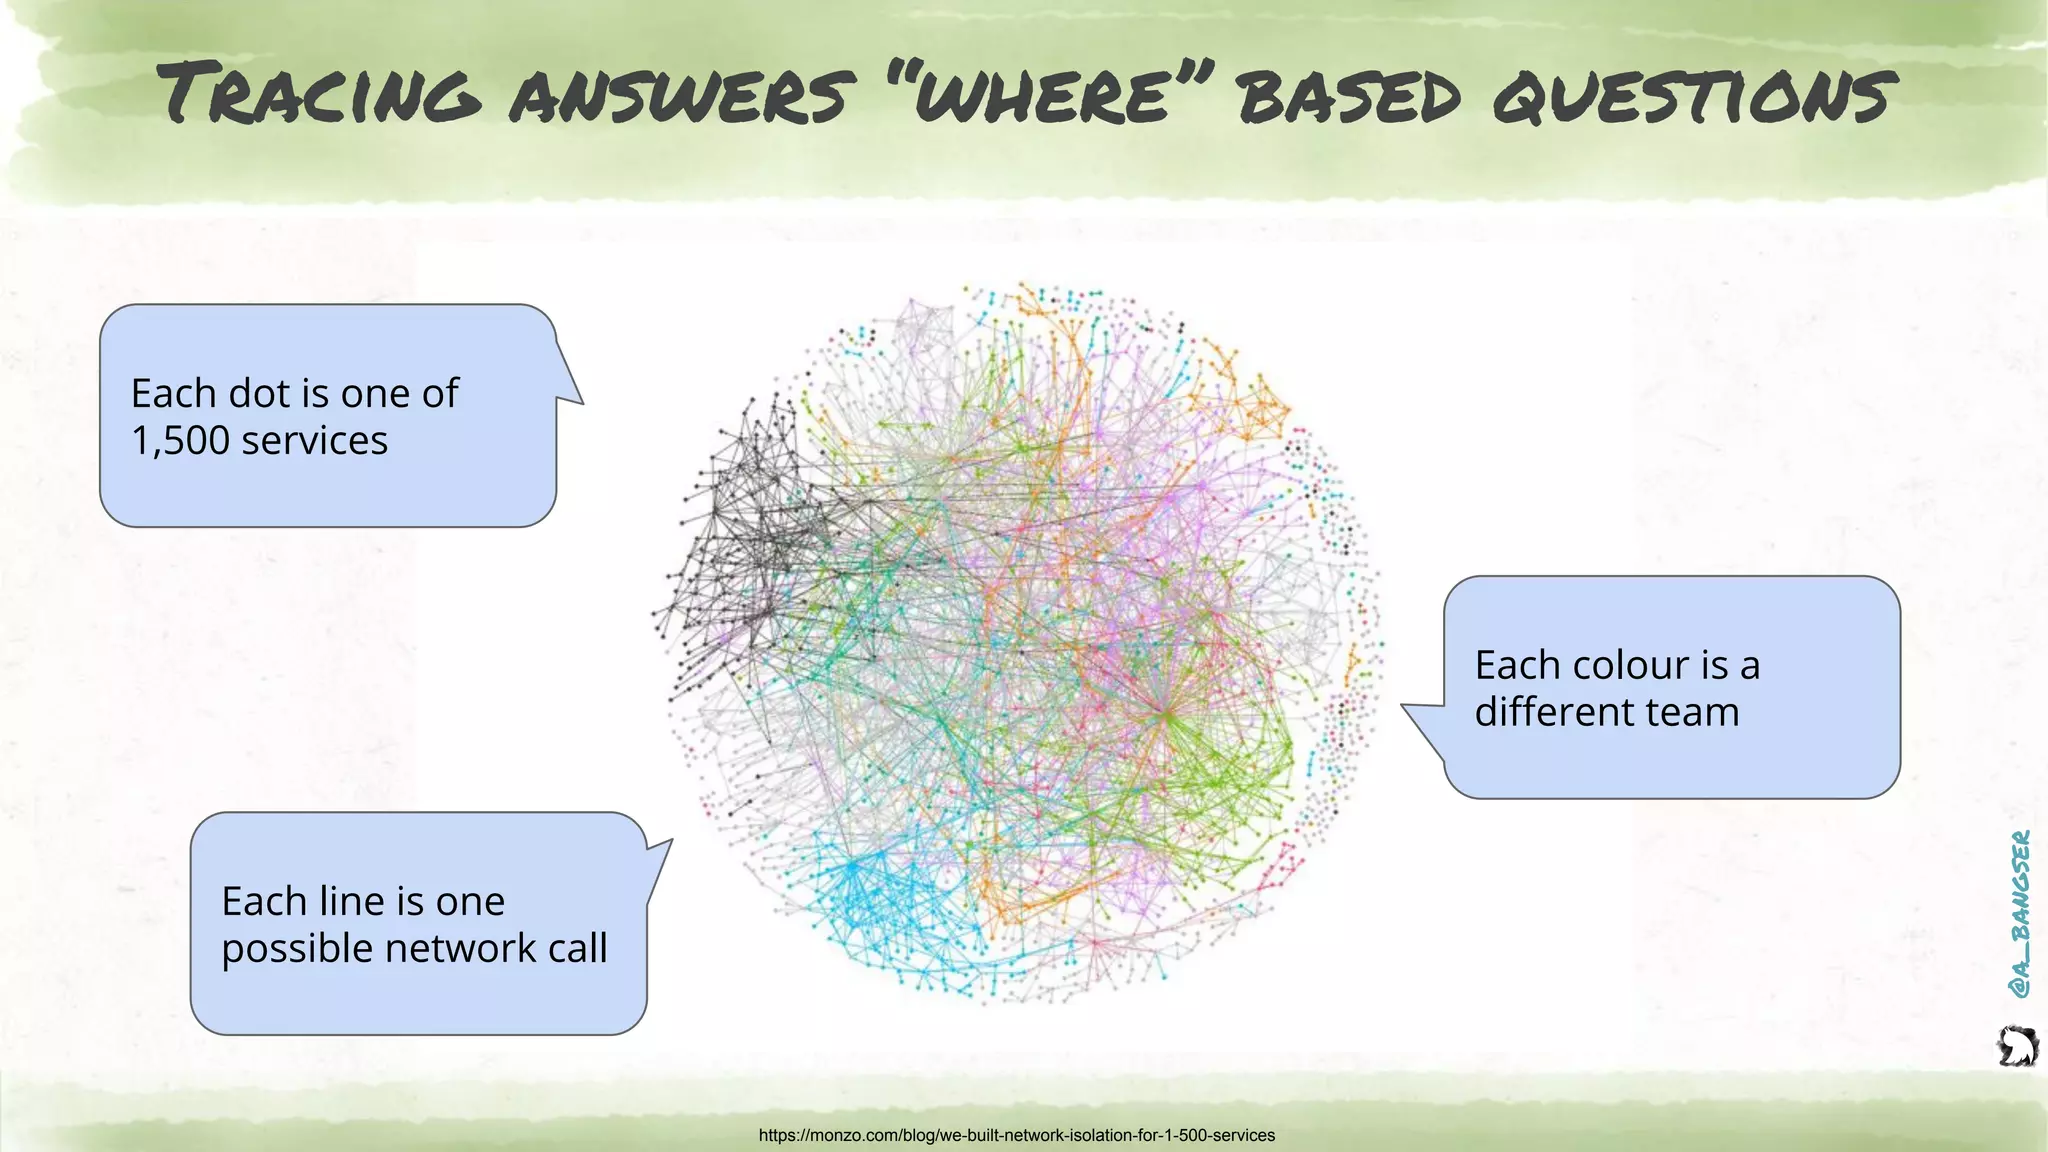
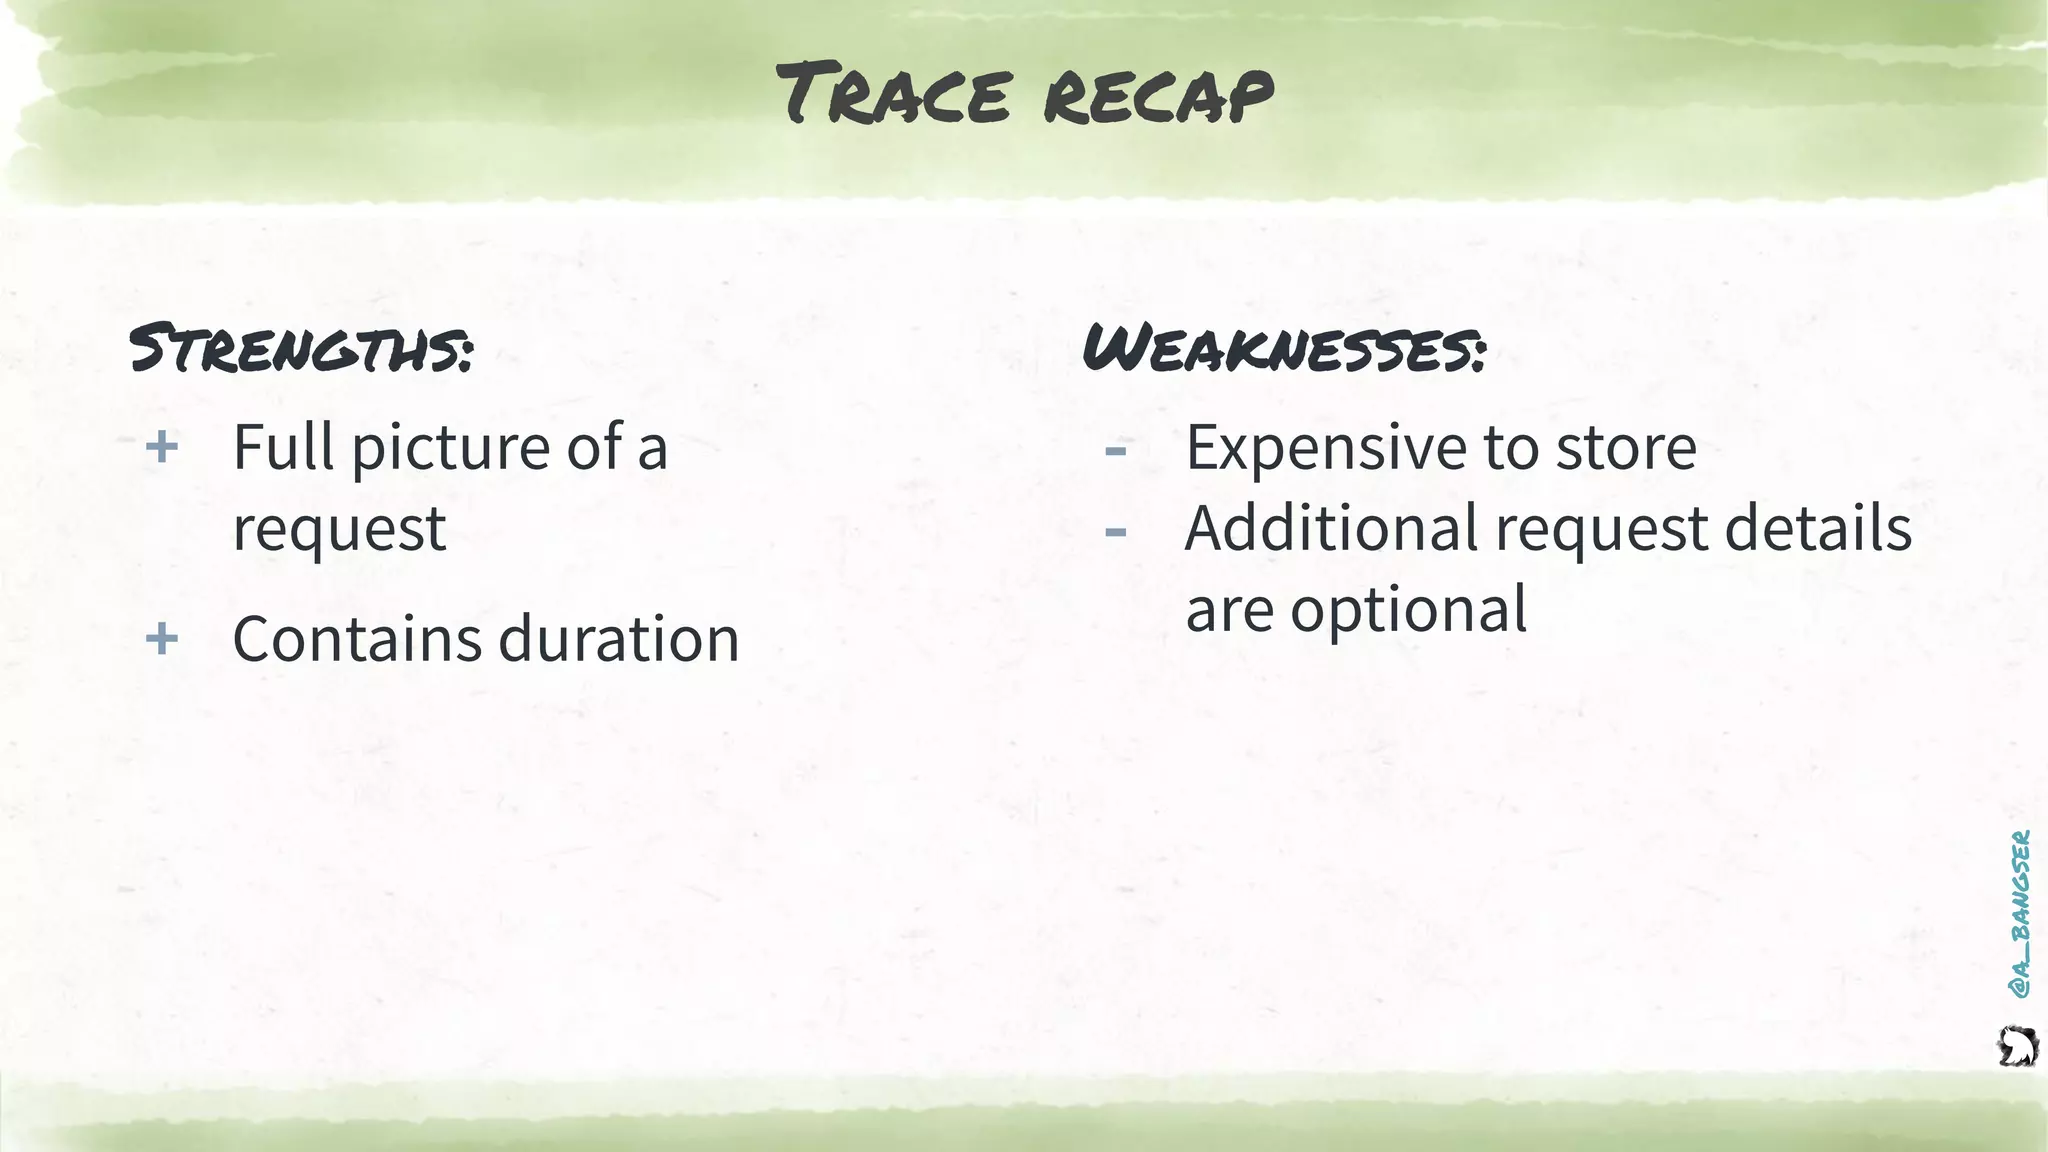
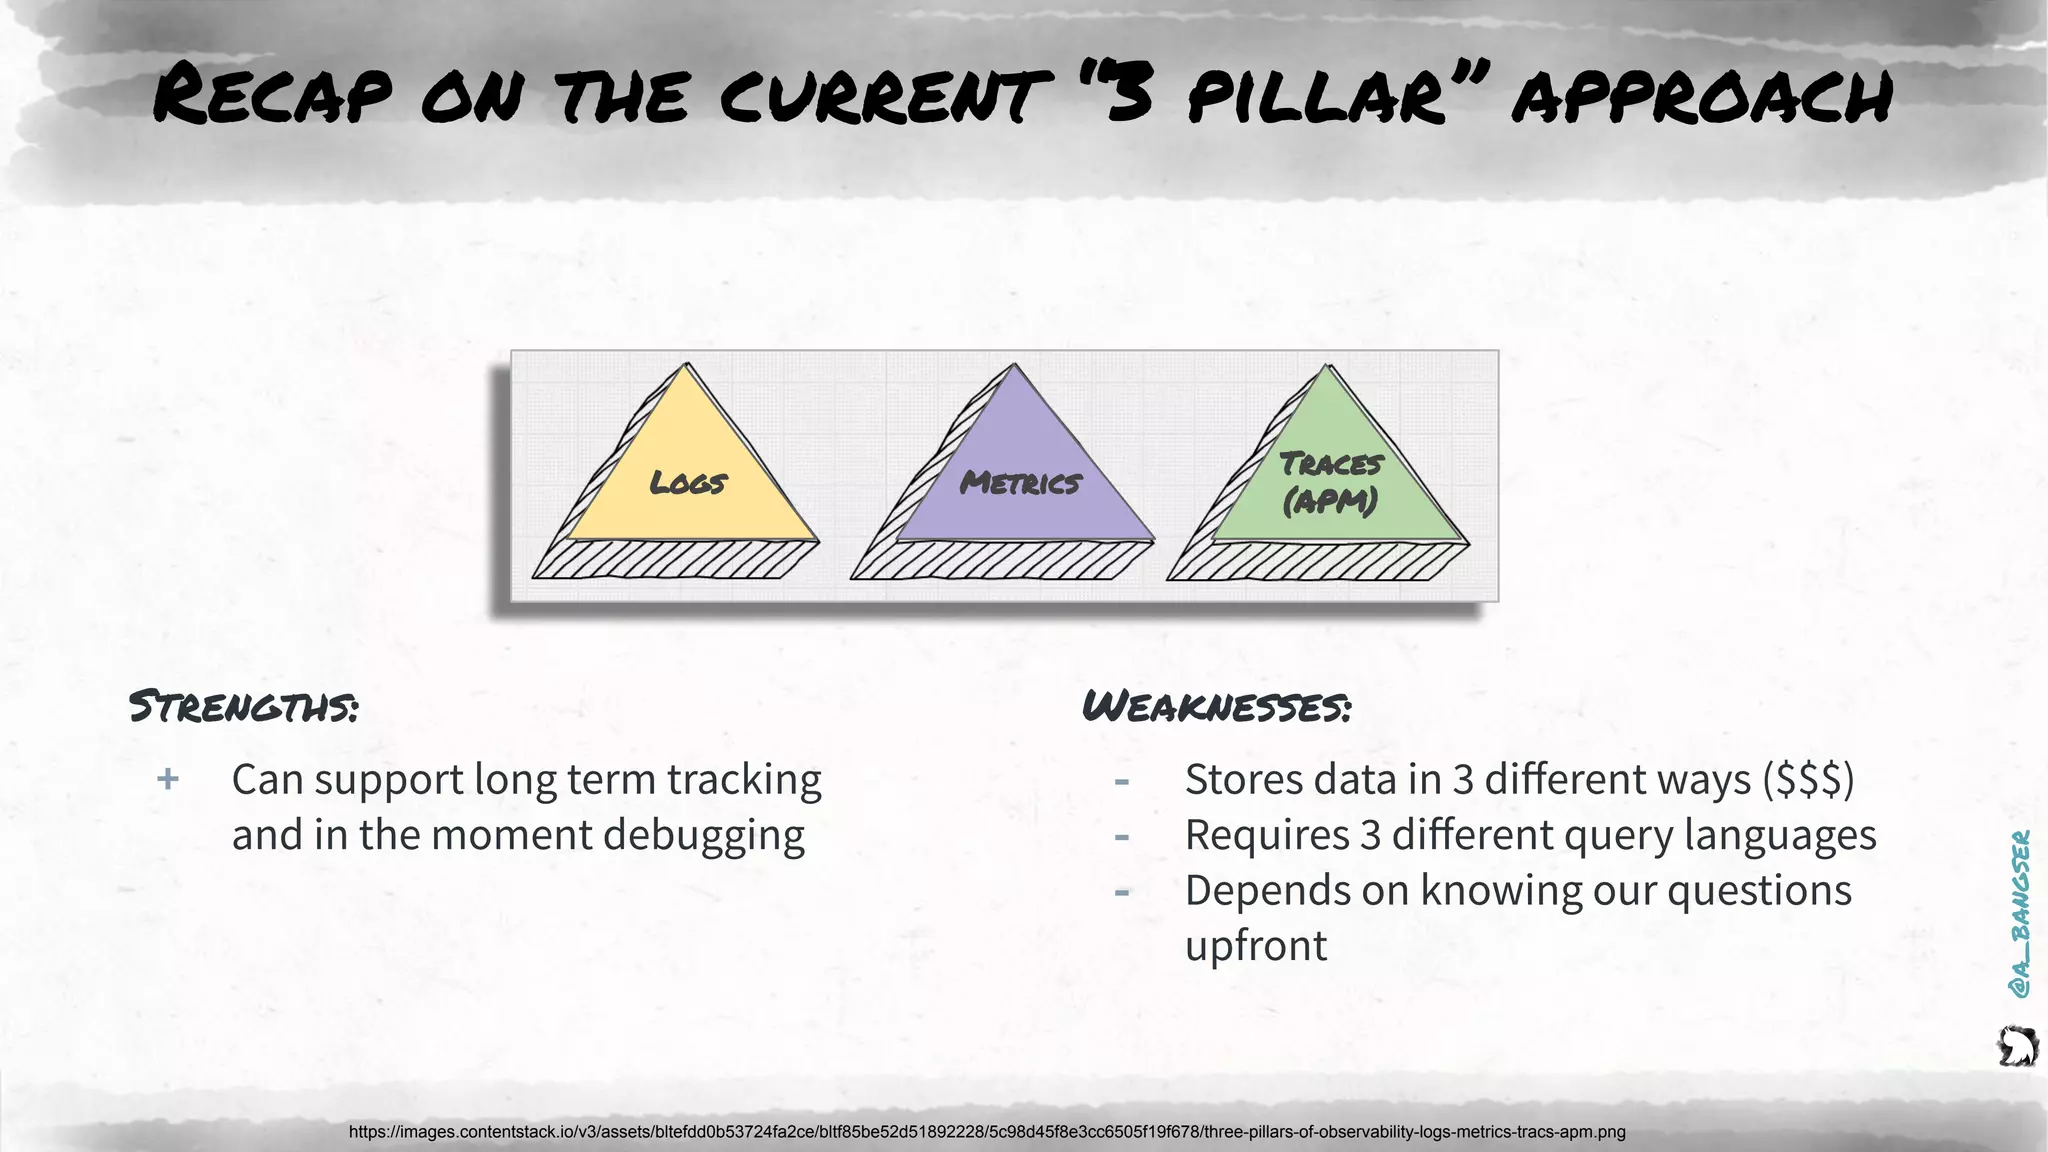
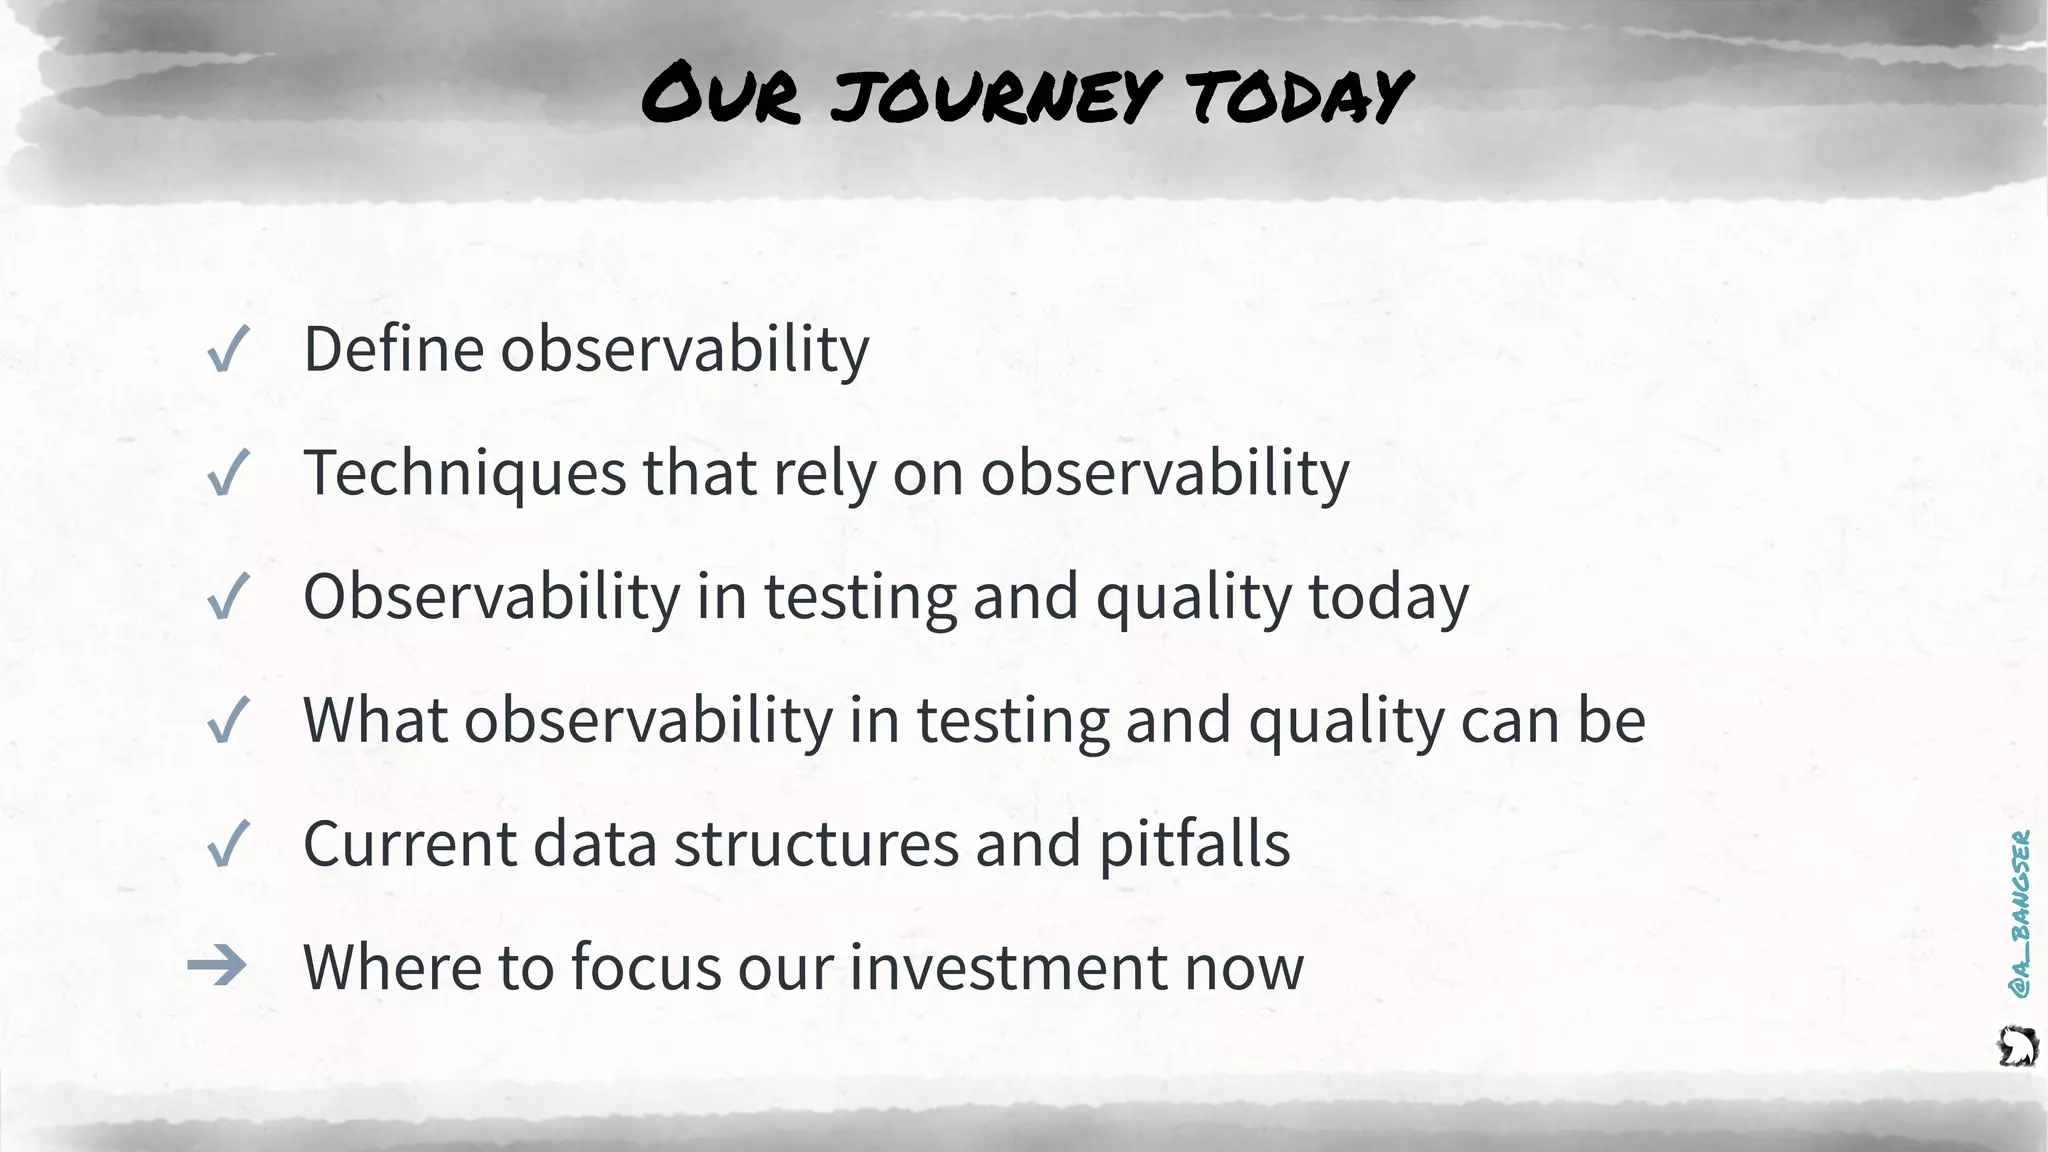
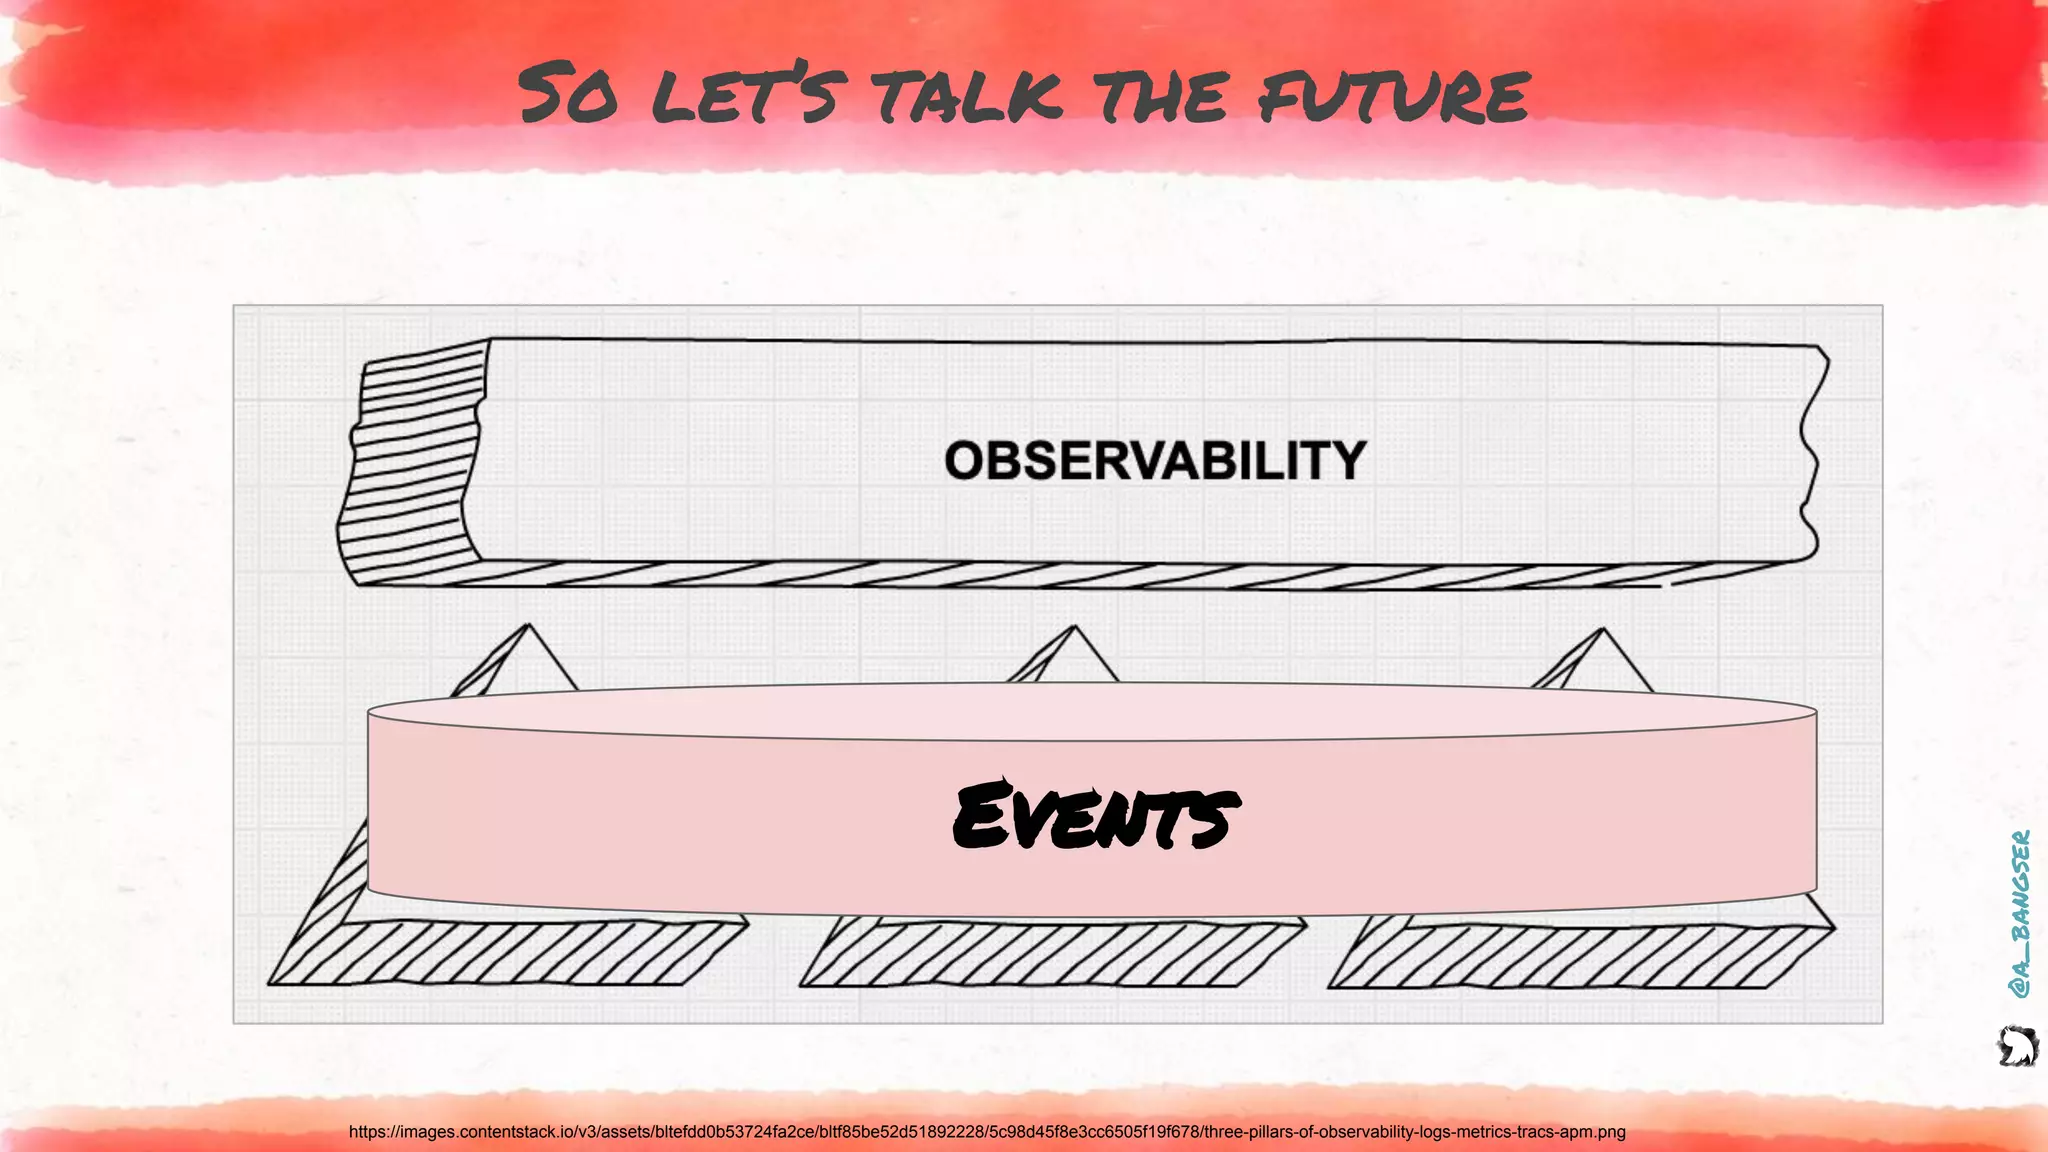
Demystifying
observability as a
testing tool
Abby Bangser (she/her)
@a_bangser
“
@a_bangser
I originally moved into platform engineering to never
again have to debate “would a user ever do that?”
@a_bangser
Why learn about observability?
Groundwork for many tools & techniques:
● Sustainable on-call
● Chaos engineering
● Testing in production
● Progressive rollouts
@a_bangser
So what is observability?
@a_bangser
Ok...so...what now?
@a_bangser
Grounding the definition in capabilities
* https://lightstep.com/observability/
Observability helps you “understand your entire system
and how it fits together, and then use that information to
discover what specifically you should care about when it’s
most important.”*
@a_bangser
Grounding the definition in capabilities
* https://lightstep.com/observability/
Observability helps you “understand your entire system
and how it fits together, and then use that information to
discover what specifically you should care about when it’s
most important.”*
Observability is access to
telemetry (data) that is
both
relevant and explorable
@a_bangser
Our journey today
✓ Define observability
✓ Techniques that rely on observability
➔ Observability in testing today and the future
➔ Current data structures and pitfalls
➔ Where to focus our investment now
@a_bangser
Debugging
@a_bangser
Debugging a “false” error is hard work
@a_bangser
So we use more descriptive asserts
@a_bangser
And we can expect even more
https://docs.honeycomb.io/working-with-your-data/bubbleup/
@a_bangser
Exploring
@a_bangser
Persona based test charters are
speculative
https://cdn.pixabay.com/photo/2012/04/28/17/11/people-43575__340.png
@a_bangser
So we extend into data driven testing
SELECT MIN(column_name)
FROM table_name
WHERE condition;
https://stackoverflow.com/a/50507519/2035223
@a_bangser
Real time learning from data exploration
@a_bangser
Our journey today
✓ Define observability
✓ Techniques that rely on observability
✓ Observability in testing today and the future
➔ Current data structures and pitfalls
➔ Where to focus our investment now
@a_bangser
Revisiting our definition of Observability
* https://lightstep.com/observability/
Observability helps you “understand your entire system
and how it fits together, and then use that information to
discover what specifically you should care about when it’s
most important.”*
Observability is access to
telemetry (data) that is
both
relevant and explorable
@a_bangser
These are sometimes referred to as the
“3 pillars of observability”
https://images.contentstack.io/v3/assets/bltefdd0b53724fa2ce/bltf85be52d51892228/5c98d45f8e3cc6505f19f678/three-pillars-of-observability-logs-metrics-tracs-apm.png
@a_bangser
Quick recap on logs
https://images.contentstack.io/v3/assets/bltefdd0b53724fa2ce/bltf85be52d51892228/5c98d45f8e3cc6505f19f678/three-pillars-of-observability-logs-metrics-tracs-apm.png
Logs
@a_bangser
Logging starts early with “Hello World”
Logs
@a_bangser
What happens as we lean on logs?
7a82dd3a
Logs
abc
@a_bangser
Log recap
Strengths:
+ Very detailed insights
+ Provides a clear order of
operation
Weaknesses:
‐ No built in relationship to a
user’s goals
‐ Relies on a schema so adding
new data can be difficult
‐ Expensive to store
‐ Privacy risks for certain data
@a_bangser
Deep dive on metrics
https://images.contentstack.io/v3/assets/bltefdd0b53724fa2ce/bltf85be52d51892228/5c98d45f8e3cc6505f19f678/three-pillars-of-observability-logs-metrics-tracs-apm.png
Metrics
@a_bangser
Metrics provide a story over time
Metrics
https://medium.com/@srpillai/deploying-prometheus-in-kubernetes-with-persistent-disk-or-configmap-1f47e1a34a2e
@a_bangser
And they get used to generate alerts
Metrics
@a_bangser
How histograms are stored in a time series DB
le=
1k
http_requests_duration_microseconds
le=
250k
le=
500k
le=
1M
le=
5M
le=
+inf
* `le` stands for “less than or equal to”
Metrics
@a_bangser
How histograms gets generated in a time
series DB
http_requests_duration_microseconds
www.website.com in 0.25 seconds
Metrics
* `le` stands for “less than or equal to”
le=
1k
le=
250k
le=
500k
le=
1M
le=
5M
le=
+inf
@a_bangser
le=
1k
le=
250k
le=
500k
le=
1M
le=
5M
le=
+inf
How histograms gets generated in a time
series DB
http_requests_duration_microseconds
www.website.com in 0.25 seconds
Metrics
* `le` stands for “less than or equal to”
@a_bangser
le=
1k
le=
250k
le=
500k
le=
1M
le=
5M
le=
+inf
How histograms gets generated in a time
series DB
http_requests_duration_microseconds
www.website.com/big_file in 5 seconds
www.website.com in 0.25 seconds
Metrics
* `le` stands for “less than or equal to”
@a_bangser
What does that +inf bucket really mean?
Metrics
le=
1k
le=
5M
le=
250k
le=
500k
le=
1M
le=
+inf
@a_bangser
le=
1k
le=
5M
le=
250k
le=
500k
le=
1M
le=
+inf
Why misjudging bucket size matters
Metrics
15 total requests
means the 95th
percentile request
is approx. 14.25
@a_bangser
Creating a more informed distribution
Metrics
le=
1k
le=
5M
le=
250k
le=
500k
le=
1M
le=
+inf
le=
500k
le=
1M
le=
5M
le=
+inf
le=
10M
le=
30M
@a_bangser
what happens to the previous data?
Metrics
le=
500k
le=
30M
le=
1M
le=
5M
le=
10M
le=
+inf
le=
1k
le=
5M
le=
250k
le=
500k
le=
1M
le=
+inf
@a_bangser
le=
1k
le=
5M
le=
250k
le=
500k
le=
1M
le=
+inf
But we can start collecting again
Metrics
le=
500k
le=
30M
le=
1M
le=
5M
le=
10M
le=
+inf
@a_bangser
le=
1k
le=
5M
le=
250k
le=
500k
le=
1M
le=
+inf
le=
500k
le=
30M
le=
1M
le=
5M
le=
10M
le=
+inf
And see the benefit of right sized buckets
Metrics
@a_bangser
Metrics Recap
Metrics
Strengths:
+ Cheap to gather & store
+ High level view over
long periods of time
+ Discrete numbers make
for easy math
Weaknesses:
‐ Requires additional tools
to debug
‐ Aggregated data
‐ Requires pre-determined
questions
@a_bangser
Quick recap on traces
https://images.contentstack.io/v3/assets/bltefdd0b53724fa2ce/bltf85be52d51892228/5c98d45f8e3cc6505f19f678/three-pillars-of-observability-logs-metrics-tracs-apm.png
Traces
(APM)
@a_bangser
Tracing answers “where” based questions
https://monzo.com/blog/we-built-network-isolation-for-1-500-services
Each dot is one of
1,500 services
Each line is one
possible network call
Each colour is a
different team
@a_bangser
Tracing is a call stack for a distributed
system
https://medium.com/opentracing/take-opentracing-for-a-hotrod-ride-f6e3141f7941
@a_bangser
What services, in what order, and for how
long
https://medium.com/opentracing/take-opentracing-for-a-hotrod-ride-f6e3141f7941
@a_bangser
Trace recap
Strengths:
+ Full picture of a
request
+ Contains duration
Weaknesses:
‐ Expensive to store
‐ Additional request details
are optional
@a_bangser
Recap on the current “3 pillar” approach
https://images.contentstack.io/v3/assets/bltefdd0b53724fa2ce/bltf85be52d51892228/5c98d45f8e3cc6505f19f678/three-pillars-of-observability-logs-metrics-tracs-apm.png
Traces
(APM)
MetricsLogs
Strengths:
+ Can support long term tracking
and in the moment debugging
Weaknesses:
‐ Stores data in 3 different ways ($$$)
‐ Requires 3 different query languages
‐ Depends on knowing our questions
upfront
@a_bangser
The 3 pillars are better suited to
Monitoring
https://images.contentstack.io/v3/assets/bltefdd0b53724fa2ce/bltf85be52d51892228/5c98d45f8e3cc6505f19f678/three-pillars-of-observability-logs-metrics-tracs-apm.png
Monitoring
@a_bangser
What is the difference?
https://lightstep.com/observability/
@a_bangser
Our journey today
✓ Define observability
✓ Techniques that rely on observability
✓ Observability in testing and quality today
✓ What observability in testing and quality can be
✓ Current data structures and pitfalls
➔ Where to focus our investment now
@a_bangser
So let’s talk the future
https://images.contentstack.io/v3/assets/bltefdd0b53724fa2ce/bltf85be52d51892228/5c98d45f8e3cc6505f19f678/three-pillars-of-observability-logs-metrics-tracs-apm.png
Events
@a_bangser
In short:
Structured logs scoped
around a single request
@a_bangser
Even shorter...
Context rich traces
@a_bangser
Let’s use an example
@a_bangser
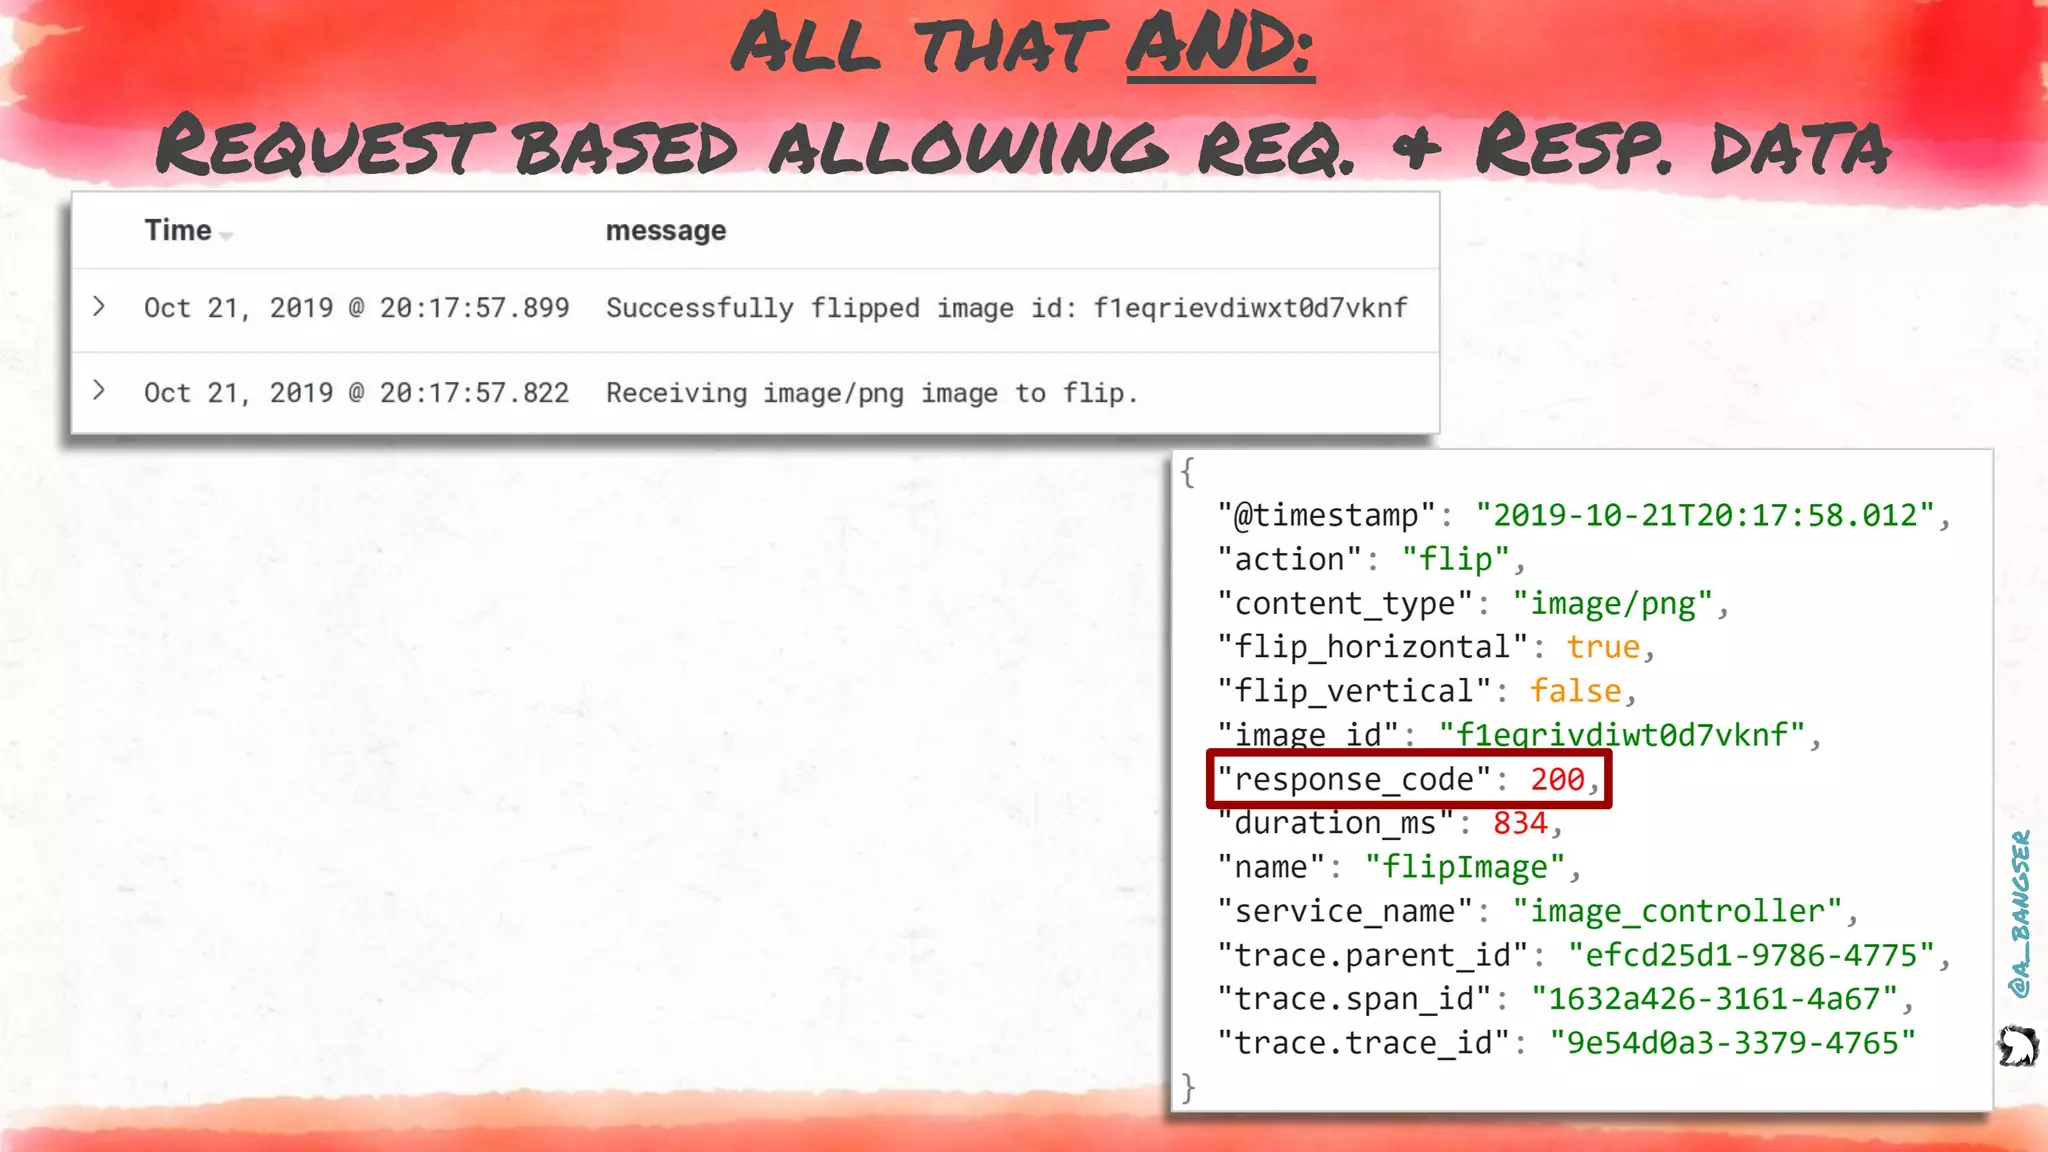
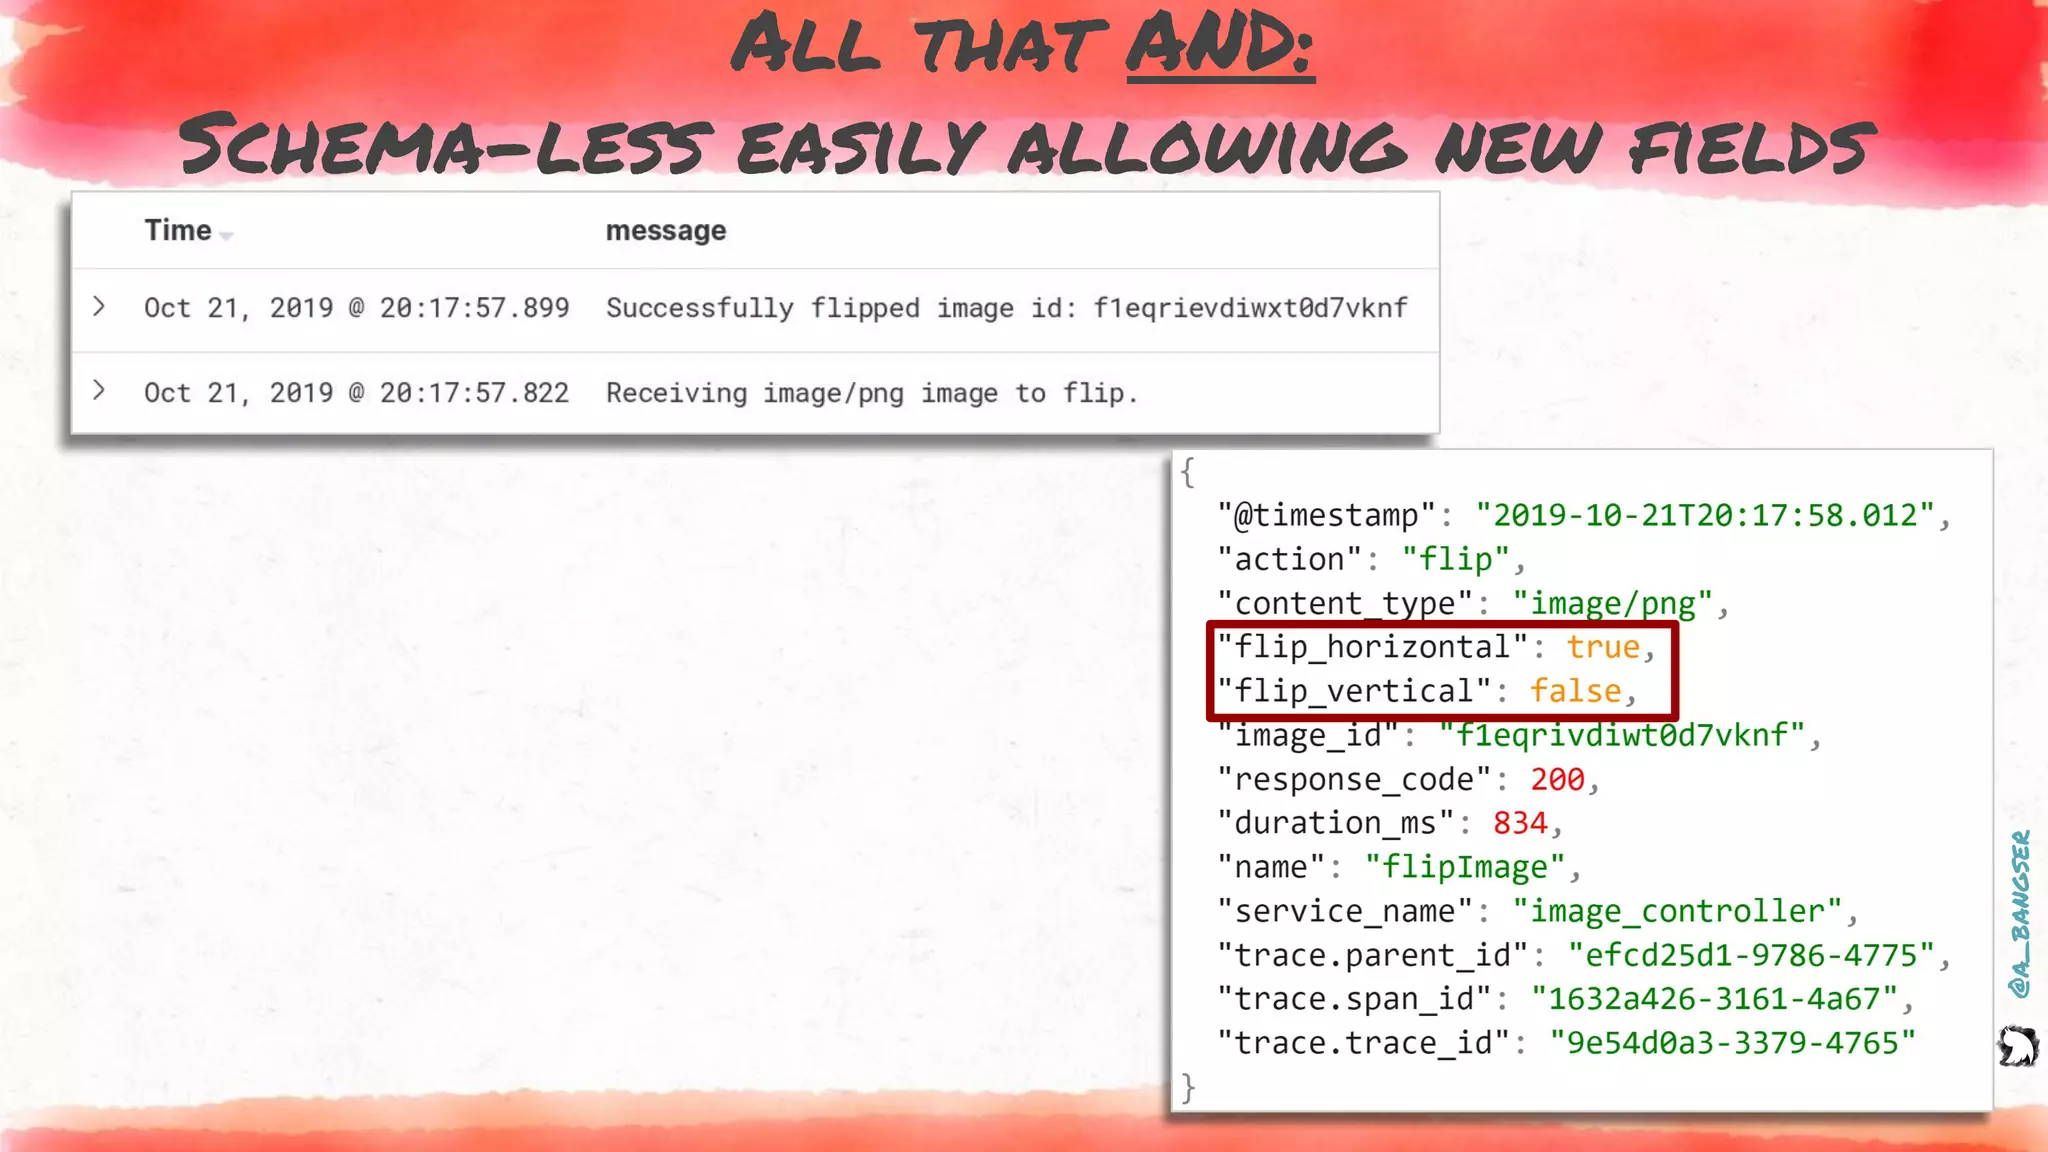
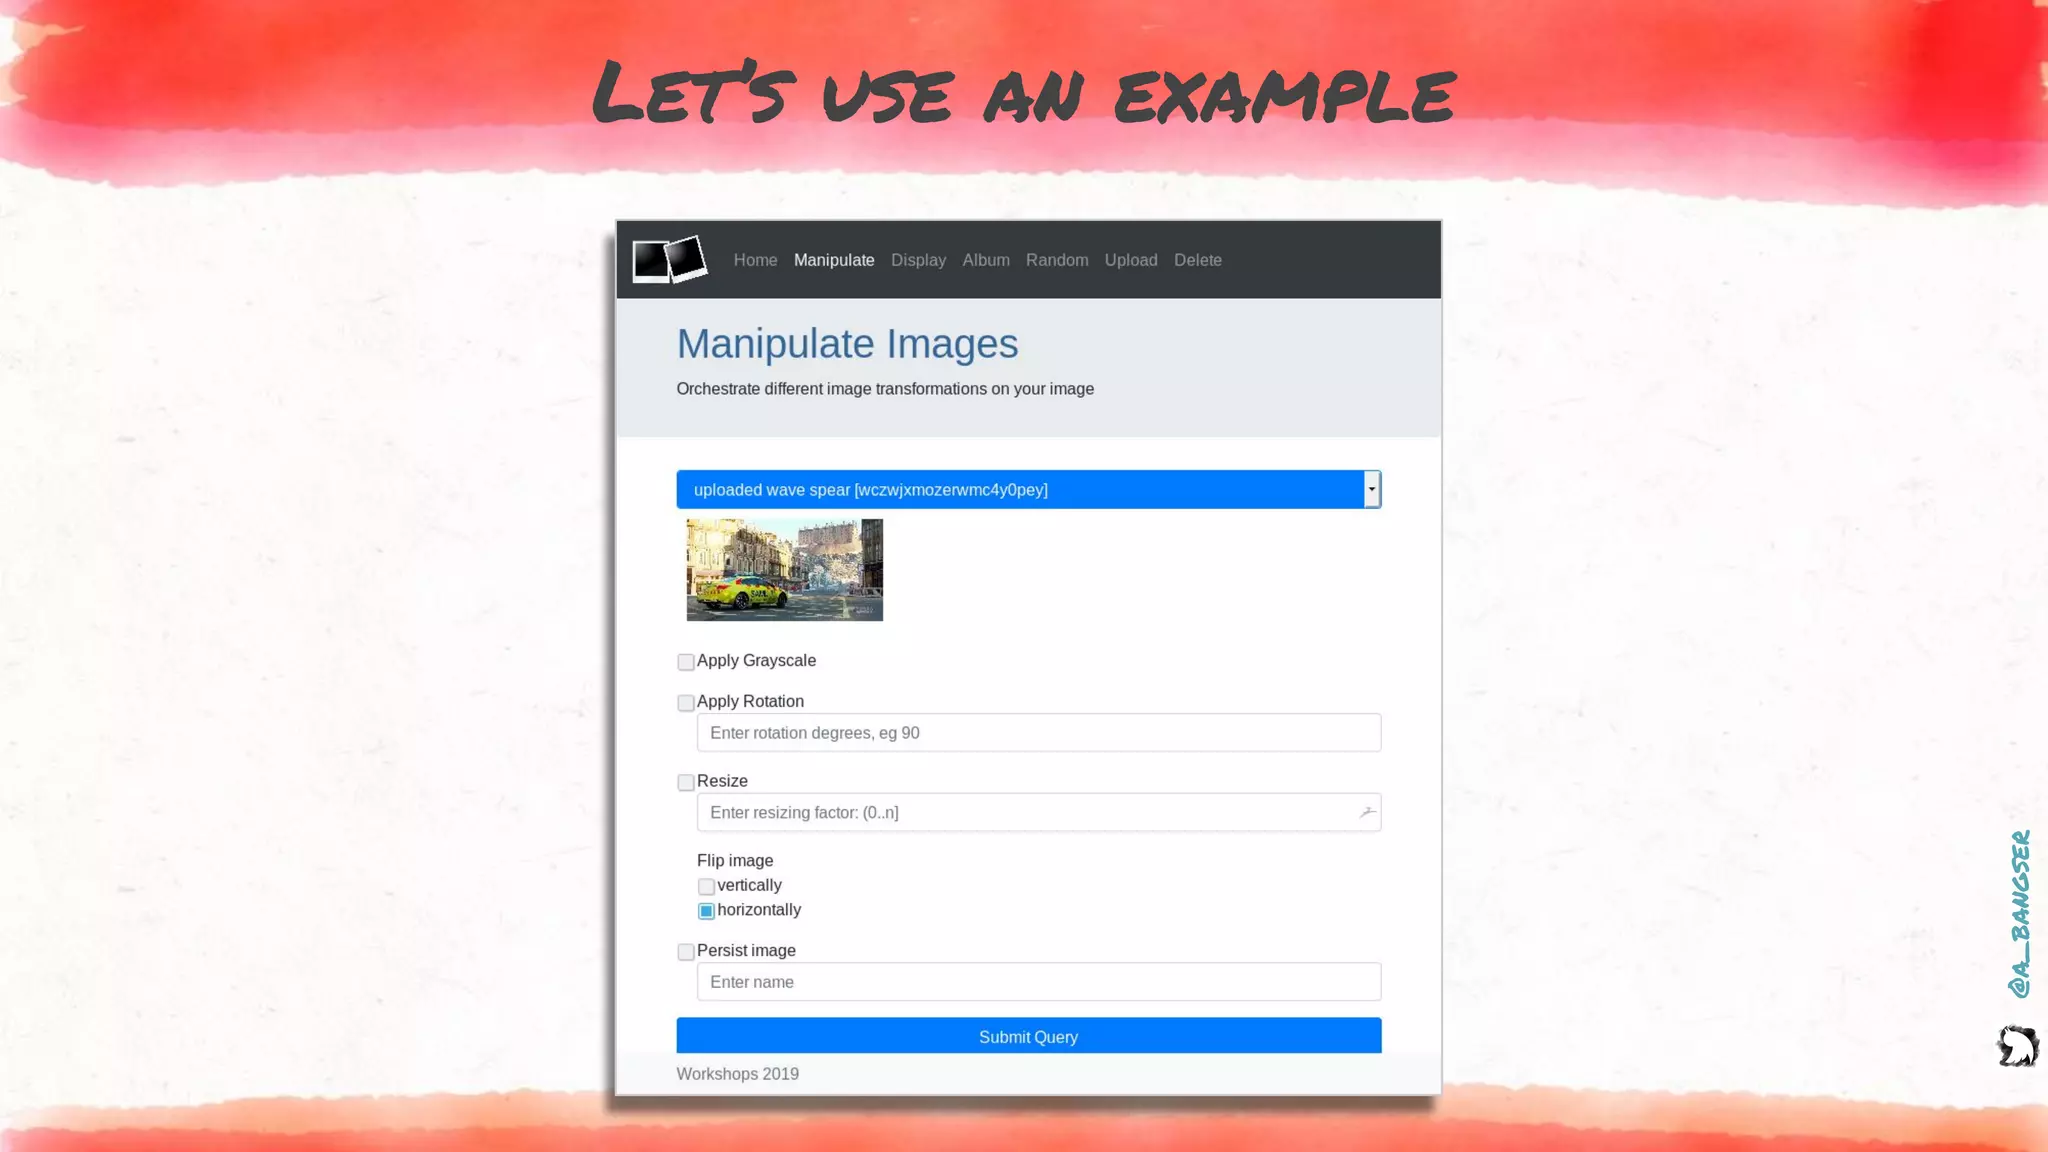
How logs and events are created
@PostMapping("flip")
public ResponseEntity flipImage(@RequestParam("image") MultipartFile file,
@RequestParam(value = "vertical") Boolean vertical,
@RequestParam(value = "horizontal") Boolean horizontal) {
EVENT.addFields(
new Pair("content.type", file.getContentType()),
new Pair("action", "flip"),
new Pair("flip_vertical", vertical),
new Pair("flip_horizontal", horizontal));
LOGGER.info("Receiving {} image to flip.", file.getContentType());
byte[] flippedImage = imageService.flip(file, vertical, horizontal);
LOGGER.info("Successfully flipped image id: {}", file.getId());
EVENT.addField("image_id", file.getId());
return new ResponseEntity<>(flippedImage, headers, HttpStatus.OK);
}
EVENT.addFields(
new Pair("content.type", file.getContentType()),
new Pair("action", "flip"),
new Pair("flip_vertical", vertical),
new Pair("flip_horizontal", horizontal));
LOGGER.info("Successfully flipped image id: {}", file.getId()");
LOGGER.info("Receiving {} image to flip.", file.getContentType());
EVENT.addField("image_id", file.getId());
@a_bangser
Comparing the outputs
Multiple logs
A single event
@a_bangser
The event data covers all log data
@a_bangser
...and the metrics data
@a_bangser
...and the trace data
@a_bangser
All that AND:
Request based allowing req. & Resp. data
@a_bangser
All that AND:
Schema-less easily allowing new fields
@a_bangser
Why is this powerful?
@a_bangser
Explorability with the data in one place
● Key numbers like latency and count
● Key variables like IDs
● Correlation between services
@a_bangser
Explorability with the data in one place
Strengths:
+ All visualisations can
be derived including
timelines and big
picture view
+ Full context of a users
request
Weaknesses:
‐ Requires investment from
engineers who know the
app!
‐ Expensive to store
‐ Privacy risks for certain
data
@a_bangser
There is work to do away from code too!
➔ Drive the virtuous cycle of deep
domain knowledge supporting better
data collection.
@a_bangser
There is work to do away from code too!
➔ Drive the virtuous cycle of deep
domain knowledge supporting better
data collection.
➔ Encourage the use of observability as
a part of feature validation.
@a_bangser
➔ Drive the virtuous cycle of deep
domain knowledge supporting better
data collection.
➔ Encourage the use of observability as
a part of feature validation.
➔ Keep asking high value questions and
don’t settle until tools & data can
answer them!
There is work to do away from code too!
Thank you!
Let’s keep the conversation going
@a_bangser

Demystifying observability

  • 1.
    Demystifying observability as a testingtool Abby Bangser (she/her) @a_bangser
  • 2.
    “ @a_bangser I originally movedinto platform engineering to never again have to debate “would a user ever do that?”
  • 3.
    @a_bangser Why learn aboutobservability? Groundwork for many tools & techniques: ● Sustainable on-call ● Chaos engineering ● Testing in production ● Progressive rollouts
  • 4.
    @a_bangser So what isobservability?
  • 5.
  • 6.
    @a_bangser Grounding the definitionin capabilities * https://lightstep.com/observability/ Observability helps you “understand your entire system and how it fits together, and then use that information to discover what specifically you should care about when it’s most important.”*
  • 7.
    @a_bangser Grounding the definitionin capabilities * https://lightstep.com/observability/ Observability helps you “understand your entire system and how it fits together, and then use that information to discover what specifically you should care about when it’s most important.”* Observability is access to telemetry (data) that is both relevant and explorable
  • 8.
    @a_bangser Our journey today ✓Define observability ✓ Techniques that rely on observability ➔ Observability in testing today and the future ➔ Current data structures and pitfalls ➔ Where to focus our investment now
  • 9.
  • 10.
  • 11.
    @a_bangser So we usemore descriptive asserts
  • 12.
    @a_bangser And we canexpect even more https://docs.honeycomb.io/working-with-your-data/bubbleup/
  • 13.
  • 14.
    @a_bangser Persona based testcharters are speculative https://cdn.pixabay.com/photo/2012/04/28/17/11/people-43575__340.png
  • 15.
    @a_bangser So we extendinto data driven testing SELECT MIN(column_name) FROM table_name WHERE condition; https://stackoverflow.com/a/50507519/2035223
  • 16.
    @a_bangser Real time learningfrom data exploration
  • 17.
    @a_bangser Our journey today ✓Define observability ✓ Techniques that rely on observability ✓ Observability in testing today and the future ➔ Current data structures and pitfalls ➔ Where to focus our investment now
  • 18.
    @a_bangser Revisiting our definitionof Observability * https://lightstep.com/observability/ Observability helps you “understand your entire system and how it fits together, and then use that information to discover what specifically you should care about when it’s most important.”* Observability is access to telemetry (data) that is both relevant and explorable
  • 19.
    @a_bangser These are sometimesreferred to as the “3 pillars of observability” https://images.contentstack.io/v3/assets/bltefdd0b53724fa2ce/bltf85be52d51892228/5c98d45f8e3cc6505f19f678/three-pillars-of-observability-logs-metrics-tracs-apm.png
  • 20.
    @a_bangser Quick recap onlogs https://images.contentstack.io/v3/assets/bltefdd0b53724fa2ce/bltf85be52d51892228/5c98d45f8e3cc6505f19f678/three-pillars-of-observability-logs-metrics-tracs-apm.png Logs
  • 21.
    @a_bangser Logging starts earlywith “Hello World” Logs
  • 22.
    @a_bangser What happens aswe lean on logs? 7a82dd3a Logs abc
  • 23.
    @a_bangser Log recap Strengths: + Verydetailed insights + Provides a clear order of operation Weaknesses: ‐ No built in relationship to a user’s goals ‐ Relies on a schema so adding new data can be difficult ‐ Expensive to store ‐ Privacy risks for certain data
  • 24.
    @a_bangser Deep dive onmetrics https://images.contentstack.io/v3/assets/bltefdd0b53724fa2ce/bltf85be52d51892228/5c98d45f8e3cc6505f19f678/three-pillars-of-observability-logs-metrics-tracs-apm.png Metrics
  • 25.
    @a_bangser Metrics provide astory over time Metrics https://medium.com/@srpillai/deploying-prometheus-in-kubernetes-with-persistent-disk-or-configmap-1f47e1a34a2e
  • 26.
    @a_bangser And they getused to generate alerts Metrics
  • 27.
    @a_bangser How histograms arestored in a time series DB le= 1k http_requests_duration_microseconds le= 250k le= 500k le= 1M le= 5M le= +inf * `le` stands for “less than or equal to” Metrics
  • 28.
    @a_bangser How histograms getsgenerated in a time series DB http_requests_duration_microseconds www.website.com in 0.25 seconds Metrics * `le` stands for “less than or equal to” le= 1k le= 250k le= 500k le= 1M le= 5M le= +inf
  • 29.
    @a_bangser le= 1k le= 250k le= 500k le= 1M le= 5M le= +inf How histograms getsgenerated in a time series DB http_requests_duration_microseconds www.website.com in 0.25 seconds Metrics * `le` stands for “less than or equal to”
  • 30.
    @a_bangser le= 1k le= 250k le= 500k le= 1M le= 5M le= +inf How histograms getsgenerated in a time series DB http_requests_duration_microseconds www.website.com/big_file in 5 seconds www.website.com in 0.25 seconds Metrics * `le` stands for “less than or equal to”
  • 31.
    @a_bangser What does that+inf bucket really mean? Metrics le= 1k le= 5M le= 250k le= 500k le= 1M le= +inf
  • 32.
    @a_bangser le= 1k le= 5M le= 250k le= 500k le= 1M le= +inf Why misjudging bucketsize matters Metrics 15 total requests means the 95th percentile request is approx. 14.25
  • 33.
    @a_bangser Creating a moreinformed distribution Metrics le= 1k le= 5M le= 250k le= 500k le= 1M le= +inf le= 500k le= 1M le= 5M le= +inf le= 10M le= 30M
  • 34.
    @a_bangser what happens tothe previous data? Metrics le= 500k le= 30M le= 1M le= 5M le= 10M le= +inf le= 1k le= 5M le= 250k le= 500k le= 1M le= +inf
  • 35.
    @a_bangser le= 1k le= 5M le= 250k le= 500k le= 1M le= +inf But we canstart collecting again Metrics le= 500k le= 30M le= 1M le= 5M le= 10M le= +inf
  • 36.
  • 37.
    @a_bangser Metrics Recap Metrics Strengths: + Cheapto gather & store + High level view over long periods of time + Discrete numbers make for easy math Weaknesses: ‐ Requires additional tools to debug ‐ Aggregated data ‐ Requires pre-determined questions
  • 38.
    @a_bangser Quick recap ontraces https://images.contentstack.io/v3/assets/bltefdd0b53724fa2ce/bltf85be52d51892228/5c98d45f8e3cc6505f19f678/three-pillars-of-observability-logs-metrics-tracs-apm.png Traces (APM)
  • 39.
    @a_bangser Tracing answers “where”based questions https://monzo.com/blog/we-built-network-isolation-for-1-500-services Each dot is one of 1,500 services Each line is one possible network call Each colour is a different team
  • 40.
    @a_bangser Tracing is acall stack for a distributed system https://medium.com/opentracing/take-opentracing-for-a-hotrod-ride-f6e3141f7941
  • 41.
    @a_bangser What services, inwhat order, and for how long https://medium.com/opentracing/take-opentracing-for-a-hotrod-ride-f6e3141f7941
  • 42.
    @a_bangser Trace recap Strengths: + Fullpicture of a request + Contains duration Weaknesses: ‐ Expensive to store ‐ Additional request details are optional
  • 43.
    @a_bangser Recap on thecurrent “3 pillar” approach https://images.contentstack.io/v3/assets/bltefdd0b53724fa2ce/bltf85be52d51892228/5c98d45f8e3cc6505f19f678/three-pillars-of-observability-logs-metrics-tracs-apm.png Traces (APM) MetricsLogs Strengths: + Can support long term tracking and in the moment debugging Weaknesses: ‐ Stores data in 3 different ways ($$$) ‐ Requires 3 different query languages ‐ Depends on knowing our questions upfront
  • 44.
    @a_bangser The 3 pillarsare better suited to Monitoring https://images.contentstack.io/v3/assets/bltefdd0b53724fa2ce/bltf85be52d51892228/5c98d45f8e3cc6505f19f678/three-pillars-of-observability-logs-metrics-tracs-apm.png Monitoring
  • 45.
    @a_bangser What is thedifference? https://lightstep.com/observability/
  • 46.
    @a_bangser Our journey today ✓Define observability ✓ Techniques that rely on observability ✓ Observability in testing and quality today ✓ What observability in testing and quality can be ✓ Current data structures and pitfalls ➔ Where to focus our investment now
  • 47.
    @a_bangser So let’s talkthe future https://images.contentstack.io/v3/assets/bltefdd0b53724fa2ce/bltf85be52d51892228/5c98d45f8e3cc6505f19f678/three-pillars-of-observability-logs-metrics-tracs-apm.png Events
  • 48.
    @a_bangser In short: Structured logsscoped around a single request
  • 49.
  • 50.
  • 51.
    @a_bangser How logs andevents are created @PostMapping("flip") public ResponseEntity flipImage(@RequestParam("image") MultipartFile file, @RequestParam(value = "vertical") Boolean vertical, @RequestParam(value = "horizontal") Boolean horizontal) { EVENT.addFields( new Pair("content.type", file.getContentType()), new Pair("action", "flip"), new Pair("flip_vertical", vertical), new Pair("flip_horizontal", horizontal)); LOGGER.info("Receiving {} image to flip.", file.getContentType()); byte[] flippedImage = imageService.flip(file, vertical, horizontal); LOGGER.info("Successfully flipped image id: {}", file.getId()); EVENT.addField("image_id", file.getId()); return new ResponseEntity<>(flippedImage, headers, HttpStatus.OK); } EVENT.addFields( new Pair("content.type", file.getContentType()), new Pair("action", "flip"), new Pair("flip_vertical", vertical), new Pair("flip_horizontal", horizontal)); LOGGER.info("Successfully flipped image id: {}", file.getId()"); LOGGER.info("Receiving {} image to flip.", file.getContentType()); EVENT.addField("image_id", file.getId());
  • 52.
  • 53.
    @a_bangser The event datacovers all log data
  • 54.
  • 55.
  • 56.
    @a_bangser All that AND: Requestbased allowing req. & Resp. data
  • 57.
    @a_bangser All that AND: Schema-lesseasily allowing new fields
  • 58.
  • 59.
    @a_bangser Explorability with thedata in one place ● Key numbers like latency and count ● Key variables like IDs ● Correlation between services
  • 60.
    @a_bangser Explorability with thedata in one place Strengths: + All visualisations can be derived including timelines and big picture view + Full context of a users request Weaknesses: ‐ Requires investment from engineers who know the app! ‐ Expensive to store ‐ Privacy risks for certain data
  • 61.
    @a_bangser There is workto do away from code too! ➔ Drive the virtuous cycle of deep domain knowledge supporting better data collection.
  • 62.
    @a_bangser There is workto do away from code too! ➔ Drive the virtuous cycle of deep domain knowledge supporting better data collection. ➔ Encourage the use of observability as a part of feature validation.
  • 63.
    @a_bangser ➔ Drive thevirtuous cycle of deep domain knowledge supporting better data collection. ➔ Encourage the use of observability as a part of feature validation. ➔ Keep asking high value questions and don’t settle until tools & data can answer them! There is work to do away from code too!
  • 64.
    Thank you! Let’s keepthe conversation going @a_bangser