This paper presents an imperfect manufacturing system in which production ability can produce items in m
production setups and rework the imperfect quality items in one rework setup. Rework is one of the main
issues in reverse logistic and green supply chain to reduce production cost and environmental problem.
The aim of this research is to minimize the total inventory cost by determining the optimal cycle time and
the optimal number of production setups. The convexity of the inventory model is derived by using
mathematical software. The result is illustrated with numerical example for the model. The effects of the
problem parameters upon the optimal solution are examined numerically. This model can be applied to
optimizing the total inventory cost for the business enterprises where production rate and demand rate are
time dependent and salvage value is incorporated to the deteriorated items.
INVESTAGATION OF THE PROCESS CAPABILITY OF WATER PUMP PLASTIC COVER MANUFACTU...IAEME Publication
In this study, a statistical analysis was conducted based on process capability indices
to investigate the ability of manufacturing process of a water pump plastic cover, which
is a product that is manufactured by the State Company for Electrical Industries in Iraq,
to meet the desired specifications. The
control charts, normal probability plot and
histogram were constructed based on the data gathered from the production line. Matlab
software was used to perform the statistical calculations and plot the graphs. It was found
that the process capability during manufacture was inadequate and incapable of
achieving the specified requirements for a significant number of manufactured products.
Adjusting the process capability index by decreasing the process mean to the target value
and reducing the variations of the process to meet the allowable product tolerance are
two recommendations suggested for improving the quality level of the production
IJRET : International Journal of Research in Engineering and Technology is an international peer reviewed, online journal published by eSAT Publishing House for the enhancement of research in various disciplines of Engineering and Technology. The aim and scope of the journal is to provide an academic medium and an important reference for the advancement and dissemination of research results that support high-level learning, teaching and research in the fields of Engineering and Technology. We bring together Scientists, Academician, Field Engineers, Scholars and Students of related fields of Engineering and Technology
International Journal of Computational Engineering Research (IJCER) is dedicated to protecting personal information and will make every reasonable effort to handle collected information appropriately. All information collected, as well as related requests, will be handled as carefully and efficiently as possible in accordance with IJCER standards for integrity and objectivity
Improving Supply Chain Activity using Simulationijsrd.com
The discovery through computational modeling and simulation has become the third pillar of science, alongside theory and experimentation. As computational power increases, simulation has gained in importance and has become a major research area, where highly parallel computation is utilized. In this dissertation, we have performed the simulation by selecting a single machine which is involved in manufacturing the highest number of products. Data are collected for all the processes involved in the manufacturing processes and an input modelling analysis is been done for the data collected. After the analysis is completed, a simulation model is constructed using ARENA which involved all the manufacturing process using the simulation tools. With the help of the simulation tools we will be able to identify activities causing the bottlenecks and delays in the entire manufacturing processes. Similarly, this simulation can be carried out for each and every machine of the company so that we can identify the bottlenecks and delays. As a result, the bottlenecks and delays can be reduced and the entire supply chain can be improved. This paper aims at combining supply chain management and simulation - to give an overview of both areas and shows how supply chain management can profit from simulation and also to identify the delays and bottlenecks in the overall manufacturing process. Lastly, a sample of how a supply chain can be optimized, in the simulation development suite ARENA.
Green supply chain management in Indian Electronics & Telecommunication IndustryIJESM JOURNAL
The study investigates the Green Supply Chain Management practices adopted by the Electronics & Telecommunication Industry in India. Study focuses on the impact of environmental collaboration in the supply chain on manufacturing and environmental performance. This paper used inductive and qualitative approaches to explore the salient factors that simultaneously enhance the “greening the supply chain” as well as maximizing the customer reach while maintaining the efficiency of the supply chain system of Electronics & Telecommunication Industry. A survey was conducted with key informants across many divisions of the Electronics & Telecommunication Industry to investigate how well these environmental and customer reach in the supply chain are in synchronized with the top management’s commitment towards environmental responsiveness and maximizing customer orientation. The responses to the survey were statistically analyzed and a relationship model was constructed with Market orientation as the dependent variable and independent variables as: environmental policies, supplier policies, commitment to human capital and diversity, sustainability and market orientation. The paper proposes to measure the performance of the corporation with respect to greening the supply chain, maximizing the reach of consumers and operational efficiency with a view of re-engineering the existing supply chain. The key indicators identified were environmental policies, supplier policies, sustainability, market orientation and commitment to human capital and diversity.
The main objective of this study is to increase the productivity against the demand. The Quality related issue regarding material&
material shortage online is not in the scope of this study. Taking a value stream perspective means working on the big picture, nota just
individual process; and not a just optimization but an actual improvement. It covers value adding as well as non-value-adding activities. This
study also includes layout improvement and time study report.
This research shows marking benefit associated with the implementation of lean program because this project shows an industrial case
study of MCCB manufacturing Assembly line.
Determinants of global competitiveness on industrial performance an applicati...eSAT Publishing House
IJRET : International Journal of Research in Engineering and Technology is an international peer reviewed, online journal published by eSAT Publishing House for the enhancement of research in various disciplines of Engineering and Technology. The aim and scope of the journal is to provide an academic medium and an important reference for the advancement and dissemination of research results that support high-level learning, teaching and research in the fields of Engineering and Technology. We bring together Scientists, Academician, Field Engineers, Scholars and Students of related fields of Engineering and Technology.
International Journal of Mathematics and Statistics Invention (IJMSI)inventionjournals
International Journal of Mathematics and Statistics Invention (IJMSI) is an international journal intended for professionals and researchers in all fields of computer science and electronics. IJMSI publishes research articles and reviews within the whole field Mathematics and Statistics, new teaching methods, assessment, validation and the impact of new technologies and it will continue to provide information on the latest trends and developments in this ever-expanding subject. The publications of papers are selected through double peer reviewed to ensure originality, relevance, and readability. The articles published in our journal can be accessed online.
In the competitive and economic market, Industries needs shorter lead time, low cost and high customer demand satisfaction. So such industries face cost reduction and efficiency challenges. To sustain and stabilize market industries have to find out ways to reduce production time, cost and elimination of waste to improve operating performance and product quality. Value stream mapping technique maps material flow, information flow, activities and other process elements that are part of supply chain. The visual picture simplifies lean approach by identifying the value-added and non-value added stages. The primary objective of this study is to increase the productivity against the demand. The Quality related issue regarding material & material shortage online is not in the scope of this study. A value stream means working on the big picture,
not a just individual process; and not a just optimization but an actual improvement. It covers value adding as well as non-value-adding activities
his research shows benefit associated with the implementation of the lean program. This case study shows a manufacturing industry case study.
IJREI_Selection model for material handling equipment’s used in flexible manu...Husain Mehdi
Material handling (MH) is important issue for every production site and has a great dependence upon the layout of the system. The important issue in the design of MH system is the selection of material handling equipment for every MH operation. Based upon the literature survey in this area, our purpose is to focus on the evaluation of the MHS-Layout of the system, due to their strong interdependence. The aim of this paper is to present a method for selection of material handling equipment (MHE) for flexible manufacturing system. In the first phase, the system consider major issues, rate of transfer, average time to transfer, flexibility etc., which is essential for the system. In second phase, the system selects the most feasible MHE types for every MH operation in a given application depends upon these major issues using fuzzy logic controller.
For more classes visit
www.snaptutorial.com
Observe the critical path diagram. Why are there two arrows pointing to task F?
Why is the critical path shown as A-B-E-G-I? How is the critical path defined?
What would happen if activity F was revised to take 4 days instead of 2days?our readers.
Automation of Material Handling: Design & Analysis of Bucket System on an Inc...IJRES Journal
Material handling systems are widely used in the industry for transportation of raw material, finished
product, storage and retrieval of materials. The increase cost of labor and manual work or operation is now
replaced by semiautomatic or automatic system. These low cost systems are not only cost efficient but also
enhance productivity & address the issues related to labor problem. Material handling equipment is designed
such that they make simple, economical, fast and safe loading and unloading with less human intervention. The
research work is related to develop an automated material Handling system MHS in the chemical Industry
where the bulk material transportation is done manually. The successful completion of this research work has
generated design and analysis of an automated bucket on inclined rail system for the chemical industry, which is
quick, efficient and safety to labor.
Improvement of Productivity Using Value Stream Mappingijsrd.com
one of the most appropriate ways to emerge the productivity for the particular area is through Lean Manufacturing. Value stream mapping is that lean manufacturing tool which helps to improve the productivity for the area through its detailed mapping. It is the visualize tool which describes the current state map followed by lean techniques resulting into the final state map that aiming at reduction of the non-value added activities throughout its phase. This paper illustrates the review of VSM techniques and its benefits in machining industry. The purpose of this paper is to highlight the effective utilization of the VSM tools for process and productivity improvements.
Toc Approach for Supply Chain Performance EnhancementWaqas Tariq
Field of Supply Chain Management witnessed rapid growth in recent past and proved to be a successful tool for organizations growth. Success of supply chain improvement initiative lies in selection of appropriate Key Performance Indicators (KPIs) using best suitable supply chain framework. These KPI’s are to be measured, monitored and controlled with proper review mechanism. This study presents a methodology for identification of the constraint KPI from the supply chain metrics. Selection of the KPI’s is done using Supply Chain Operations Reference (SCOR) framework. Analytical Hierarchy Process (AHP) is used for decomposing the goal into micro level for analyzing and prioritizing KPIs. Subsequently, benchmarking study is carried by comparing foundry industry KPIs with global best practice industry average. Goal Programming function is formulated using AHP ratings and solved using WINQSB software. Finally Theory of Constraint (TOC) management philosophy is applied for finding the constraints for supply chain performance enhancement.
ANALYZING THE PROCESS CAPABILITY FOR AN AUTO MANUAL TRANSMISSION BASE PLATE M...ijmvsc
The industry today is working intensively on a goal-oriented way towards introducing regular studies in
manufacturing. The current study is part of a large overall spanning project aiming towards an increase in
productivity, i.e. more products produced per year with availability. In this paper we have analyze what
Process Capability is and how it is implemented on a current process. All the steps are listed out in an easy
to understand manner. In current scenario, specifications for products have been tightened due to
performance competition in market. Statistical tools like control charts, process capability analysis and
cause and effect diagram ensure that processes are fit for company specifications while reduce the process
variation and improve product quality characteristic. Process capability indices (PCIs) are used in the
manufacturing process to provide numerical measures on whether a process is capable of producing items
within the predetermined limits. For the analysis purpose MINITAB 16.0 is used and is found that the
process is placed exactly at the centre of the control limits. Analysis also shows that process is not
adequate. The cause and effect diagram is prepared to found out the root cause of variation in diameter of
work. In this study, a process-capability analysis was also carried out in a medium-sized company that
produces machine and spare parts.
Adaptive Neuro-Fuzzy Inference System (ANFIS) Approach to Raw Material Invent...Dr. Amarjeet Singh
Raw material inventory control is important thing
for food companies. The adaptive inventory control is able to
adapt to changes in the environment, maintain system
performance and stability in the face of various problems in
the industry, one of which can be applied to controlling raw
material inventories. PT XYZ is a jelly drink industry that
has a high level of raw material inventory. In 2016 the
investment costs incurred by PT XYZ for carrageenan raw
materials ranged from 55-566 million IDR. Costs incurred
are quite high and require considerable handling in their
maintenance. Therefore, a solution is needed to minimize
inventory costs without disturbing the business process. The
purpose of this study is to analyse the raw materials
inventory PT XYZ for jelly drink product. The analysis is
carried out on the main raw material, namely agar
(carrageenan) which has three suppliers. The method used is
BPMN 1.0 and ANFIS (Adaptive Neuro Fuzzy Inference
Systems) which form rules of raw material control rules. This
method is an alternative decision making and accommodates
flexibility in the form of frame work that accommodates
uncertainty of information or data that is less accurate. This
study uses four input parameters, namely production
demand, raw material arrival, usage and stock. The output
obtained is in the form of inventory costs. The results of the
study are information regarding the role of each actor who
stores important data as a sequence of decision making. The
application of ANFIS to design a raw material inventory
control system using epoch 50 produces 90 rules of rules with
testing errors. The average test for the training dataset is
0,00077412 and the test and examination dataset is 0,0006903.
Rules of rules obtained can be applied to control raw material
inventories.
Software testing effort estimation with cobb douglas function a practical app...eSAT Publishing House
IJRET : International Journal of Research in Engineering and Technology is an international peer reviewed, online journal published by eSAT Publishing House for the enhancement of research in various disciplines of Engineering and Technology. The aim and scope of the journal is to provide an academic medium and an important reference for the advancement and dissemination of research results that support high-level learning, teaching and research in the fields of Engineering and Technology. We bring together Scientists, Academician, Field Engineers, Scholars and Students of related fields of Engineering and Technology.
Performance of Power Loom Textiles: A Resource-based ViewAM Publications
Despite increasing attention paid to the Resource-based View (RBV), there is a dearth of empirical evidence
on the interactions among different RBV performance dimensions and their effect on organizational performance.
This paper examines and to extend the literature, by obtaining an understanding of the link between resources,
capabilities and organizational performance in terms of operational performance, financial performance and non
financial performance by using a survey research in the framework of Resource-based View. The RBV involves the
different performance dimensions such as tangible assets, intangible assets and capabilities. Numerous prior studies
have sought to examine the links between resources and organizational performance in particular efficiency by
secondary data and using quantitative methods.
This paper involved a quantitative examination of the relationship between tangibles assets, intangibles assets
and capabilities and organizational performance of power loom textiles of Maharashtra (India). The primary data of
one hundred and sixty power loom textiles of Maharashtra is collected through questionnaire to examine the
relationship between tangibles assets, intangibles assets and capabilities with the operational performance. It also
examines the relationship between operational performance with the organizational performance. This study finds a
positive relationship between performance dimensions and organizational performance. The hypotheses are developed
in the framework of RBV and tested by using the statistical method.
Analysis of Two-Echelon Inventory System with Two Suppliersinventionjournals
Inventories exist throughout the supply chain in various form for various reasons. Since carrying these inventories can cost anywhere from 20-40 % of their value a year, managing them in a scientific manner to maintain minimal levels makes economic sense. This paper presents a continuous review two echelon inventory system. The operating policy at the lower echelon is (s, S) that is whenever the inventory level traps to s on order for Q = (S-s) items is placed, the ordered items are received after a random time which is distributed as exponential. We assume that the demands accruing during the stock-out period are lost. The retailer replenishes their stock from the regular supplier which adopts (0,M) policy, M = n1Q. When the regular supplier stock is empty the replacement of retailer stock made by the outside supplier who adopts (0, N) policy N = n2Q. The joint probability disruption of the inventory levels of retailer, regular supplier and the outside supplier are obtained in the steady state case. Various system performance measures are derived and the long run total expected inventory cost rate is calculated. Several instances of a numerical examples, which provide insight into the behaviour of the system are presented.
1-2-3 Play with Me! Recognizing and Valuing the Power of Playmilfamln
Across the lifespan, play serves a pivotal role in our development and learning. And while for the most part development unfolds in a predictable and logical set of stages and sequences, there is much we can do through play, to ensure happier and healthier children. This webinar will provide a context for seeing the power of play and how it is necessary for success in school and in life. Recommended practices and research on how to support children’s play will be provided.
Objectives:
1. Better understand the importance of play, exploration, and early experiences on development and learning
2. Use common play milestones and states as a guide to scaffold children’s ability to interact with objects and others
3. Analyze and evaluate a child’s current level of development and zone of proximal development when it comes to the stages of play
4. Deepen their commitment to fostering strong relationships with children and help them thrive by expanding the richness and complexity of their play
Desarrollo de la metacognición en el contexto escolar. Trabajo académico como parte del curso Procesos Cognitivos y Afectivos de la Pontificia Universidad Católica del Perú
• Make Versus Buy
• Benefit of Outsourcing
• Source of Supplier Information
• Strategis Selection
• Supplier Relationship Management (SRM)
• Industry Example
AN EOQ MODEL FOR TIME DETERIORATING ITEMS WITH INFINITE & FINITE PRODUCTION R...orajjournal
This manuscript deals in developing an EOQ model for time deteriorating items and allowing shortages in
the inventory. These shortages are considered to be completely backlogged. We have held that the
production rate is finite and infinite. In this manuscript, we developed EOQ models for perishable products
which consider continuous deterioration of a utility product and introduce an exponential penalty cost and
linear penalty cost function. The theoretical expressions are obtained for optimum cycle time and optimum
order quantity. The significant centre of our paper is to build up the EOQ model for time-deteriorating
items utilizing penalty cost with finite and infinite production rate. The mathematical solution of the model
has been done to obtain the optimal solution of the problem. The result is demonstrated with the help of
mathematical example. To conclude, sensitivity study is carried out with respect to the key parameters and
some managerial implications are also included. All the theoretical developments are numerically
justified.
International Journal of Engineering Research and Applications (IJERA) is an open access online peer reviewed international journal that publishes research and review articles in the fields of Computer Science, Neural Networks, Electrical Engineering, Software Engineering, Information Technology, Mechanical Engineering, Chemical Engineering, Plastic Engineering, Food Technology, Textile Engineering, Nano Technology & science, Power Electronics, Electronics & Communication Engineering, Computational mathematics, Image processing, Civil Engineering, Structural Engineering, Environmental Engineering, VLSI Testing & Low Power VLSI Design etc.
A production - Inventory model with JIT setup cost incorporating inflation an...IJMER
A production inventory model with Just-In-Time (JIT) set-up cost has been developed in which inflation and time value of money are considered under an imperfect production process. The demand rate is considered to be a function of advertisement cost and selling price. Unit production cost is considered incorporating several features like energy and labour cost, raw material cost and development cost of the manufacturing system. Development cost is assumed to be a function of reliability parameter.
Considering these phenomena, an analytic expression is obtained for the total profit of the model. The model provides an analytical solution to maximize the total profit function.A numerical example is presented to illustrate the model along with graphical analysis. Sensitivity analysis has been carried out to identify the most sensitive parameters of the model.
Impact of Variable Ordering Cost and Promotional Effort Cost in Deteriorated ...IJAEMSJORNAL
The instantaneous economic order quantity (EOQ) profit optimization model for deteriorating items is introduced for analyzing the impact of variable ordering cost and promotional effort cost for leveraging profit margins in finite planning horizons. The objective of this model is to maximize the net profit so as to determine the order quantity and promotional effort factor. For any given number of replenishment cycles the existence of a unique optimal replenishment schedule are proved and further the concavity of the net profit function of the inventory system in the number of replenishments is established. The numerical analysis shows that an appropriate policy can benefit the retailer, especially for deteriorating items. Finally, sensitivity analyses with respect to the major parameters are also studied to draw managerial decisions in production systems.
A MODEL FOR PRICING USED PRODUCTS AND REPLACEMENT PARTS IN REVERSE LOGISTICSijmvsc
A unique specification in remanufacturing is the uncertainty of returned flows. This makes the coordination
between supply and demand difficult for the firm. As a result, remanufacturers typically use pricing tools to
control the return flow of used products.
In this study, a model is presented for optimal quantity and price of used products and the price of used
products with replacement parts after collection and consolidation based on their quality levels. This model
was developed from the perspective of the remanufacturer and the consolidation center. When the
consolidation center receives the remanufacturer's demand, the consolidation center and the
remanufacturer use the proposed model for evaluating the optimal quantity and the acquisition price of
used products as well as the price provided by the remanufacturer to the consolidation center so that they
both reach maximum profit. The supply of used products is random. The presented model is an integer
nonlinear programming (INLP) model. Consequently, due to the complexity of the problem, The SA and GA
metaheuristic methods are used to solve the model
A Fuzzy Arithmetic Approach for Perishable Items in Discounted Entropic Order...Waqas Tariq
This paper uses fuzzy arithmetic approach to the system cost for perishable items with instant deterioration for the discounted entropic order quantity model. Traditional crisp system cost observes that some costs may belong to the uncertain factors. It is necessary to extend the system cost to treat also the vague costs. We introduce a new concept which we call entropy and show that the total payoff satisfies the optimization property. We show how special case of this problem reduce to perfect results, and how post deteriorated discounted entropic order quantity model is a generalization of optimization. It has been imperative to demonstrate this model by analysis, which reveals important characteristics of discounted structure. Further numerical experiments are conducted to evaluate the relative performance between the fuzzy and crisp cases in EnOQ and EOQ separately.
In paper (2004) Chang studied an inventory model under a situation in which the supplier provides the purchaser with a permissible delay of payments if the purchaser orders a large quantity. Tripathi (2011) also studied an inventory model with time dependent demand rate under which the supplier provides the purchaser with a permissible delay in payments. This paper is motivated by Chang (2004) and Tripathi (2011) paper extending their model for exponential time dependent demand rate. This study develops an inventory model under which the vendor provides the purchaser with a credit period; if the purchaser orders large quantity. In this chapter, demand rate is taken as exponential time dependent. Shortages are not allowed and effect of the inflation rate has been discussed. We establish an inventory model for deteriorating items if the order quantity is greater than or equal to a predetermined quantity. We then obtain optimal solution for finding optimal order quantity, optimal cycle time and optimal total relevant cost. Numerical examples are given for all different cases. Sensitivity of the variation of different parameters on the optimal solution is also discussed. Mathematica 7 software is used for finding numerical examples.
Modelling of repairable items for production inventory with random deteriorationiosrjce
Keeping in view the concern about environmental protection, the study incorporate the concept of repairing in a production inventory model consisting of production system and repairing system over infinite
planning horizon. This study presents a forward production and reverse repairing system inventory model with a time dependent random deterioration function and increasing exponentially demand with the finite production rate is proportional to the demand rate at any instant. The shortages allow and excess demand is backlogged. Expressions for optimal parameter are obtained .We also obtained Production and repairing scheduling period, maximum inventory level and total average cost. Using calculus, optimum production policy is derived, which minimizes the total cost incurred
INVENTORY MODEL FOR DETERIORATING ITEMS WITH QUADRATIC DEMAND, PARTIAL BACKLO...orajjournal
This article develops inventory model for deteriorating items with quadratic demand. Shortages are allowed. We study the partial delay in payments. The objective is to find the optimal cycle times that minimize the total cost. In this study first, we developed arithmetical model and procedure of finding the
most favorable solution is developed. Also the solution process is developed in order to minimize the total cost. The total costs are calculated by various principles. A solution process is developed to find the optimal solution and statistical examples are presented to demonstrate the result of the proposal model.
Compassion study of the most favorable solution with respect to the parameters of the system is carried out
and recommendations for further research are provided.
We are grateful to all JOSCM collaborators, associate editors, authors, reviewers and readers from this journal that help us, in many ways, to deliver the second edition of 2018. These eight papers illustrate from different theoretical and contextual perspectives some current topics in Operations Management and Supply Chain Management research such as risk management, international freight prices and health supply chain, among others. The last two papers are part of the Forum SIMPOI, which publishes the best papers from SIMPOI/2018 conference. I hope these papers bring relevant insights and advances for the development of our research area.
Bayesian approach for spare parts replenishment policies under uncertaintiesIJERD Editor
The legislative constraints, the need to optimize the dismantling process, the introduction of recycled
parts on the spare parts market are reinforced since the systems in end-of-life phase have become increasingly
profitable. There are few works that treat recycled spare parts integration problem in economic models of
inventory control. These works do not consider uncertainty. In order to manage more realistically the inventory
control of spare parts, we propose a probabilistic model formalized by a Bayesian network. The model is used to
identify the best purchase policy. More precisely, it allows choosing the best proportions between new spare
parts (NSP) and recycled spare parts (RSP) by taking into account the traditional criteria of inventory control
and the availability of the spare parts on the market. The proposed method provides a decision-making tool for
manufacturers who are interested both in reducing the costs of stocks and guaranteeing a minimal availability in
an uncertain environment.
Logistics and Supply Chain: An integrated production, inventory, warehouse lo...FGV Brazil
An integrated production, inventory, warehouse location and distribution model
Author: Lokendra Kumar Devangan
Journal of Operations and Supply Chain Management
Vol 9, No 2 (2016)
FGV's Brazilian School of Public and Business Administration (EBAPE)
Abstract:
This paper proposes an integrated production and distribution planning optimization model for multiple manufacturing locations, producing multiple products with deterministic demand at multiple locations. There are multiple modes of transport from plants to demand locations and warehouses. This study presents a model which allows decision makers to optimize plant production, transport and warehouse location simultaneously to fulfill the demands at customer locations within a multi-plant, multi-product, and multi-route supply chain system when the locations of the plants are already fixed. The proposed model is solved for sample problems and tested using real data from a cement manufacturing company in India. An analysis of the results suggests that this model can be used for various strategic and tactical production and planning decisions.
Similar to A MULTIPLE PRODUCTION SETUPS INVENTORY MODEL FOR IMPERFECT ITEMS CONSIDERING SALVAGE VALUE AND REDUCING ENVIRONMENTAL POLLUTION (20)
State of ICS and IoT Cyber Threat Landscape Report 2024 previewPrayukth K V
The IoT and OT threat landscape report has been prepared by the Threat Research Team at Sectrio using data from Sectrio, cyber threat intelligence farming facilities spread across over 85 cities around the world. In addition, Sectrio also runs AI-based advanced threat and payload engagement facilities that serve as sinks to attract and engage sophisticated threat actors, and newer malware including new variants and latent threats that are at an earlier stage of development.
The latest edition of the OT/ICS and IoT security Threat Landscape Report 2024 also covers:
State of global ICS asset and network exposure
Sectoral targets and attacks as well as the cost of ransom
Global APT activity, AI usage, actor and tactic profiles, and implications
Rise in volumes of AI-powered cyberattacks
Major cyber events in 2024
Malware and malicious payload trends
Cyberattack types and targets
Vulnerability exploit attempts on CVEs
Attacks on counties – USA
Expansion of bot farms – how, where, and why
In-depth analysis of the cyber threat landscape across North America, South America, Europe, APAC, and the Middle East
Why are attacks on smart factories rising?
Cyber risk predictions
Axis of attacks – Europe
Systemic attacks in the Middle East
Download the full report from here:
https://sectrio.com/resources/ot-threat-landscape-reports/sectrio-releases-ot-ics-and-iot-security-threat-landscape-report-2024/
GraphRAG is All You need? LLM & Knowledge GraphGuy Korland
Guy Korland, CEO and Co-founder of FalkorDB, will review two articles on the integration of language models with knowledge graphs.
1. Unifying Large Language Models and Knowledge Graphs: A Roadmap.
https://arxiv.org/abs/2306.08302
2. Microsoft Research's GraphRAG paper and a review paper on various uses of knowledge graphs:
https://www.microsoft.com/en-us/research/blog/graphrag-unlocking-llm-discovery-on-narrative-private-data/
The Art of the Pitch: WordPress Relationships and SalesLaura Byrne
Clients don’t know what they don’t know. What web solutions are right for them? How does WordPress come into the picture? How do you make sure you understand scope and timeline? What do you do if sometime changes?
All these questions and more will be explored as we talk about matching clients’ needs with what your agency offers without pulling teeth or pulling your hair out. Practical tips, and strategies for successful relationship building that leads to closing the deal.
Builder.ai Founder Sachin Dev Duggal's Strategic Approach to Create an Innova...Ramesh Iyer
In today's fast-changing business world, Companies that adapt and embrace new ideas often need help to keep up with the competition. However, fostering a culture of innovation takes much work. It takes vision, leadership and willingness to take risks in the right proportion. Sachin Dev Duggal, co-founder of Builder.ai, has perfected the art of this balance, creating a company culture where creativity and growth are nurtured at each stage.
Accelerate your Kubernetes clusters with Varnish CachingThijs Feryn
A presentation about the usage and availability of Varnish on Kubernetes. This talk explores the capabilities of Varnish caching and shows how to use the Varnish Helm chart to deploy it to Kubernetes.
This presentation was delivered at K8SUG Singapore. See https://feryn.eu/presentations/accelerate-your-kubernetes-clusters-with-varnish-caching-k8sug-singapore-28-2024 for more details.
Kubernetes & AI - Beauty and the Beast !?! @KCD Istanbul 2024Tobias Schneck
As AI technology is pushing into IT I was wondering myself, as an “infrastructure container kubernetes guy”, how get this fancy AI technology get managed from an infrastructure operational view? Is it possible to apply our lovely cloud native principals as well? What benefit’s both technologies could bring to each other?
Let me take this questions and provide you a short journey through existing deployment models and use cases for AI software. On practical examples, we discuss what cloud/on-premise strategy we may need for applying it to our own infrastructure to get it to work from an enterprise perspective. I want to give an overview about infrastructure requirements and technologies, what could be beneficial or limiting your AI use cases in an enterprise environment. An interactive Demo will give you some insides, what approaches I got already working for real.
Slack (or Teams) Automation for Bonterra Impact Management (fka Social Soluti...Jeffrey Haguewood
Sidekick Solutions uses Bonterra Impact Management (fka Social Solutions Apricot) and automation solutions to integrate data for business workflows.
We believe integration and automation are essential to user experience and the promise of efficient work through technology. Automation is the critical ingredient to realizing that full vision. We develop integration products and services for Bonterra Case Management software to support the deployment of automations for a variety of use cases.
This video focuses on the notifications, alerts, and approval requests using Slack for Bonterra Impact Management. The solutions covered in this webinar can also be deployed for Microsoft Teams.
Interested in deploying notification automations for Bonterra Impact Management? Contact us at sales@sidekicksolutionsllc.com to discuss next steps.
Key Trends Shaping the Future of Infrastructure.pdfCheryl Hung
Keynote at DIGIT West Expo, Glasgow on 29 May 2024.
Cheryl Hung, ochery.com
Sr Director, Infrastructure Ecosystem, Arm.
The key trends across hardware, cloud and open-source; exploring how these areas are likely to mature and develop over the short and long-term, and then considering how organisations can position themselves to adapt and thrive.
Connector Corner: Automate dynamic content and events by pushing a buttonDianaGray10
Here is something new! In our next Connector Corner webinar, we will demonstrate how you can use a single workflow to:
Create a campaign using Mailchimp with merge tags/fields
Send an interactive Slack channel message (using buttons)
Have the message received by managers and peers along with a test email for review
But there’s more:
In a second workflow supporting the same use case, you’ll see:
Your campaign sent to target colleagues for approval
If the “Approve” button is clicked, a Jira/Zendesk ticket is created for the marketing design team
But—if the “Reject” button is pushed, colleagues will be alerted via Slack message
Join us to learn more about this new, human-in-the-loop capability, brought to you by Integration Service connectors.
And...
Speakers:
Akshay Agnihotri, Product Manager
Charlie Greenberg, Host
Encryption in Microsoft 365 - ExpertsLive Netherlands 2024Albert Hoitingh
In this session I delve into the encryption technology used in Microsoft 365 and Microsoft Purview. Including the concepts of Customer Key and Double Key Encryption.
Elevating Tactical DDD Patterns Through Object CalisthenicsDorra BARTAGUIZ
After immersing yourself in the blue book and its red counterpart, attending DDD-focused conferences, and applying tactical patterns, you're left with a crucial question: How do I ensure my design is effective? Tactical patterns within Domain-Driven Design (DDD) serve as guiding principles for creating clear and manageable domain models. However, achieving success with these patterns requires additional guidance. Interestingly, we've observed that a set of constraints initially designed for training purposes remarkably aligns with effective pattern implementation, offering a more ‘mechanical’ approach. Let's explore together how Object Calisthenics can elevate the design of your tactical DDD patterns, offering concrete help for those venturing into DDD for the first time!
UiPath Test Automation using UiPath Test Suite series, part 3DianaGray10
Welcome to UiPath Test Automation using UiPath Test Suite series part 3. In this session, we will cover desktop automation along with UI automation.
Topics covered:
UI automation Introduction,
UI automation Sample
Desktop automation flow
Pradeep Chinnala, Senior Consultant Automation Developer @WonderBotz and UiPath MVP
Deepak Rai, Automation Practice Lead, Boundaryless Group and UiPath MVP
Epistemic Interaction - tuning interfaces to provide information for AI supportAlan Dix
Paper presented at SYNERGY workshop at AVI 2024, Genoa, Italy. 3rd June 2024
https://alandix.com/academic/papers/synergy2024-epistemic/
As machine learning integrates deeper into human-computer interactions, the concept of epistemic interaction emerges, aiming to refine these interactions to enhance system adaptability. This approach encourages minor, intentional adjustments in user behaviour to enrich the data available for system learning. This paper introduces epistemic interaction within the context of human-system communication, illustrating how deliberate interaction design can improve system understanding and adaptation. Through concrete examples, we demonstrate the potential of epistemic interaction to significantly advance human-computer interaction by leveraging intuitive human communication strategies to inform system design and functionality, offering a novel pathway for enriching user-system engagements.
From Siloed Products to Connected Ecosystem: Building a Sustainable and Scala...
A MULTIPLE PRODUCTION SETUPS INVENTORY MODEL FOR IMPERFECT ITEMS CONSIDERING SALVAGE VALUE AND REDUCING ENVIRONMENTAL POLLUTION
1. Operations Research and Applications : An International Journal (ORAJ), Vol.4, No.1, February 2017
DOI : 10.5121/oraj.2017.4101 1
A MULTIPLE PRODUCTION SETUPS
INVENTORY MODEL FOR IMPERFECT ITEMS
CONSIDERING SALVAGE VALUE AND
REDUCING ENVIRONMENTAL POLLUTION
R. Uthayakumar1
and T. Sekar*
1
Department of Mathematics,
The Gandhigram Rural Institute – Deemed University,
Gandhigram – 624 302, Dindigul, Tamilnadu, India,
*Department of mathematics,
EBET Group of institutions, Tirupur – 638 108,
Tamil Nadu, India.
ABSTRACT
This paper presents an imperfect manufacturing system in which production ability can produce items in m
production setups and rework the imperfect quality items in one rework setup. Rework is one of the main
issues in reverse logistic and green supply chain to reduce production cost and environmental problem.
The aim of this research is to minimize the total inventory cost by determining the optimal cycle time and
the optimal number of production setups. The convexity of the inventory model is derived by using
mathematical software. The result is illustrated with numerical example for the model. The effects of the
problem parameters upon the optimal solution are examined numerically. This model can be applied to
optimizing the total inventory cost for the business enterprises where production rate and demand rate are
time dependent and salvage value is incorporated to the deteriorated items.
KEYWORDS
Deteriorating items, Rework, Salvage value, Linear time varying demand
1. INTRODUCTION:
The Economic Production Quantity (EPQ) model is commonly used by practitioners in the fields
of production, inventory control and management to assist them in making decision on production
lot size. Many researchers have discussed on the EPQ model for the multi-production setups. But
very few of them have discussed on multi-production setups with rework. Rework is common in
Semiconductor, Pharmaceutical, Chemical, Food industries, Textile industries, Paper industries,
Glass industries, Metal processing industries and Plastic industries. Barketau et al. (2008);
2. Operations Research and Applications : An International Journal (ORAJ), Vol.4, No.1, February 2017
2
Buscher et al. (2007); Chiu et al. (2007). Ca´rdenas-Barro´ n, L.E., (2008) presented rework with
single stage of production system. Recently, rework process have attracted considerable attention
because of the reduction of the natural resources and the rise of cost of the raw material. Rework
process play an important role in eliminating waste and effectively controlling the cost of
manufacturing in a production system. Therefore, determining optimal lot size in a system that
allows rework is a useful objective to minimize the total inventory cost. Rework process reduces
energy use and save more natural resources for the future generations. Therefore, the companies
are contributing to sustainable development.
In this paper, we consider a multi-production setups and one rework setup. By this EPQ model, it
is determined that optimal production setup and optimal production time. Since production
process in each production setup is imperfect because of human mistakes, (Drury and Prabhu,
(1994)), non-perfect technology or many other factors, the imperfect items are produced during
production period. In order to provide good service to customers, after each production setup,
inspection is carried out to screen out the imperfect quality items and the deteriorating items. The
imperfect quality items found is stocked separately in an inventory until reach the optimal
production setup. The rework process starts immediately after determined production setup ends.
The perfect quality items produced in each production setup is stored separately in an inventory
and sold to customers immediately. Both perfect and imperfect items are considered as
deteriorating items because their values go down with time. After determined production setup
ends, the imperfect items are sent to rework. When the waiting time of the imperfective quality
items exceeds the deterioration time limit, they cannot be recovered and must be disposed. The
rework process manufactures all imperfect quality items as perfect quality items. We assume all
imperfect items after rework are considered as new. This perfect quality items are sold to
customers to satisfy the demand immediately. Production process with rework setup is shown in
Fig. 1.
The remainder of this paper is organized as follows. In Section 2, we give a literature review. In
section 3, assumptions and notations are given. The mathematical formulation for this model is
given in section 4. Numerical example and sensitivity analysis are given in Section 5, and
conclusions are drawn in Section 6.
Figure-1: Production process with rework setup.
3. Operations Research and Applications : An International Journal (ORAJ), Vol.4, No.1, February 2017
3
2. LITERATURE REVIEW:
Economic Production Quantity (EPQ) model is one of the prominent research topics in
production, inventory control and management. By using EPQ model, optimal quantity of items
and optimal production time can be obtained. Classical EPQ model was developed under various
assumptions. Since then, researchers have extended the model by relaxing one or more of its
assumptions. It was assumed that the items produced are of perfect quality items in the classical
model. However, imperfect quality items may be produced in reality. Wee et al., (2007) extended
the model by considering random defective rate. Jaber et al. (2008) assumed the percentage
defective per lot reduces according to a learning curve. Mukhopadhyay et al. (2015) investigated
an economic production quantity model for three types of imperfect items with rework. Vandana
et al. (2015) presented an inventory model for non-instantaneous deteriorating items with
quadratic demand rate and shortages under trade credit policy. Rezaei et al. (2001) considered a
supply chain with multiple products and multiple suppliers. Chung et al. (2009) proposed an
inventory model with two warehouses, where one of them was rented. Yassine et al. (2012)
considered disaggregating the shipments of imperfect quality items in a single production run and
aggregating the shipments of imperfect items over multiple production runs. Kumar et al. (2011)
presented Economic Production Lot Size (EPLS) model with the stochastic demand and shortage
partial backlogging rate under imperfect quality items, in which stochastic imperfect production
was assumed. Singh et al. (2015) presented a mathematical production inventory model for
deteriorating items with time dependent demand rate under the effect of the inflation and
shortages. Rezaei et al. (2012) discussed an economic production quantity and purchasing price
for items with imperfect quality when inspection shifts from buyer to supplier. Vandana et al.
(2016) investigated an EOQ model for retailers partial permissible delay in payment linked to
order quantity with shortages. Felix. et al. (2015) presented a modified EPQ model with
deteriorating production system and deteriorating product where rework process was considered
at the end of production setup. Mishra. V.K, et al. (2013) considered an inventory model for
deteriorating items with time-dependent demand and time varying holding cost under partial
backlogging. Shilpi Pal et al. (2015) proposed a production inventory model for deteriorating
item with ramp type demand allowing inflation and shortages under fuzziness, in which, multi-
production setup was considered without rework. Chandra et al. (2015) introduced the effect of
deterioration on two-warehouse inventory model with imperfect quality items. Vandana et al.
(2015) introduced an EPQ inventory model for non-instantaneous deteriorating item under trade
credit policy. Mishra (2007) derived some problems on approximations of functions in Banach
spaces. Deepmala (2014) proposed a study on fixed point theorems for nonlinear contractions and
its applications.
Rework process is also one of the important issue in reverse logistics where used products are
reworked to reduce total inventory cost, waste and environmental pollution. The earliest research
that focused on rework and remanufacturing process was done by Schrady (1967). Since then,
researchers on rework have attracted many researchers. Khouja (2000) considered direct rework
for Economic Lot Sizing and Delivery Scheduling Problem (ELDSP). Koh et al. (2002) discussed
on production inventory models where supplier can fill the demand in two alternatives: either
orders new products externally or recovers defective items are reworked in the same cycle; and in
the second policy, rework is completed after N cycles. Inderfuth et al. (2005) considered an EPQ
model with rework and deteriorating recoverable products. Yoo et al. (2009) developed an EPQ
model with imperfect production, imperfect inspection and rework. Widyadana et al. (2012)
proposed an EPQ model for deteriorating items with rework which was performed after m
4. Operations Research and Applications : An International Journal (ORAJ), Vol.4, No.1, February 2017
4
production setups. Tai (2013) proposed an EPQ model for deteriorating/imperfect product with
rework which was performed after a production setup. Sarkara et al. (2014) assumed rework for
single stage production system. Hsu et al. (2014) considered An EPQ model under an imperfect
production process with shortages backordered. Singh et al. (2014) proposed an economic
production model for time dependent demand with rework and multiple production setups where
production is demand dependent.
We notice that not many studies considered a model with multi-production setups, imperfect
items, rework and salvage value is incorporated to the deteriorated items. In this paper, we intend
to providing analytic results to solve the issues said above.
3. ASSUMPTIONS AND NOTATIONS
3.1 ASSUMPTIONS
1. Demand rate of finished products at any time ′′ݐ in (0, T) is D()ݐ and assumed to be linearly
decreasing.
2. Production rate is demand dependent i. e, ܲ = ߣ)ݐ(ܦ where ߣ ≥ 1.
3. Rework and deterioration rate are constants.
4. There is a replacement for deteriorated items.
5. Shortages and stock outs are not allowed.
6. The production rate of perfect quality items and rework must be greater than the demand rate.
7. No machine breakdown occurs in the production run and rework period.
8. All demands are satisfied.
9. Inspection cost is negligible when compare with other costs.
10. Setup time for rework process is zero.
11. All the imperfect quality items can be reproduced to good quality. No imperfect quality items
occurs during the rework process.
3.2 NOTATIONS
D(t) Demand rate (unit/year)
P(t) Production rate (unit/year)
P୰ Rework process rate (unit/year)
θ(t) Deterioration rate (unit/year)
α Percentage of good quality items
m Number of production setup in one cycle
Di Total deteriorating units (unit)
Ks Production setup cost ($/setup)
Kr Rework setup cost ($/setup)
hs Perfect quality items holding cost ($/unit/year)
hr Imperfect quality items holding cost ($/unit/year)
Dc Deteriorating cost ($/unit)
I1 Inventory level of perfect quality items in a production period
I2 Inventory level of perfect quality items in a non -production period
Ir1 Inventory level of imperfect quality items in a production period
Ir2 Inventory level of imperfect quality items in a non - production period
5. Operations Research and Applications : An International Journal (ORAJ), Vol.4, No.1, February 2017
5
Ir3 Inventory level of imperfect quality items in a rework production period
It1 Total inventory level of perfect quality items in a production period
It2 Total inventory level of perfect quality items in a non - production period
It3 Total inventory level of perfect quality items in a rework production period
It4 Total inventory level of perfect quality items in a rework non-production
Period
TTIଵ Total inventory level of imperfect quality items in a production period
Iv1 Total inventory level of imperfect quality items in m production periods
TTIଶ Total inventory level of imperfect quality items in a non-production period
Iv2 Total inventory level of imperfect quality items in m non - production period
Iv3 Total inventory level of imperfect quality items in a rework setup production
period
TRI Total inventory level of imperfect quality items
IMr Maximum inventory level of imperfect quality items in production setups
IEr Maximum inventory level of imperfect quality items when rework process started
T1 Regular production period
T2 Non - production period
T3 Rework process period
T4 Rework non-process period
TCT Total cost per unit time
C Cost per unit
γC Salvage value associated with deteriorated units during a cycle time (0 < ߛ < 1)
4. FORMULATION OF THE MODEL
The inventory level of perfect quality items in three production setups is shown in Figure -1.
The cycle begins with zero inventory and starts at time t = 0. Production is performed during T1
time period. Since the production quality is not perfect, a percentage (1-α) imperfect items is
assumed to occur during the regular production process (T1). The amount of imperfect quality
items produced per unit time is (1- α)P. The rework process starts after m-production setups.
The rework process is performed in T3 time period. The Inventory level of perfect items in a
production period can be formulated as:
ௗூభ(௧భ)
ௗ௧భ
+ ߠܫଵ(ݐଵ) = ߙܲ − ݐ(ܦଵ) 0 ≤ ݐଵ ≤ ܶଵ (1)
where D()ݐ = ܽ − ܾݐ where ܽ is the intercept and ܾ is the slope of the linearly decreasing
demand function.
6. Operations Research and Applications : An International Journal (ORAJ), Vol.4, No.1, February 2017
6
Figure-2: Inventory level of perfect quality items in 3 production setups and 1 rework setup.
Figure-3: Inventory level of imperfect quality items in 3 production setup and 1 rework setup.
Since I1 (0) = 0,the inventory level in a production period is
Iଵ(tଵ) =
ఈఒିଵ
ఏ
ቂݐ(ܦଵ) +
− ݁ିఏ௧భ ቀܽ +
ఏ
ቁቃ 0 ≤ ݐଵ ≤ ܶଵ (2)
The total inventory in a production up time can be modeled as
I୲ଵ(tଵ) =
ߙߣ − 1
ߠ
න ݐ(ܦଵ) +
ܾ
ܽ
− ݁ିఏ௧భ ൬ܽ +
ܾ
ߠ
൰൨ ݀ݐଵ
்భ
I୲ଵ =
ఈఒିଵ
ఏమ ቂߠܽܶଵ − ܾ ቀ
ఏ்భ
మ
ଶ
− ܶଵቁ + ቀܽ +
ఏ
ቁ ൫݁ିఏ்భ − 1൯ቃ
For small value of ߠܶଵand using Taylor series approximation, we get
I୲ଵ =
(ఈఒିଵ)்భ
మ
ଶ
. (3)
The inventory level in a non-production period is represented by
ௗூమ(௧మ)
ௗ௧మ
+ ߠܫଶ(ݐଶ) = −ݐ(ܦଶ) 0 ≤ ݐଶ ≤ ܶଶ (4)
7. Operations Research and Applications : An International Journal (ORAJ), Vol.4, No.1, February 2017
7
Since Iଶ(Tଶ) = 0 and using similar procedure we get the total inventory in a non-production
period can
be represented as
I୲ଶ(tଶ) = ቂ
(்మ)
ఏ
+
ఏమቃ ݁ఏ(்మି ௧మ)
− ቂ
(௧మ)
ఏ
+
ఏమቃ (5)
I୲ଶ =
ୈ(మ)మ
మ
ଶ
. (6)
Since Iଵ = Iଶ when ݐଵ = ܶଵ and ݐଶ = 0, we get the total inventory in a non-production period
can be represented as
ߙߣ − 1
ߠ
ݐ(ܦଵ) +
ܾ
ܽ
− ݁ିఏ்భ ൬ܽ +
ܾ
ߠ
൰൨ =
ܶ(ܦଶ)
ߠ
+
ܾ
ߠଶ൨ ݁ఏ்మ −
ܽ
ߠ
+
ܾ
ߠଶ൨
ܶଶ ≅
(ఈఒିଵ)ൣଶ்భି (ఏା)்భ
మ൧
ଶ
(7)
Using similar steps as above, the total inventory level of perfect quality items in a rework
production period and the total inventory level of perfect quality items in a rework non-
production period time are derived as follows:
I୲ଷ =
(౨ି ) య
మ
ଶ
(8)
I୲ସ =
(்ర) ర
మ
ଶ
(9)
Since Iଷ = Iସ when ݐଷ = ܶଷ and ݐସ = 0, we get
ܶସ ≅
(ೝି)்యି
ഇయ
మ
మ
൨ା
್య
మ
మ
(10)
The inventory level of imperfect quality items is shown in Figure-2. The inventory level of
imperfect quality items in a production period can be modeled as
ௗூೝభ(௧ೝభ)
ௗ௧ೝభ
+ ߠܫଵ(ݐଵ) = (1 − ߙ)ܲ 0 ≤ ݐଵ ≤ ܶଵ (11)
Since I୰ଵ(0) = 0, the inventory level of imperfect quality items in a production period is
8. Operations Research and Applications : An International Journal (ORAJ), Vol.4, No.1, February 2017
8
ܫଵ(ݐଵ) = ߣ(ߙ − 1) ቄቀ
ఏ
+
ఏమቁ ൫1 − ݁ିఏ௧ೝభ൯ −
௧ೝభ
ఏ
ቅ 0 ≤ ݐଵ ≤ ܶଵ (12)
Using Taylor series approximation, the total inventory level of imperfect quality items in a
production up time in one setup is
TTIଵ =
ఒ(ଵି ఈ)்భ
మ
ଶ
(13)
Since there are ݉ production setups in one cycle, the total inventory level of imperfect quality
items in one cycle is:
I୴ଵ =
ఒ(ଵି ఈ) ்భ
మ
ଶ
(14)
The initial inventory level of imperfect quality items in each production setup is equal to I୰ and
it can be modeled as:
I୰ = ߣ(1 − ߙ) ቂቀ
+
ఏమቁ ൫1 − ݁ିఏ்భ൯ −
ఏ
ܶଵቃ
Using Taylor series approximation, we get
I୰ = ߣ(1 − ߙ) ቂܽܶଵ − (ܽߠ + ܾ)
்భ
మ
ଶ
ቃ (15)
The inventory level of imperfect quality items in a non-production period as:
ௗூೝమ(௧ೝమ)
ௗ௧ೝమ
+ ߠܫଶ(ݐଶ) = 0 0 ≤ ݐଶ ≤ (݉ − 1)ܶଵ + ݉ܶଶ (16)
Since the inventory level ܫଶ(0) = I୰ , the inventory level of imperfect quality items in a
non-production time for each production setup can be modeled as:
ܫଶ(ݐଶ) = I୰ eି୲౨మ 0 ≤ ݐଶ ≤ (݉ − 1)ܶଵ + ݉ܶଶ (17)
Using Taylor series expansion, the total inventory of imperfect quality items in a production
down time in one setup is:
TTIଶ = ∑ I୰ ቄሾ(k − 1)Tଵ + kTଶሿ −
ሾ(୩ିଵ)భା ୩మሿమ
ଶ
ቅ
ୀଵ (18)
The total inventory of imperfect quality items in m production periods can be modeled as follows:
I୴ଶ = ∑ IMr ቄሾ(k − 1)T1 + kT2ሿ −
θሾ(k−1)T1+ kT2ሿ2
2
ቅ
ୀଵ (19)
Inventory level of imperfect quality items in the end of production cycle is equal to maximum
9. Operations Research and Applications : An International Journal (ORAJ), Vol.4, No.1, February 2017
9
inventory level of imperfect quality items in a production setup reduced by deteriorating rate
during production up time and down time. The maximum inventory level of imperfect quality
items can be formulated as follows:
I୰ = ∑ I୰ eିሾ(୩ିଵ)భା ୩మሿ
ୀଵ (20)
Using Taylor series expansion and then substituting I୰ we get
I୰ = ∑ ቄλ(1 − α)(ܽܶଵ − (ܽߠ + ܾ)
்భ
మ
ଶ
ቅ ൝
1 − θሾ(k − 1)Tଵ + kTଶሿ
+
ሼሾ(୩ିଵ)భା ୩మሿሽమ
ଶ
ൡ
ୀଵ (21)
The inventory level of imperfect quality items in a rework period can be formulated as:
ௗூೝయ(௧ೝయ)
ௗ௧ೝయ
+ ߠܫଷ(ݐଷ) = − ܲ 0 ≤ ݐଷ ≤ ܶଷ (22)
The inventory level of imperfect quality item in a rework period is:
ܫଷ(ݐଷ) =
ೝ
ఏ
ൣ݁ఏ(்యି ்ೝయ)
− 1൧ (23)
The total inventory of imperfect quality items in a rework period is:
ܫଷ(ݐଷ) =
ೝ
ఏ
ൣ݁ఏ(்యି ௧ೝయ)
− 1൧ ݀ݐଷ
்య
௧ೝయୀ
(24)
Using Taylor series expansion, we get
I୴ଷ =
౨య
మ
ଶ
(25)
When ݐଷ = 0, the number of imperfect quality items inventory is equal to I୰. Equation (24)
becomes
I୰ =
ೝ
ఏ
ൣ݁ఏ்య − 1൧ (26)
Since ߠܶଷ ≪ 1 and using Taylor series expansion results in:
ܶଷ =
୍ు౨
ೝ
(27)
Substitute I୰ we have
ܶଷ =
ଵ
ೝ
∑ ቄλ(1 − α)(ܽܶଵ − (ܽߠ + ܾ)
்భ
మ
ଶ
ቅ ൝
1 − θሾ(k − 1)Tଵ + kTଶሿ
+
ሼሾ(୩ିଵ)భା ୩మሿሽమ
ଶ
ൡ
ୀଵ (28)
The total inventory level of imperfect items is
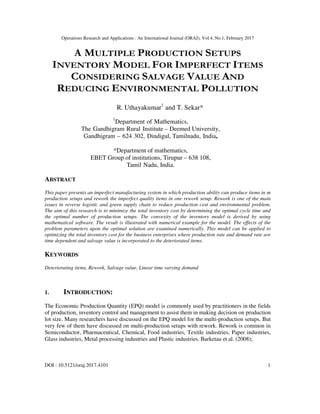
10. Operations Research and Applications : An International Journal (ORAJ), Vol.4, No.1, February 2017
10
ܴܶܫ = I୴ଵ + I୴ଶ + I୴ଷ
ܴܶܫ =
ఒ(ଵି ఈ) ்భ
మ
ଶ
+ ∑ I୰ ቄሾ(k − 1)Tଵ + kTଶሿ −
ሾ(୩ିଵ)భା ୩మሿమ
ଶ
ቅ
ୀଵ +
౨య
మ
ଶ
(29)
The number of deteriorating item is equal to the number of items produced minus the number
of total demands. The total deteriorating units can be modeled as:
ܦ = (݉ߙߣܶଵ ݂()ݐ + ܲ ܶଷ) − )ݐ(ܦሾ݉(ܶଵ + ܶଶ) + ܶଷ + ܶସሿ (30)
The total inventory cost consists of production setup cost, rework setup cost, perfect items
inventory cost, imperfect quality items inventory cost and deteriorating cost. The total
inventory cost per unit time can be modeled as follows:
ܶ,݉(ܶܥ ܶଵ) =
ೞା ೝା ೞሾ(It1+ It2)+ It3+ It4ሿା ೝ(்ோூ)ା ି ఊ
ሾ(T1+ T2)+ T3+ T4ሿ
(31)
The optimal solution must satisfy the following condition:
డሾ்்(,்భ)ሿ
డ்భ
= 0 (32)
And the optimal solution of m, denoted by m*, must satisfy the following condition:
ܶ݉(ܶܥ∗
− 1, ܶଵ) ≥ ܶ݉(ܶܥ∗
, ܶଵ) ≤ ܶ݉(ܶܥ∗
+ 1, ܶଵ) (33)
Since the cost function equation (31) is a nonlinear equation and the second derivative of
equation (31) with respect to ܶଵ is extremely complicated, closed form solution of (31) cannot
be derived. However, by means of Maple mathematical software, one can indicate that
equation (31) is convex for a small value of ܶଵ. The optimal ܶଵ value can be obtained using
Maple mathematical software. Fig-4 shows that the total cost (TC1) per unit time is convex for
small values of T1. The optimal total cost is equal to $ 1446.17 when T1
*
= 0.03186 and ݉∗
= 3.
Figure-4: Total cost per unit time in varies of T1
11. Operations Research and Applications : An International Journal (ORAJ), Vol.4, No.1, February 2017
11
5. NUMERICAL EXAMPLE AND SENSITIVITY ANALYSIS
In this section, a numerical example and sensitivity analysis are given to illustrate the model.
Let Ks = $ 8 per production setup, Kr = $ 5 per rework setup, Pr = 10 units per unit time , C = $
1000 per unit, hs = $4 per unit per unit time, hr = $2 per unit per unit time, Dc = $8 per unit, a =
100, b = 0.2, ߣ = 8, γ = 0.3, α = 0.8, θ = 0.06. The total cost, TC1 =TCT(m, T1) per unit time
for varying T1 is shown in Figure-4. Fig-4 shows that the total cost per unit time is convex for
small values of T1. The optimal total cost is equal to $1446.17 when ݉∗
= 3.
The sensitive analysis is performed by changing each of the parameters by -60%, -40%, -20%,
+20%, +40% and +60%. One parameter is taken at a time and the remaining parameters are
kept unchanged. The m and T1 values for different values of parameters are shown in Table-
1.Table-1 shows that the number of production setup is sensitive to the changes in parameters
hs, hr and θ. The number of production setup(m) increases with increasing hs and decreases
when the value of parameters hr and θ increase. But the optimal production setup (݉∗
) is not
sensitive to other parameters. The optimal production time (T1
*
) decreases with the increasing
Pr, a, hr and Dc values and it increases when the value of parameters Ks, b, γ, hs and θ increase.
The optimal production period for varying parameters is shown in Fig-5. The figure shows that
the optimal production period is sensitive to changes in θ, temperately sensitive to changes in
hr and insensitive to changes in the other parameters.
The optimal total cost per unit time for varying parameters is shown in Table-2. The Table-2
shows that the total cost per unit time increases when the value of parameters Ks, Kr, a, γ
increases and decreases when the value of parameters Pr, b, Dc increases. But there is a
fluxuation when changing the parameters hr, hs and θ. The optimal total cost is sensitive to θ,
hs, hr and moderately sensitive to changes in a, γ and insensitive to the changes in the other
parameters.
Fig-6 shows that the total inventory cost per unit time for varying parameters. The total cost
per unit time sensitive to changes in the parameters θ, γ, hs and moderately sensitive to changes
in the parameters a and b. the inventory cost is insensitive with the other parameters.
12. Operations Research and Applications : An International Journal (ORAJ), Vol.4, No.1, February 2017
12
Table-1: Sensitivity analysis of m and T1.
Para-
meter
- 60 %
changed
- 40 %
changed
- 20 %
changed
+ 20 %
changed
+ 40 %
changed
+60 %
changed
m T1 m T1 m T1 m T1 m T1 m T1
Ks 3 0.03185 3 0.03185 3 0.03186 3 0.03186 3 0.03187 3 0.03187
Kr 3 031860 3 0.03186 3 0.03186 3 0.03186 3 0.03186 3 0.03186
Pr 3 0.03189 3 0.03188 3 0.03187 3 0.03185 3 0.03184 3 0.03183
a 3 0.03265 3 0.03221 3 0.03199 3 0.03177 3 0.03171 3 0.03166
b 3 0.03153 3 0.03164 3 0.03175 3 0.03197 3 0.03208 3 0.03219
γ 3 0.03142 3 0.03157 3 0.03171 3 0.0320 3 0.03215 3 0.03229
hs 2 0.03171 2 0.03263 3 0.03116 3 0.03252 3 0.03314 3 0.03373
hr 3 0.0368 3 0.03431 3 0.03285 3 0.03115 2 0.03273 2 0.03221
Dc 3 0.03187 3 0.03187 3 0.03186 3 0.03186 3 0.03185 3 0.03185
θ 3 0.02248 3 0.02521 3 0.02835 2 0.0381 1 0.04744 1 0.05189
Figure-5: T1 sensitivity analysis
Table-2: Sensitivity analysis for the total cost per unit time($)
0
0.01
0.02
0.03
0.04
0.05
0.06
Ks
Kr
Pr
a
b
γ
hs
hr
Dc
13. Operations Research and Applications : An International Journal (ORAJ), Vol.4, No.1, February 2017
13
Para-
meter
-60 %
changed
- 40 %
changed
- 20 %
changed
+ 20 %
changed
+ 40 %
changed
+60 %
changed
Ks 1423.630768 1431.144844 1438.658467 1453.682105 1461.192045 1468.701608
Kr 1441.475399 1443.040361 1444.605323 1447.735248 1449.30021 1450.865173
Pr 1496.999113 1480.084067 1463.141156 1429.171361 1412.144288 1395.088969
a 89.34710077 544.936701 996.3801418 1895.135588 2343.629474 2791.830108
b 1899.920936 1749.304135 1598.054555 1293.649444 1140.490171 986.69063
γ 696.4724061 947.5418524 1197.432327 1693.782443 1940.291696 2185.722348
hs 817.6149026 1992.216038 225.3036874 2642.342372 3816.210375 4969.760648
hr 4636.914177 3678.203827 2594.017105 260.9441034 2999.770418 2339.404367
Dc 1466.020425 1459.404589 1452.78819 1439.552382 1432.933049 1426.313076
θ 11977.94625 8656.874909 5172.802685 1541.711816 4644.169125 3221.004949
Figure-6: Total cost per unit time sensitivity analysis
0
2000
4000
6000
8000
10000
12000
14000
Ks
Kr
Pr
a
b
γ
hs
hr
14. Operations Research and Applications : An International Journal (ORAJ), Vol.4, No.1, February 2017
14
6. CONCLUSION
This paper deals with an EPQ model for deteriorating/imperfect quality items with linearly
decreasing demand and demand dependent production setup. In this model, imperfect quality
items are allowed and reworked to maintain as good quality and goodwill of the customers. This
model helps to management to determine number of production setup and optimum production
time by minimizing the total inventory cost. Sensitivity analysis shows that the number of
production setup decrease when holding cost of perfect quality items decreases and holding cost
of imperfect quality items increases and also it shows that both the number of production setups
and optimum production time are highly sensitive with deteriorating items. Hence the
management has to take vital decisions while maintaining inventory with deteriorating items.
A possible extension for further research may consider multi-production setups with
partial/complete backordering where holding cost and deterioration rate are time dependent. This
approach can also be extended to other problem by considered delay payment, inflation, unit cash
discount, stock-dependent demand and single-vendor single-buyer problem.
REFERENCES
[1] Barketau, M. S., Cheng T. C. E., Kovalyov, M. Y., (2008). Batch scheduling of deteriorating
reworkables. European Journal of Operational Research, 189, 1317–1326.
[2] Buscher, U., Lindner, G., (2007). Optimizing a production system with rework and equal sized batch
shipments. Computers and Operations Research, 34, 515–535.
[3] Ca´rdenas-Barro´n, L.E., (2008). Optimal manufacturing batch size with rework in a single-stage
production system – A simple derivation. Computers & Industrial Engineering, 55, 758–765.
[4] Chandra K.J., Tiwari. S., Shafi. A (2015). Effect of deterioration on two-warehouse inventory model
with imperfect quality. Computers & Industrial Engineering 88 (2015) 378–385.
[5] Chiu, S.W., Wang, S.L., Chiu, Y.P., (2007). Determining the optimal run time for EPQ model with
scrap, rework, and stochastic breakdowns. European Journal of Operational Research, 180, 664–
676.
[6] Chung, C.J., Wee, H.M., (2011). Short life-cycle deteriorating product remanufacturing in a green
supply chain inventory control system. International Journal of Production Economics, 129(1), 195–
203.
[7] Chung, K.J., Her, C.C., Lin, S.D., (2009). A two-warehouse inventory model with imperfect quality
production processes. Computers & Industrial Engineering, 56(1), 193–97.
[8] Deepmala., (2014). A Study on Fixed Point Theorems for Nonlinear Contractions and its
Applications, Ph.D. Thesis. Pt. Ravishankar Shukla University, Raipur (Chhatisgarh) India – 492
010.
[9] Drury, C. G. (1978). Integrating human factors models into statistical quality control. Human
Factors: The Journal of the Human Factors and Ergonomics Society, 20(5), 561–572.
[10] Drury, C. G., Prabhu, P. V., (1994). Human factors in test and inspection. In G. Salvendy &
W. Karwowski (Eds.), Design of work and development of personnel in advanced manufacturing
(pp. 355–401). New York: John Wiley & Sons Inc.
[11] Felix. N. Li., Chan. T.S., Chung. S.H., Allen H. Tai., (2015). A Modified EPQ model with
deteriorating production system and deteriorating product. Proceedings of the world congress on
mechanical, chemical, and material engineering (MCM 2015). Barcelona, Spain, July 20 - 21, Paper
No. 249
[12] Hsu. L.F., Hsu. J. T (2014). Economic production quantity (EPQ) models under an imperfect
production process with shortages backordered. International Journal of Systems Science, 47(4),
852-867.
15. Operations Research and Applications : An International Journal (ORAJ), Vol.4, No.1, February 2017
15
[13] Inderfuth, K., Lindner, G., Rachaniotis, N.P., (2005). Lot sizing in a production system with rework
and product deterioration. International Journal of Production Research 43, 1355–1374.
[14] Jaber, M.Y., Goyal, S.K., Imran, M., (2008). Economic production quantity model for items with
imperfect quality subject to learning effects. International Journal of Production Economics, 115(1),
143–50.
[15] Khouja, M., (2000). The economic lot and delivery scheduling problem: common cycle, rework, and
variable production rate. IIE Transactions 32, 715–725.
[16] Koh., S.G., Hwang, H., Sohn, K.I., Ko, C.S., (2002). An optimal ordering and recovery policy for
reusable items. Computers & Industrial Engineering 43, 59–73.
[17] Kumar. M., Chauhan. A., Kumar. P., (2011). Economic Production Lot size Model with Stochastic
Demand and Shortage Partial Backlogging Rate under Imperfect Quality Items. Int. J. of Advanced
Science & Tech. 31, 1-22.
[18] Mishra. V. N., (2007). Some Problems on Approximations of Functions in Banach Spaces, Ph.D.
Thesis. Indian Institute of Technology, Roorkee - 247 667, Uttarakhand, India.
[19] Mishra. V. K, Singh. L.S., Kumar. R., (2013). An inventory model for deteriorating items with time-
dependent demand and time-varying holding cost under partial backlogging. Journal of Industrial
Engineering International, doi:10.1186/2251-712x-9-4.
[20] Mukhopadhyay. A., Goswami. A., (2015). Economic production quantity model for three type
imperfect items with rework and learning in setup. An international journal of Optimization and
control: Theories & Applications, 4(1), 57-65.
[21] Pal.S., Mahapatra. G.S., Samanta. G.P. (2015). Aproduction model for deteriorating item with ramp
type demand allowing inflation and shortages under fuzziness. Economic modelling 46, 334- 345.
[22] Rezaei. J., Davoodi, M., (2008). A deterministic, multi-item inventory model with supplier selection
and imperfect quality. Applied Mathematical Modelling, 32(10), 2106–16.
[23] Rezaei. J., Salimi. N., (2012). Economic order quantity and purchasing price for items with
imperfect quality when inspection shifts from buyer to supplier. Int. J. Production Economics 137,
11–18.
[24] Sarkara. B., Cárdenas-Barrón. L.E., Sarkar. M., Singgih. M.L., (2014). An economic production
quantity model with random defective rate, rework process and backorders for a single stage
production system. Journal of Manufacturing Systems, 33, 423–435.
[25] Schrady, D.A., (1967). A deterministic inventory model for repairable items. Naval Research
Logistics 48, 484–495.
[26] ShilpiPal, Mahapatra. G.S., Samanta. G.P. (2015). Aproduction model for deteriorating item with
ramp type demand allowing inflation and shortages under fuzziness. Economic modelling 46, 334-
345.
[27] Singh, S. R., Shalini. J., Pareek. S., (2014). An economic production model for time dependent
demand with rework and multiple production setups. International Journal of Industrial Engineering
Computations 5, 305–314.
[28] Singh, S.R., Agarwal. A., Smita Rani., (2015). Mathematical production inventory model for
deteriorating items with time dependent demand rate under the effect of inflation and shortages.
International Journal of Computer & Mathematical Sciences, 4, 138-148.
[29] Tai, A. H., (2013). Economic production quantity models for deteriorating/imperfect products and
service with rework. Computers & Industrial Engineering, 66(4), 879-88.
[30] Vandana, B.K. Sharma., (2015). An EPQ inventory model for non-instantaneous deteriorating item
under trade credit policy. International Journal of Mathematical Sciences and Engineering
Applications. (IJMSEA), 9 (No. I), pp. 179-188.
[31] Vandana, B.K. Sharma., (2015). An inventory model for Non-Instantaneous deteriorating items with
quadratic demand rate and shortages under trade credit policy. Journal of Applied Analysis and
Computation, in press.
[32] Vandana, B.K. Sharma., (2016). An EOQ model for retailers partial permissible delay in payment
linked to order quantity with shortages. Mathematics and Computers Simulation.
http://dx.doi.org/10.1016/j.matcom.2015.11.008
16. Operations Research and Applications : An International Journal (ORAJ), Vol.4, No.1, February 2017
16
[33] Wee, H.M., Yu, J., Chen, M.C., ( 2007). Optimal inventory model for items with imperfect quality
and shortage backordering. Omega, 35(1), 7–11.
[34] Widyadana, G. A., Wee, H. M. (2012). An economic production quantity model for deteriorating
items with multiple production setups and rework. International Journal of Production Economics,
138(1), 62–67.
[35] Yassine, A., Maddah, B., Salameh, M., (2012). Disaggregation and consolidation of imperfect
quality shipments in an extended EPQ model. International Journal of Production Economics,
135(1), 345–52.
[36] Yoo, S.H., Kim, D.S., Park, M.S., (2009). Economic production quantity model with imperfect-
quality items, two-way imperfect inspection and sales return. International Journal of Production
Economics 121, 255–265.
NOTES ON CONTRIBUTORS
Mr T.Sekar is a Part-Time research scholar, Department of Mathematics,
Gandhigram Rural Institute –Deemed University, Gandhigram – 624302, Tamil Nadu,
India. He received his B. Sc degree from Govt. arts college karur, Bharathidasan
University, M. Sc and M. Phil degree from National College, Trichy, Bharathidasan
University, Tamil Nadu, India. Currently, he is working in EBET Group of Institutions,
Tirupur, Tamil Nadu, India. His research interests are in the field of inventory management
and control, optimization techniques and their applications.
Dr R. Uthayakumar was born in Dindigul, India, in 1967. He received the PhD degree
from the Gandhigram Rural Institute –Deemed University, Gandhigram, Tamil Nadu,
India, in 2000. Currently, he is a Professor & Head, Department of Mathematics,
Gandhigram Rural Institute –Deemed University, Gandhigram. He has done research in
the area of functional analysis. His current research interests are primarily in the field of
optimization and the Theory of Fractal Analysis. He is also interested in finding out the
general mathematical model in the field of inventory management and supply chain. To his credit, he has
published many research articles in the area of inventory management and supply chain in reputed
international journals. Moreover, he is guiding many scholars in the above said areas.