Download to read offline


![25
Kim, S. (1993). "The relative effectiveness of hands-on and computer-simulated manipulative in
teaching seriation, classification, geometric, and arithmetic concepts to kindergarten children."
Dissertation Abstracts International 54(09): 3319.
Koedinger, K. R., J. R. Anderson, et al. (1997). " Intelligent tutoring goes to school in the big
city." International Journal of Artificial Intelligence in Education 8: 30-43.
Kozma, R. (2001). Learning with media. Classic writings on instructional technology. T. P. Ely
D. Colorado, Libraries unlimited, Inc.: 155-188.
Kulik, C. and C. Kulik (1991). "Effectiveness of computer-based instruction: An updated
analysis." computers in Human Behavior 7: 75-94.
Kulik, C. and J. Kulik (1986). "Effectiveness of computer-based education in colleges." AEDS
Journal 19: 81-108.
Kulik, J., R. Bangert-Drowns, et al. (1983). "Effects of computer based teaching on secondary
school students." Journal of Educational Psychology 75(1): 19-26.
Kulik, J., C. Kulik, et al. (1980). "Effectiveness of computer-based college teaching: A meta-
analysis of findings." Review of Educational Research 50: 525-544.
Kulik, K., B. Schwalb, et al. (1982). "Programmed instruction in secondary education: A meta-
analysis of evaluation findings." Journal of Educational Research 75(3): 133-138.
Li, Q. (2004). Technology and mathematics education: Any impact? the Eleventh International
Literacy and Education Research Network Conference on Learning, La Havana.
Lipsey, M. and D. Wilson (2001). Practical meta-analysis. Thousand Oaks, SAGE Publications.
Lou, Y., P. C. Abrami, et al. (2001). "Small group and individual learning with technology: A
meta-analysis." Review of educational research 71(3): 449-521.
Means, B. (1994). The technology and eductional forform: The reality behind the promise. San
Francisco, Jossey-Bass.
National Council of Teachers of Mathematics [NCTM] (2000). Principles and Standards for
School Mathematics. Reston, VA., Author.
Niemiec, R., G. Samson, et al. (1987). "The effects of computer-based instruction inclementary
schools: A quantitative synthesis." Journal for Research on Computing in Education 20: 85-103.
Niemiec, R. and H. Walberg (1985). "Computers and achievement in the elementary schools."
Journal of Educational Computing Research 1: 435-440.](https://image.slidesharecdn.com/ameta-analysisoftheeffectsofcomputertechnologyonschoolstudentsmath-170611120632/85/A-meta-analysis-of_the_effects_of_computer_technology_on_school_students-_math-25-320.jpg)


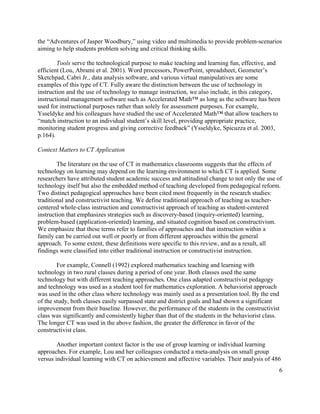
This study analyzed 85 independent research studies involving over 36,000 K-12 students to determine the impact of computer technology on mathematics learning. The meta-analysis found statistically significant positive effects, with computer technology promoting greater mathematics achievement for elementary students compared to secondary students. Special needs students also benefited more than general education students. Studies employing constructivist teaching approaches in conjunction with computer technology reported larger effects than those using traditional teaching. The analysis identified several technology, implementation, and learner characteristics that influence mathematics achievement outcomes.


![C:\Fakepath\Technology And Learning Kinast & Swan Smith [B]](https://cdn.slidesharecdn.com/ss_thumbnails/cfakepathtechnologyandlearningkinastswansmithb-100215082742-phpapp02-thumbnail.jpg?width=640&height=640&fit=bounds)
![Technology And Learning Kinast & Swan Smith [B]](https://cdn.slidesharecdn.com/ss_thumbnails/technologyandlearningkinastswansmithb-100215122326-phpapp01-thumbnail.jpg?width=640&height=640&fit=bounds)


