A Historical Cost/Benefit Analysis of Urban Tree Canopy and Dutch Elm Disease in Milwaukee, WI
•Download as PPTX, PDF•
2 likes•919 views

Ian Hanou

Recommended
Recommended
More Related Content
Similar to A Historical Cost/Benefit Analysis of Urban Tree Canopy and Dutch Elm Disease in Milwaukee, WI
Similar to A Historical Cost/Benefit Analysis of Urban Tree Canopy and Dutch Elm Disease in Milwaukee, WI (20)
More from Arbor Day Foundation
More from Arbor Day Foundation (20)
Recently uploaded
Recently uploaded (20)
A Historical Cost/Benefit Analysis of Urban Tree Canopy and Dutch Elm Disease in Milwaukee, WI
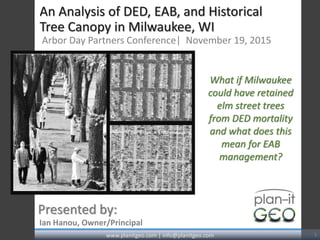
- 1. An Analysis of DED, EAB, and Historical Tree Canopy in Milwaukee, WI Arbor Day Partners Conference| November 19, 2015 Ian Hanou, Owner/Principal Presented by: www.planitgeo.com | info@planitgeo.com 1 What if Milwaukee could have retained elm street trees from DED mortality and what does this mean for EAB management?
- 2. David Sivyer, Milwaukee Forestry Services Manager Rich Hauer, Ph.D., Univ. of Wisconsin, Stevens Point Ian Hanou and Richard Thurau, Ph.D., Plan-It Geo Wisconsin DNR (50% of funding) Collaborators www.planitgeo.com | info@planitgeo.com 2
- 3. Background and Purpose Historical Tree Canopy Ecosystem and Economic Methods Management Scenario Modeling Take Homes Overview www.planitgeo.com | info@planitgeo.com 3 Background Historical Canopy Eco & Economic Methods Mgmt. Scenario Modeling Take Homes Questions
- 4. Aggressive pathogens are devastating urban forests UF pest management is often reactive UF management is being driven by canopy benefits Total cost to restore canopy from major pests is staggering and poorly understood. Background 4 Background Historical Canopy Eco & Economic Methods Mgmt. Scenario Modeling Take Homes Questions Background www.planitgeo.com | info@planitgeo.com
- 5. When was the low point in Milwaukee’s canopy? What was the cumulative loss in benefits from >100k DED elm removals? What is the B/C to have maintained elms, requiring what level of maintenance? How long did it take to recover? What lessons can be applied to EAB? What can we model of the elm population (structural attributes, mortality, growth, and condition)? Management Questions of this Study 5 Background Historical Canopy Eco & Economic Methods Mgmt. Scenario Modeling Take Homes Questions Background www.planitgeo.com | info@planitgeo.com
- 6. Street tree population and EAB impacts ~195,000 street trees 31,500 ash street trees Or 16% loss of ROW canopy $46M structural damage $27M remove and replace cost (3” cal.) Current EAB approach in MKE Treat ash every other year ($3.75/dia. inch, 18” avg. DBH, $33.75/yr) Case study for phased conservation / treatment and flat-lining budgets Background: EAB in MKE www.planitgeo.com | info@planitgeo.com 6 Background Historical Canopy Eco & Economic Methods Mgmt. Scenario Modeling Take Homes Questions Background
- 7. Lack of science/research/options in 1960’s in MKE MKE 1956 elm population: 106,738 Currently <1,000 Removals peaked @ 16,580 in 1968 > 10,000/year for 4 years straight Replanting peaked @ 18,966 in 1970 Avg. 11,000/year from 1956-1982 Less on maintenance / beautification for 1-2 decades Background: DED Impact in MKE www.planitgeo.com | info@planitgeo.com 7 0 2,000 4,000 6,000 8,000 10,000 12,000 14,000 16,000 18,000 20,000 1956 1957 1958 1959 1960 1961 1962 1963 1964 1965 1966 1967 1968 1969 1970 1971 1972 1973 1974 1975 1976 1977 1978 1979 1980 1981 1982 1983 1984 1985 1986 1987 1988 1989 1990 1991 1992 1993 1994 1995 MKE Trees Planted by Year Background Historical Canopy Eco & Economic Methods Mgmt. Scenario Modeling Take Homes Questions Background
- 8. Urban trees provide quantifiable benefits / value Benefits can outweigh costs (positive B/C) Risk management / sanitation scenarios No DED Do Nothing Actual Fair Good Best Assumptions and Approaches www.planitgeo.com | info@planitgeo.com 8 Source: Cannon and Worley 1976 Background Historical Canopy Eco & Economic Methods Mgmt. Scenario Modeling Take Homes Questions Background
- 9. Modeling Inputs and Tools Used www.planitgeo.com | info@planitgeo.com 9 Elm population (cohorts) Avg. DBH by cohort elm pop. Mortality – natural and from DED – by sanitation level (management scenarios) Growth Benefits (i-Tree and CTLA) Costs (DED/EAB-PLANS) Inflation CPI / PPI) Background Historical Canopy Eco & Economic Methods Mgmt. Scenario Modeling Take Homes Questions Background
- 10. Canopy Cover Estimation Aerial Examples Methods Imagery Used Results Phase 1: Historical Tree Canopy Baseline 10 Background Historical Canopy Eco & Economic Methods Mgmt. Scenario Modeling Take Homes Questions Historical Canopy www.planitgeo.com | info@planitgeo.com
- 11. Historical Canopy Cover Estimation 11www.planitgeo.com | info@planitgeo.com
- 12. Elm Loss Over Time, Neighborhood Scale 1956 1979 12 Historical aerial view of continuous street tree canopy cover in Milwaukee along West Capitol Drive (Top), North 27th Street (West), North Teutonia Ave (East), West Vienna Ave (South) www.planitgeo.com | info@planitgeo.com
- 13. Canopy Loss From 2013 to 1956 Canopy Points All Other Points Study Area: Rights-of-Way Sample Points: Rights-of-Way Sample Points: Citywide Historical Canopy Cover Estimation Methods 13www.planitgeo.com | info@planitgeo.com
- 14. Imagery Year Spectral Bands Known or Approximate Resolution Example 1956 Black & White ¼ meter 1963 Black & White ¼ meter 1969 Black & White ¼ meter 1979 Black & White ½ meter 1986 Color Infrared 1 meter 2013 True Color (NAIP) 1 meter Historical Imagery Used 14 Background Historical Canopy Eco & Economic Methods Mgmt. Scenario Modeling Take Homes Questions Historical Canopy www.planitgeo.com | info@planitgeo.com
- 15. Year Canopy Points (of 500) Canopy Cover S.E. (±) C.I. (±) Canopy Area (Acres) Canopy Change by time period (Acres) % Change from prior assessment year 1956 1,500 8.7% 0.7 1.4 5,365 N/A N/A 1963 1,500 12.5% 0.9 1.8 7,754 2,389 44.5% 1969 1,000 10.0% 0.9 1.8 6,188 -1,566 -20.2% 1979 1,000 14.3% 1.1 2.2 8,849 2,661 43.0% 1986 1,000 14.6% 1.1 2.2 9,035 186 2.1% 2008 0 20.5% N/A N/A 12,663 3,628 40.2% 2013 1,500 22.7% 1.1 2.2 14,066 1,403 11.1% Historical Canopy Cover: Citywide 15 Background Historical Canopy Eco & Economic Methods Mgmt. Scenario Modeling Take Homes Questions Historical Canopy www.planitgeo.com | info@planitgeo.com
- 16. Year Canopy Points (of 500) Canopy Cover S.E. (±) C.I. (±) Canopy Area (Acres) Proportion of All Canopy Citywide Canopy Change (Acres) % Change 1956 96 19.2% 1.8 3.5 2,731 51% N/A N/A 1963 119 23.8% 1.9 3.7 3,385 44% 654 24.0% 1969 80 16.0% 1.6 3.1 2,275 37% -1,109 -32.8% 1979 63 12.6% 1.5 2.9 1,792 20% -484 -21.3% 1986 71 14.2% 1.6 3.1 2,019 22% 228 12.7% 2008 0 25.7% N/A N/A 3,655 27% 1,636 81.0% 2013 116 23.2% 1.9 3.7 3,299 23% -356 -9.7% Historical Canopy Cover: Rights-of-Way 16 Background Historical Canopy Eco & Economic Methods Mgmt. Scenario Modeling Take Homes Questions Historical Canopy www.planitgeo.com | info@planitgeo.com
- 17. Historical Canopy Cover: City vs. ROW 17 In 23 years, the proportion of canopy in the ROW to the entire city dropped from 51% to just 20%, due to DED removals and increase private-property canopy. Background Historical Canopy Eco & Economic Methods Mgmt. Scenario Modeling Take Homes Questions Historical Canopy www.planitgeo.com | info@planitgeo.com
- 18. •Elm Pop. Modeling for Historical Tree Attributes •Ecosystem Benefits Assessment Modeling • i-Tree Eco (benefit assessment & valuation) • CTLA Valuation •Economic Modeling • Management Costs (DED-PLANS / CTLA) Phase 2: Ecosystem and Economic Modeling 18 Background Historical Canopy Eco & Economic Methods Mgmt. Scenario Modeling Take Homes Questions Ecosystem & Economic Methods www.planitgeo.com | info@planitgeo.com
- 19. Elm Street Tree Structure Estimates Year Tree Structure Estimates All Tree Species AOI ROW % Canopy % Canopy Estimate City Wide Elm Tree Diameter (in) Elm Tree Height (ft) Elm Crown Width (ft) 1956 19.2 8.7 11.78 32.92 24.89 1963 23.8 12.5 14.6 36.14 28.93 1969 16 10 16.2 38.7 32.4 1979 12.6 14.3 19.6 42.63 38.18 1986 14.2 14.6 21.98 45.18 42.23 2008 25.7 21.9 29.46 N/A N/A 2013 23.2 22.7 31.16 N/A N/A 19 Background Historical Canopy Eco & Economic Methods Mgmt. Scenario Modeling Take Homes Questions Ecosystem & Economic Methods www.planitgeo.com | info@planitgeo.com
- 20. Elm Pop. by Mgmt. Scenario 1956-1996 0 20,000 40,000 60,000 80,000 100,000 120,000 0 2 4 6 8 10 12 14 16 18 20 22 24 26 28 30 32 34 36 38 40 NumberofTrees Years Number of Trees Surviving No Control Fair Control Good Control Best Control Actual Outcome No DED 20 Background Historical Canopy Eco & Economic Methods Mgmt. Scenario Modeling Take Homes Questions Ecosystem & Economic Methods www.planitgeo.com | info@planitgeo.com
- 21. Ecosystem Service Types: Actual vs. “Best” 21 Background Historical Canopy Eco & Economic Methods Mgmt. Scenario Modeling Take Homes Questions Ecosystem & Economic Methods www.planitgeo.com | info@planitgeo.com
- 22. 22 Combined Annual Ecosystem Services by Sanitation (Management) Level “Good” is half of “Best” after 40 years Background Historical Canopy Eco & Economic Methods Mgmt. Scenario Modeling Take Homes Questions Ecosystem & Economic Methods www.planitgeo.com | info@planitgeo.com
- 23. $11.2M in lost stormwater management benefits $74.0M in lost air pollution removal benefits $27.3M in lost energy savings benefits $8.3M in lost carbon sequestration/storage benefits Total of $120.8M in lost ecosystem benefits (1956 – 2013) 23 Cumulative “Foregone” Ecosystem Services (“Best”, net from Actual) Background Historical Canopy Eco & Economic Methods Mgmt. Scenario Modeling Take Homes Questions Ecosystem & Economic Methods www.planitgeo.com | info@planitgeo.com
- 24. 24 Cumulative “Foregone” Ecosystem Services (net compared with Actual)Background Historical Canopy Eco & Economic Methods Mgmt. Scenario Modeling Take Homes Questions Ecosystem & Economic Methods www.planitgeo.com | info@planitgeo.com
- 25. 25 Costs: DED-PLANning Simulator) Background Historical Canopy Eco & Economic Methods Mgmt. Scenario Modeling Take Homes Questions Ecosystem & Economic Methods
- 26. •DED Management Costs NPV B/C Method Comparison •EAB Management NPV B/C • Take Homes Phase 3: Management Scenario Modeling 26 Background Historical Canopy Eco & Economic Methods Mgmt. Scenario Modeling Take Homes Questions Mgmt. Scenario Modeling www.planitgeo.com | info@planitgeo.com
- 27. Like it or not, urban pests (DED) will cost you $$ Background Historical Canopy Eco & Economic Methods Mgmt. Scenario Modeling Take Homes Questions Mgmt. Scenario Modeling www.planitgeo.com | info@planitgeo.com
- 28. Net Benefit of DED Management Background Historical Canopy Eco & Economic Methods Mgmt. Scenario Modeling Take Homes Questions Mgmt. Scenario Modeling www.planitgeo.com | info@planitgeo.com
- 29. Net Benefit of DED Management Background Historical Canopy Eco & Economic Methods Mgmt. Scenario Modeling Take Homes Questions Mgmt. Scenario Modeling www.planitgeo.com | info@planitgeo.com
- 30. $13,419,019 $3,410,017 $14,316,026 $14,762,930 $9,119,333 $2,185,120 $0 $12,129,979 $0 $18,885,048 $0 $0 $0 $5,000,000 $10,000,000 $15,000,000 $20,000,000 $25,000,000 $30,000,000 No Control Treatment Preemptive Removal Preemptive Remove & Replant ManagementCost Management Option Treatment Cost Planting Cost Removal Cost EAB Management: it will cost you money Background Historical Canopy Eco & Economic Methods Mgmt. Scenario Modeling Take Homes Questions Mgmt. Scenario Modeling www.planitgeo.com | info@planitgeo.com
- 31. EAB Management: Net Benefit 32 Background Historical Canopy Eco & Economic Methods Mgmt. Scenario Modeling Take Homes Questions Mgmt. Scenario Modeling www.planitgeo.com | info@planitgeo.com
- 32. Do Nothing is the lowest cost, if you don’t look at benefits. Take Home’s 33 Background Historical Canopy Eco & Economic Methods Mgmt. Scenario Modeling Take Homes Questions Take Homes www.planitgeo.com | info@planitgeo.com Urban trees are a long-range solution, but don’t make shortsighted decisions Focus on the host population, not the pest, for proactive management & flat-line budgets Benefits from one ecosystem service, e.g. air pollution reduction, can pay for UF pest management alone. Active management of urban forest pests results in net benefits, if trees have value.
- 33. Alberta, Canada: Still DED Free 34
- 35. Contacts Ian Hanou, Owner and Director, Business Development IanHanou@PlanItGeo.com A geospatial analysis, technology consulting, and planning firm specializing in urban natural resource management. Info@PlanItGeo.com www.planitgeo.com www.facebook.com/PlanItGeo 36 David Sivyer, Forestry Services Manager, City of Milwaukee David.Sivyer@milwaukee.gov Dr. Rich Hauer, University of Wisconsin, Stevens Point Richard.Hauer@uwsp.edu
Editor's Notes
- Dutch elm disease, Asian Long-Horned Beetle, Emerald Ash Borer, Thousand Cankers, etc. EAB Trapping and monitoring – Ineffective Funding for Urban and Community Forestry is inadequate to sustain vibrant community forests APHIS pest management priorities can be misguided Cities lack tools and understanding to make long-term management decisions Traditional forest economics drives management decisions based on projected long term outcomes or values –not so in urban forest management as long term costs and benefits needed to make life of stand decisions are poorly understood or typically not considered when facing a forest pest crisis Cost-benefits that consider the cumulative ecological services benefits (forgone or preserved) and future maintenance costs required to fully recover from massive canopy loss are not well understood Where is the Urban Forests Economics class in universities with Urban Forestry curriculum? As more becomes known about the benefit values associated with a well managed urban forests are increasingly being managed (and funded) based on UTC benefits
- Best Control: 4 Sanitations Inspections annually, Removal within 20 days symptoms (flagging) Good Control: 3 sanitation Inspections annually (Removal within 20 days of detection) Fair Control: 2 sanitation Inspections annually (Removal within 20 days of detection)
- Best Control: 4 Sanitations Inspections annually, Removal within 20 days symptoms (flagging) Good Control: 3 sanitation Inspections annually (Removal within 20 days of detection) Fair Control: 2 sanitation Inspections annually (Removal within 20 days of detection)
- This was our Hurricane Andrew. DED caused a catastrophic loss of street tree canopy in Milwaukee and countless other cities, towns and villages throughout the Midwest and Northeast. It was the catalyst for accelerated advancement of Urban Forestry as a profession.
- Ask Rich for source of data
- First did per tree | Then did cohort | Then compared for each eco service across time b/w actual and best
- used data from the City of Milwaukee when possible
- the cost is higher for No DED (right) than Do Nothing: No DED is much higher from pruning costs of the greater # of trees. With DED trees die, pruning costs greatly diminish in the near term. The point of the slide is with decision making with only costs you could argue lets trees die it's cheaper.
- the cost is higher for No DED (right) than Do Nothing: No DED is much higher from pruning costs of the greater # of trees. With DED trees die, pruning costs greatly diminish in the near term. The point of the slide is with decision making with only costs you could argue lets trees die it's cheaper.
- This shows the BC ratios using the CTLA approach (rather than i-Eco)
- Emerald ash borer management costs
- Take Home: All scenarios when dealing with an aggressive forest pathogen will cost money. All Scenarios (Fair, Good, Best) for DED yield a positive return on investment. The Net Benefit of a Best Management Scenario would have resulted in an elm population with an Asset value of $160 Million in 1996 versus a $17 Million asset for the actual elm population. Benefit/Cost ratio for I Eco Valuation Analysis = Total Eco Benefits/Total Management Cost Benefit/Cost Ratio for DED-PLANS economic analysis = Total Economic Benefit based on CTLA valuation/Total Management Cost In Both Scenarios, Total Management Cost is derived through DED-Plans The Mean Structural Value for the 40 Year period is added to the Total Cumulative Functional Benefits to derive Total Eco Benefits Structural Values reflect a value in time (not cumulative) and this is why the mean for the 40 year time period was used Costs in MKE to treat are low so it’s efficient; interns This analysis does not consider the ecosystem services benefits derived from replacement trees planted after the elms were removed ; only quantifies the lost benefits associated with various management strategies for Dutch Elm Disease
- Also used CTLA / compensatory approach: We used another approach using the CTLA System to validate it with another approach … 2 approaches, active management better than none and pay for it just through the values (far exceeded cost of mgmt)