Download to read offline

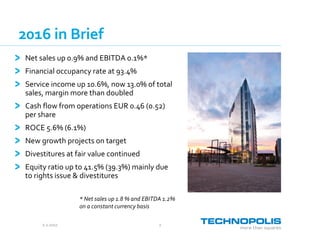
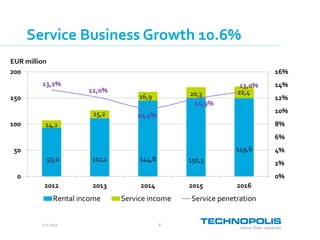
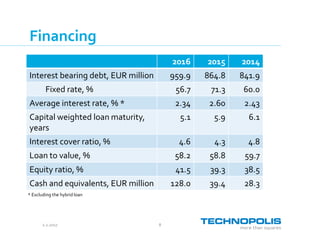

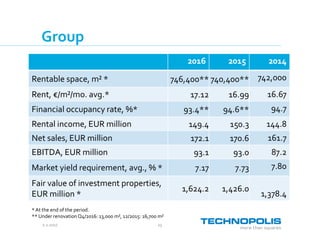

- Net sales for Technopolis increased 0.9% in 2016 while EBITDA increased 0.1% - Financial occupancy rate was 93.4% for the year - Service income grew 10.6% and now makes up 13.0% of total sales, more than doubling the margin - New growth projects are on target and divestitures continued to realize fair value - Equity ratio improved to 41.5% due to a rights issue and divestitures


