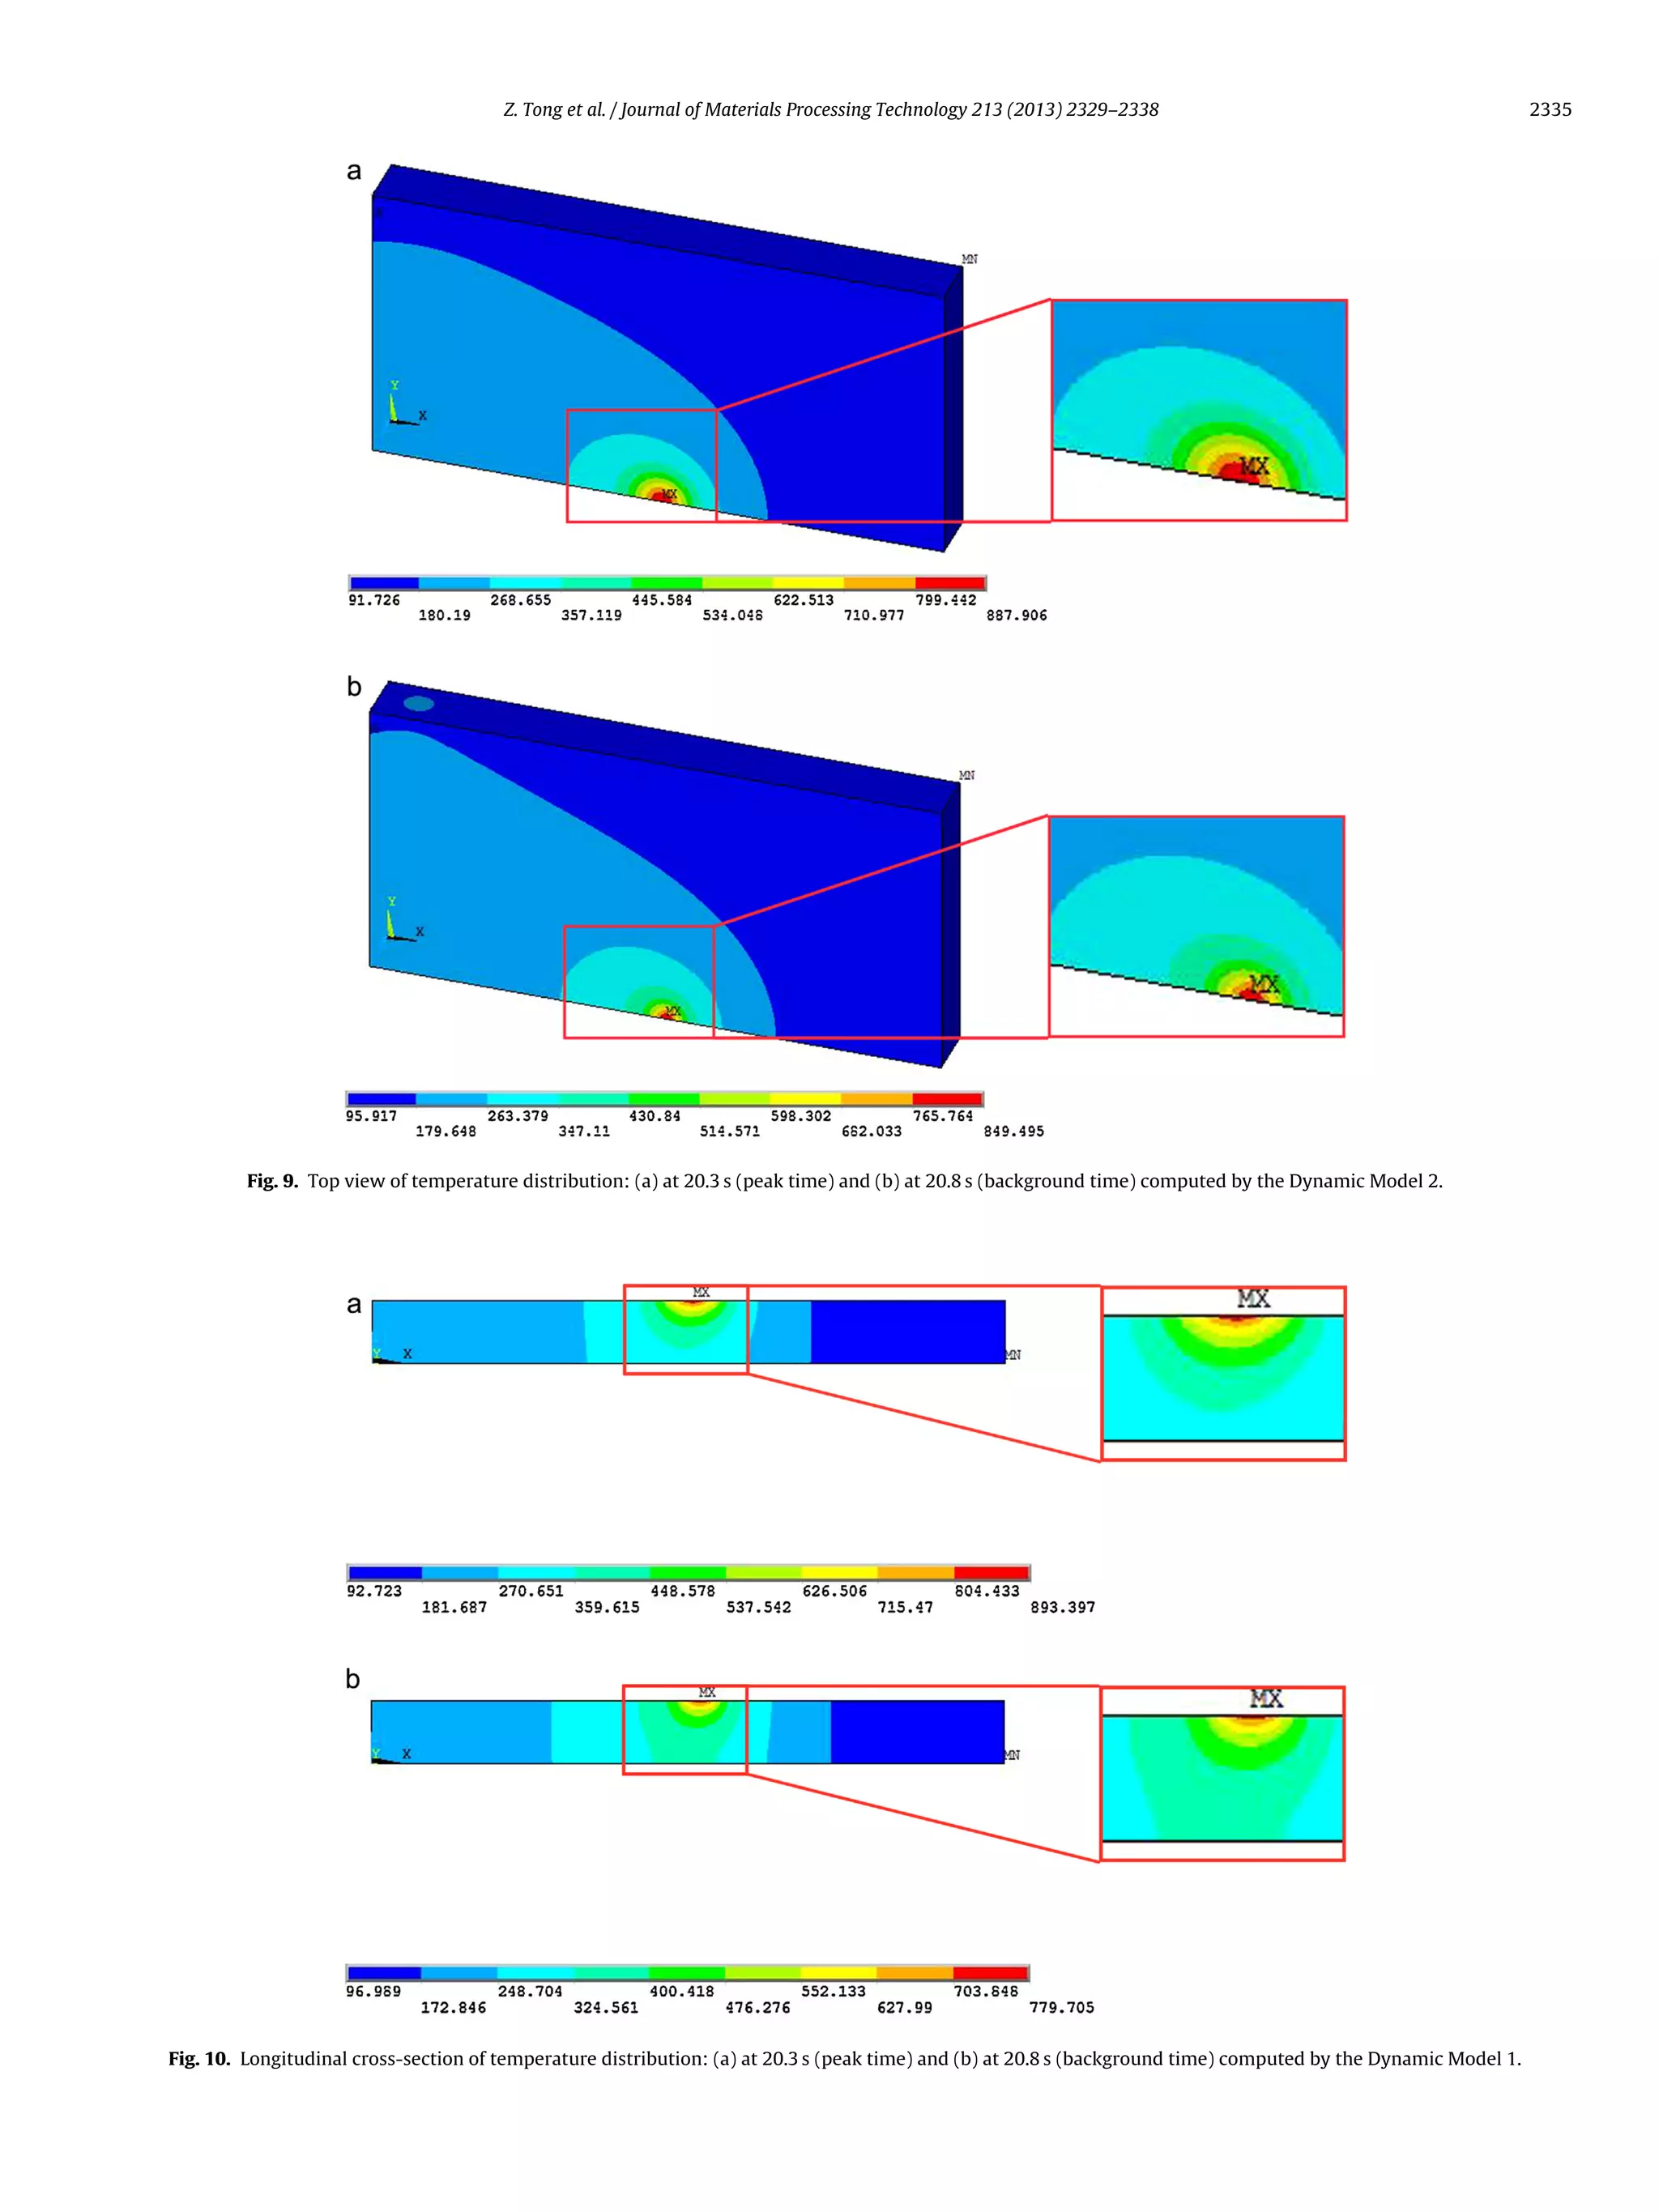
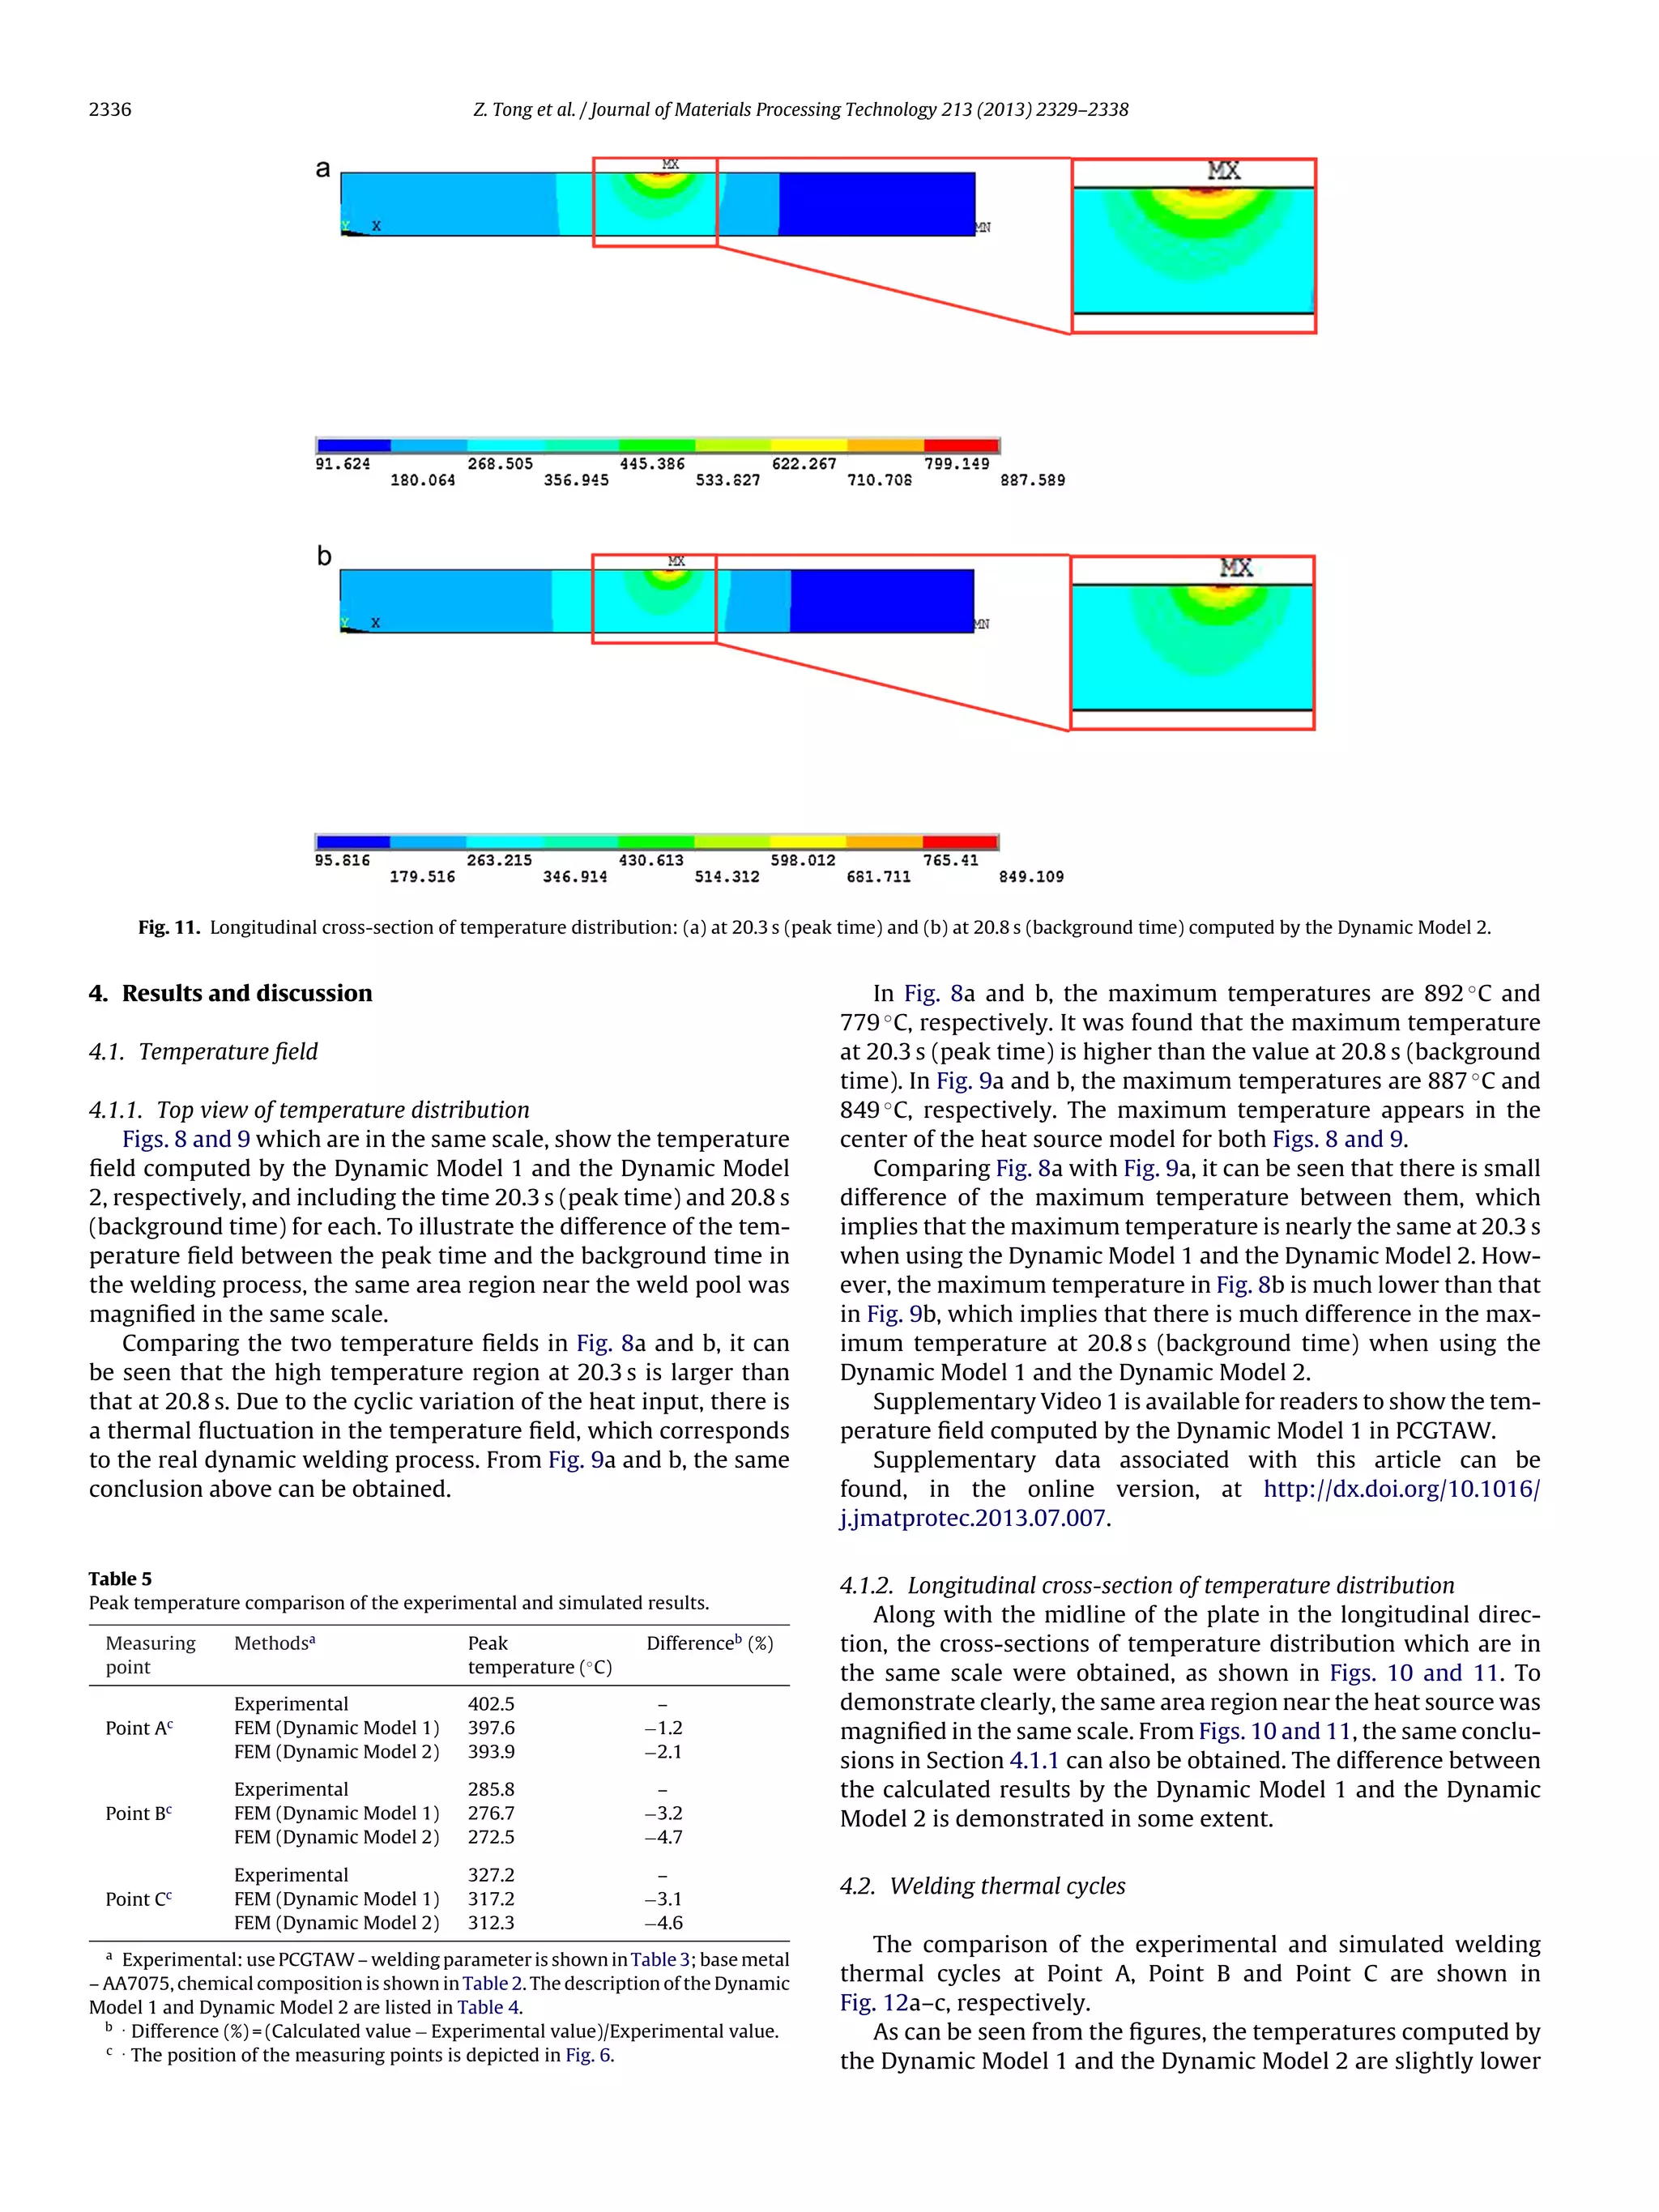
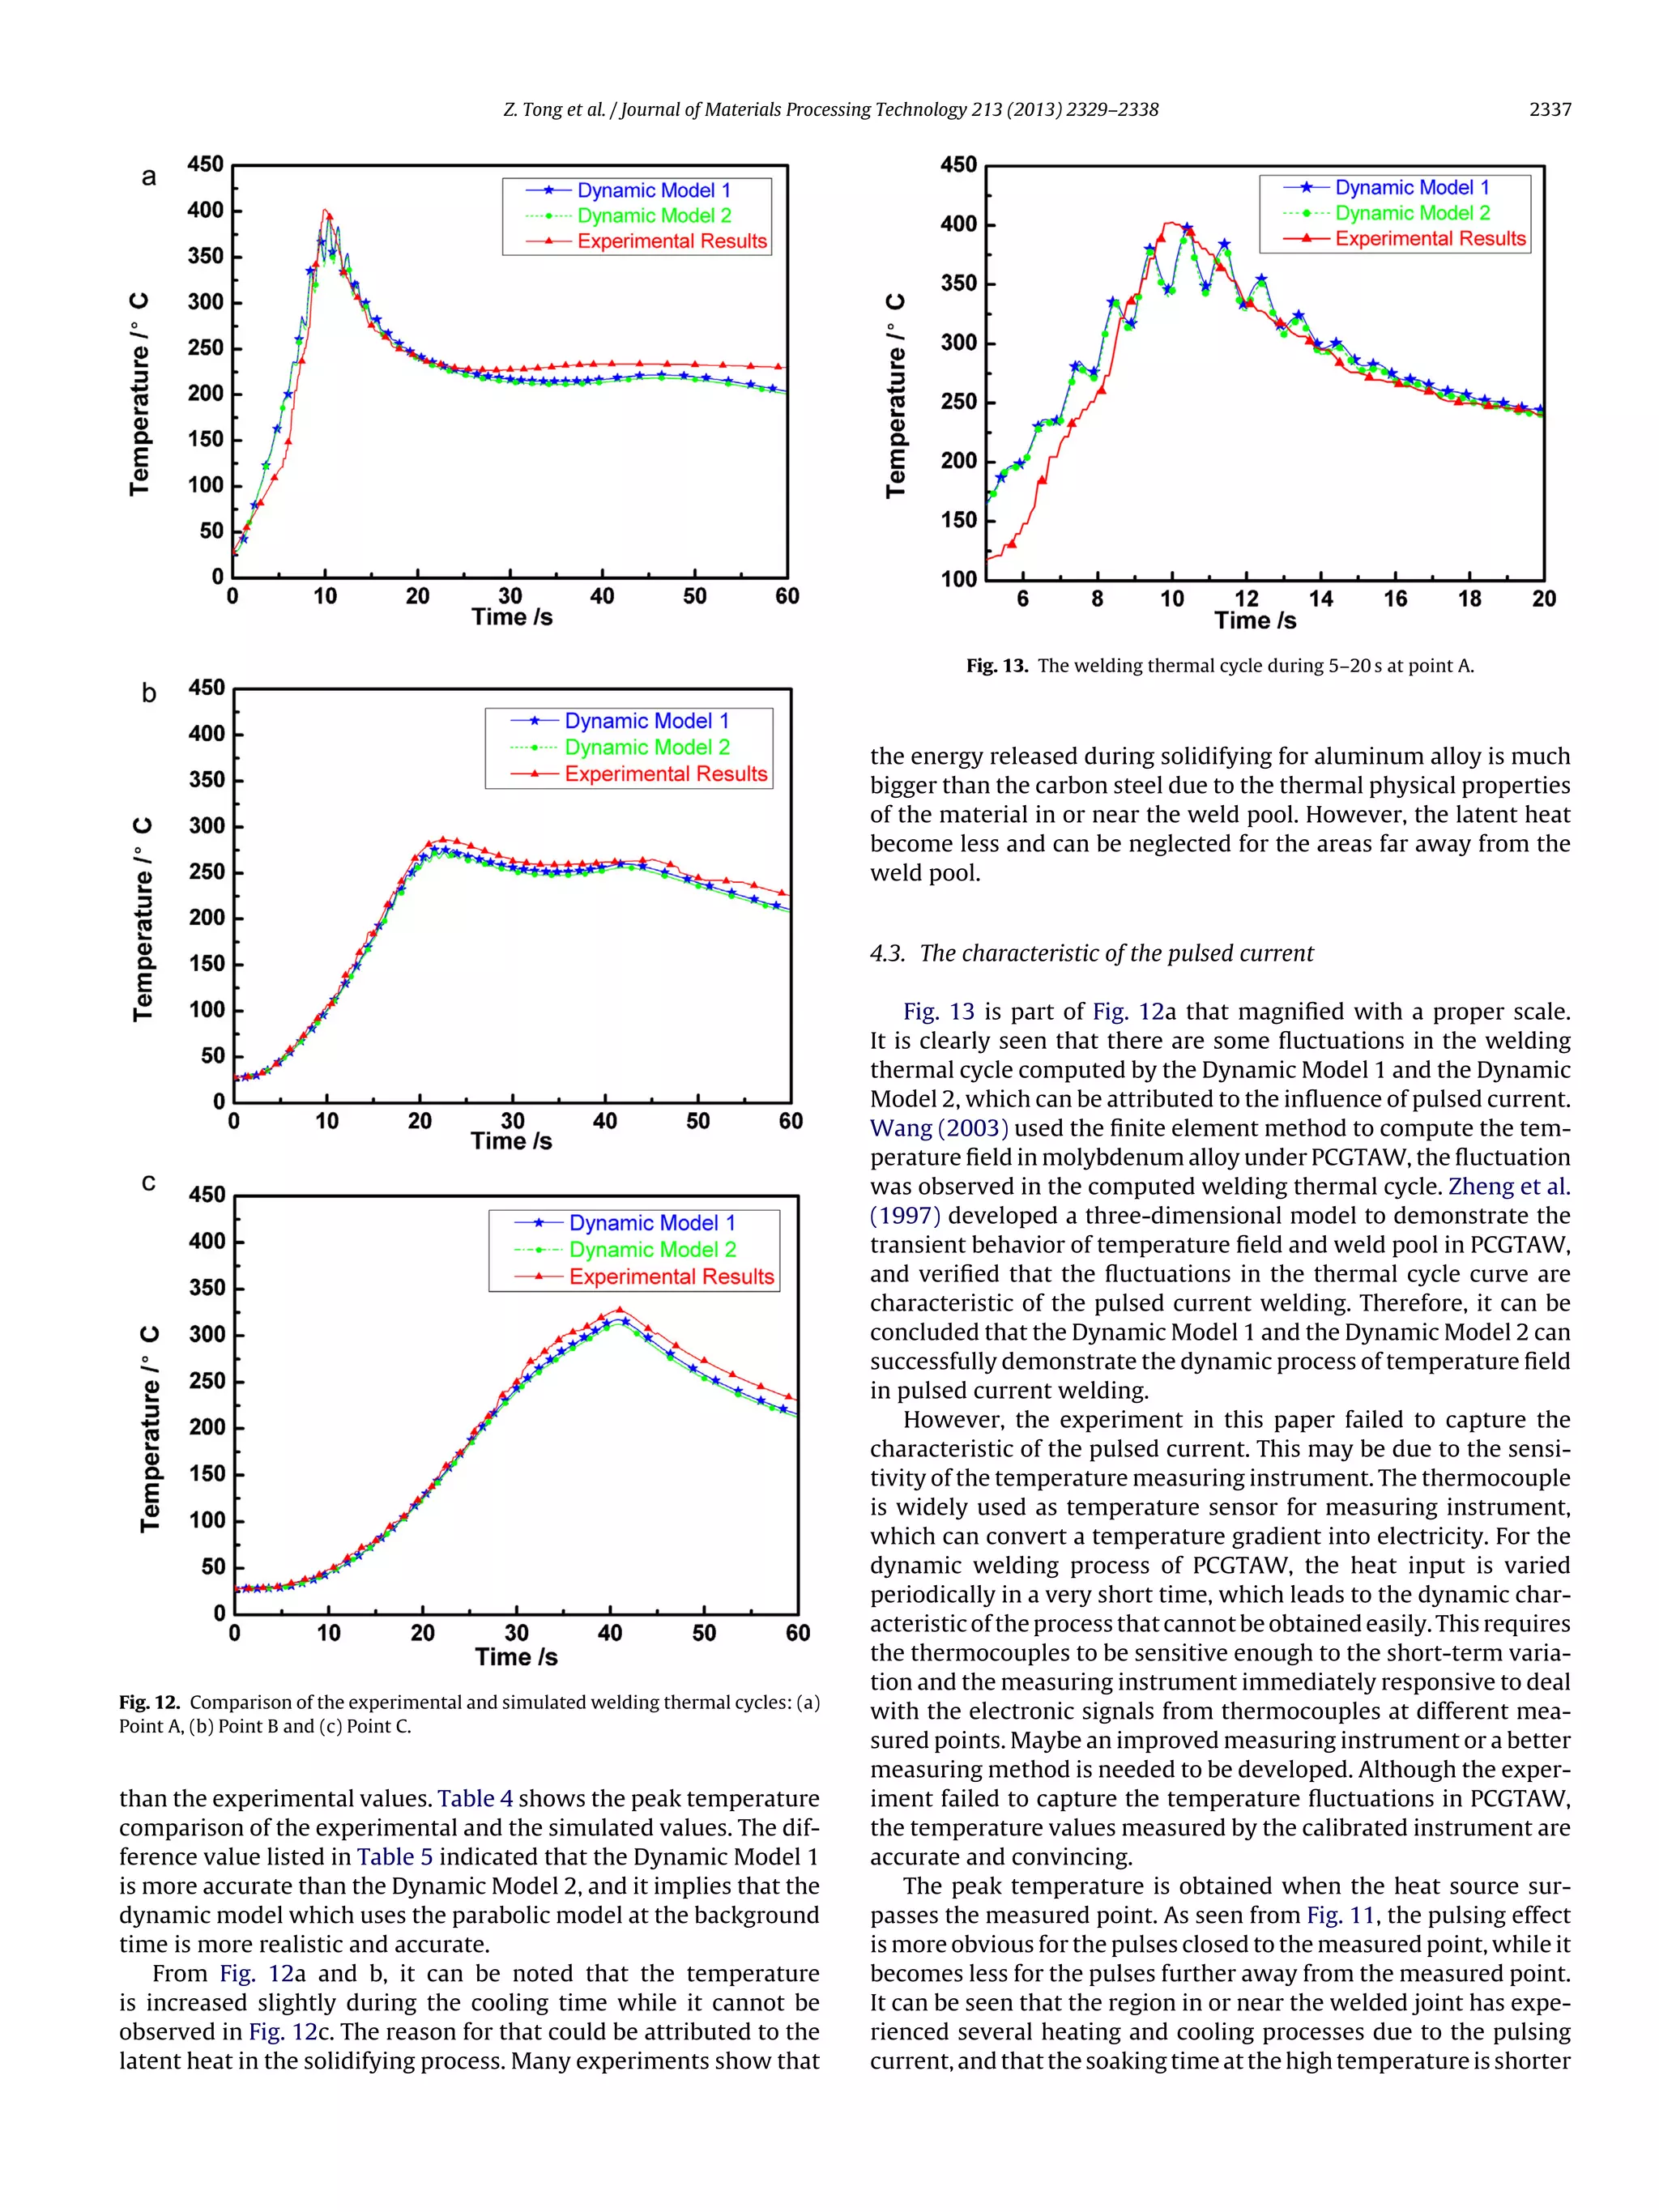
This document presents a dynamic welding heat source model for pulsed current gas tungsten arc welding (PCGTAW). The model uses two different heat source distributions over time - a Gaussian model during peak times due to the bell-shaped temperature contour, and a parabolic model during background times. An experiment was conducted to validate the model by comparing simulated and measured temperature values. The results show that the dynamic model using a parabolic distribution during background times is more realistic and accurate for PCGTAW under the given welding conditions.
![Z. Tong et al. / Journal of Materials Processing Technology 213 (2013) 2329–2338 2331
Fig. 2. Infra-red camera images at the background and peak times for both first and last periods.
Substituting q(0) = 43 W/mm2 and R ≈ 2.8 mm which is corre-
sponded with the third curve in Fig. 3a into Eq. (1):
q(x, ) = 43 1 −
x2
2.82
, − Rb ≤ x ≤ Rb (2)
The function image of Eq. (2) is shown in Fig. 3b, which approxi-
mates to the third curve in Fig. 3a that represents the radial heat flux
distribution at the background time, which can be clearly observed
in Fig. 3c which combined Fig. 3a with Fig. 3b in the same scale. So
it can be considered that the radial heat flux distribution at back-
ground time is approximate to parabolic shape, and the welding
heat source is a spinning parabolic shape distribution as shown in
Fig. 4.
The spinning parabolic shape model of welding heat source with
the center at (0, 0, 0) to coordinate axes x, y, can be written as:
q(x, y, ) = q(0) 1 −
x2 + y2
R2
b
(3)
where q(x, y, ) is the power density (W/m2).
For r = x2 + y2 which is the radial distance from the center of
the heat source, then Eq. (3) can be written as:
q(r) = q(0) 1 −
r2
R2
b
, r ≤ Rb (4)
Conservation of energy requires that:
Q = ÁUI = q(r)r dr d =
Rb
0
q(0) 1 −
r2
R2
b
r dr
2
0
d (5)
and produces the following:
Q = ÁUI = q(0)
R2
b
2
(6)
q(0) =
2ÁUI
R2
b
(7)
Substituting q(0) from Eq. (7) into Eq. (4) gives:
q(r) =
2ÁUI
R2
b
1 −
r2
R2
b
, r ≤ Rb (8)
So the dynamic welding heat source model of PCGTAW in one
pulse cycle can be written as:
q(r) =
3ÁpUIp
R2
p
exp −3
r2
R2
p
, t ∈ [0, tp] (at peak times)
or q(r) =
2ÁbUIb
R2
b
1−
r2
R2
b
, t ∈ (tp, tT ] and r ≤ Rb (at background times)
(9)
where q(r) is the power density (W/m2), Áp the heat source effi-
ciency at the peak time, Áb the heat source efficiency at the
background time, U the arc voltage (V), Ip the peak current (A), Ib
the background current (A), r = (x2 + y2)1/2 which is the radial dis-
tance from the center of the heat source (m), Rb the radius of the
heat source at the background time (m), Rp the radius of the heat
source at the peak time (m), tT = 1 pulse cycle time = 1/f (s), f the
pulse frequency, tp the peak time (s), tb the background time (s)
and tp + tb = tT.
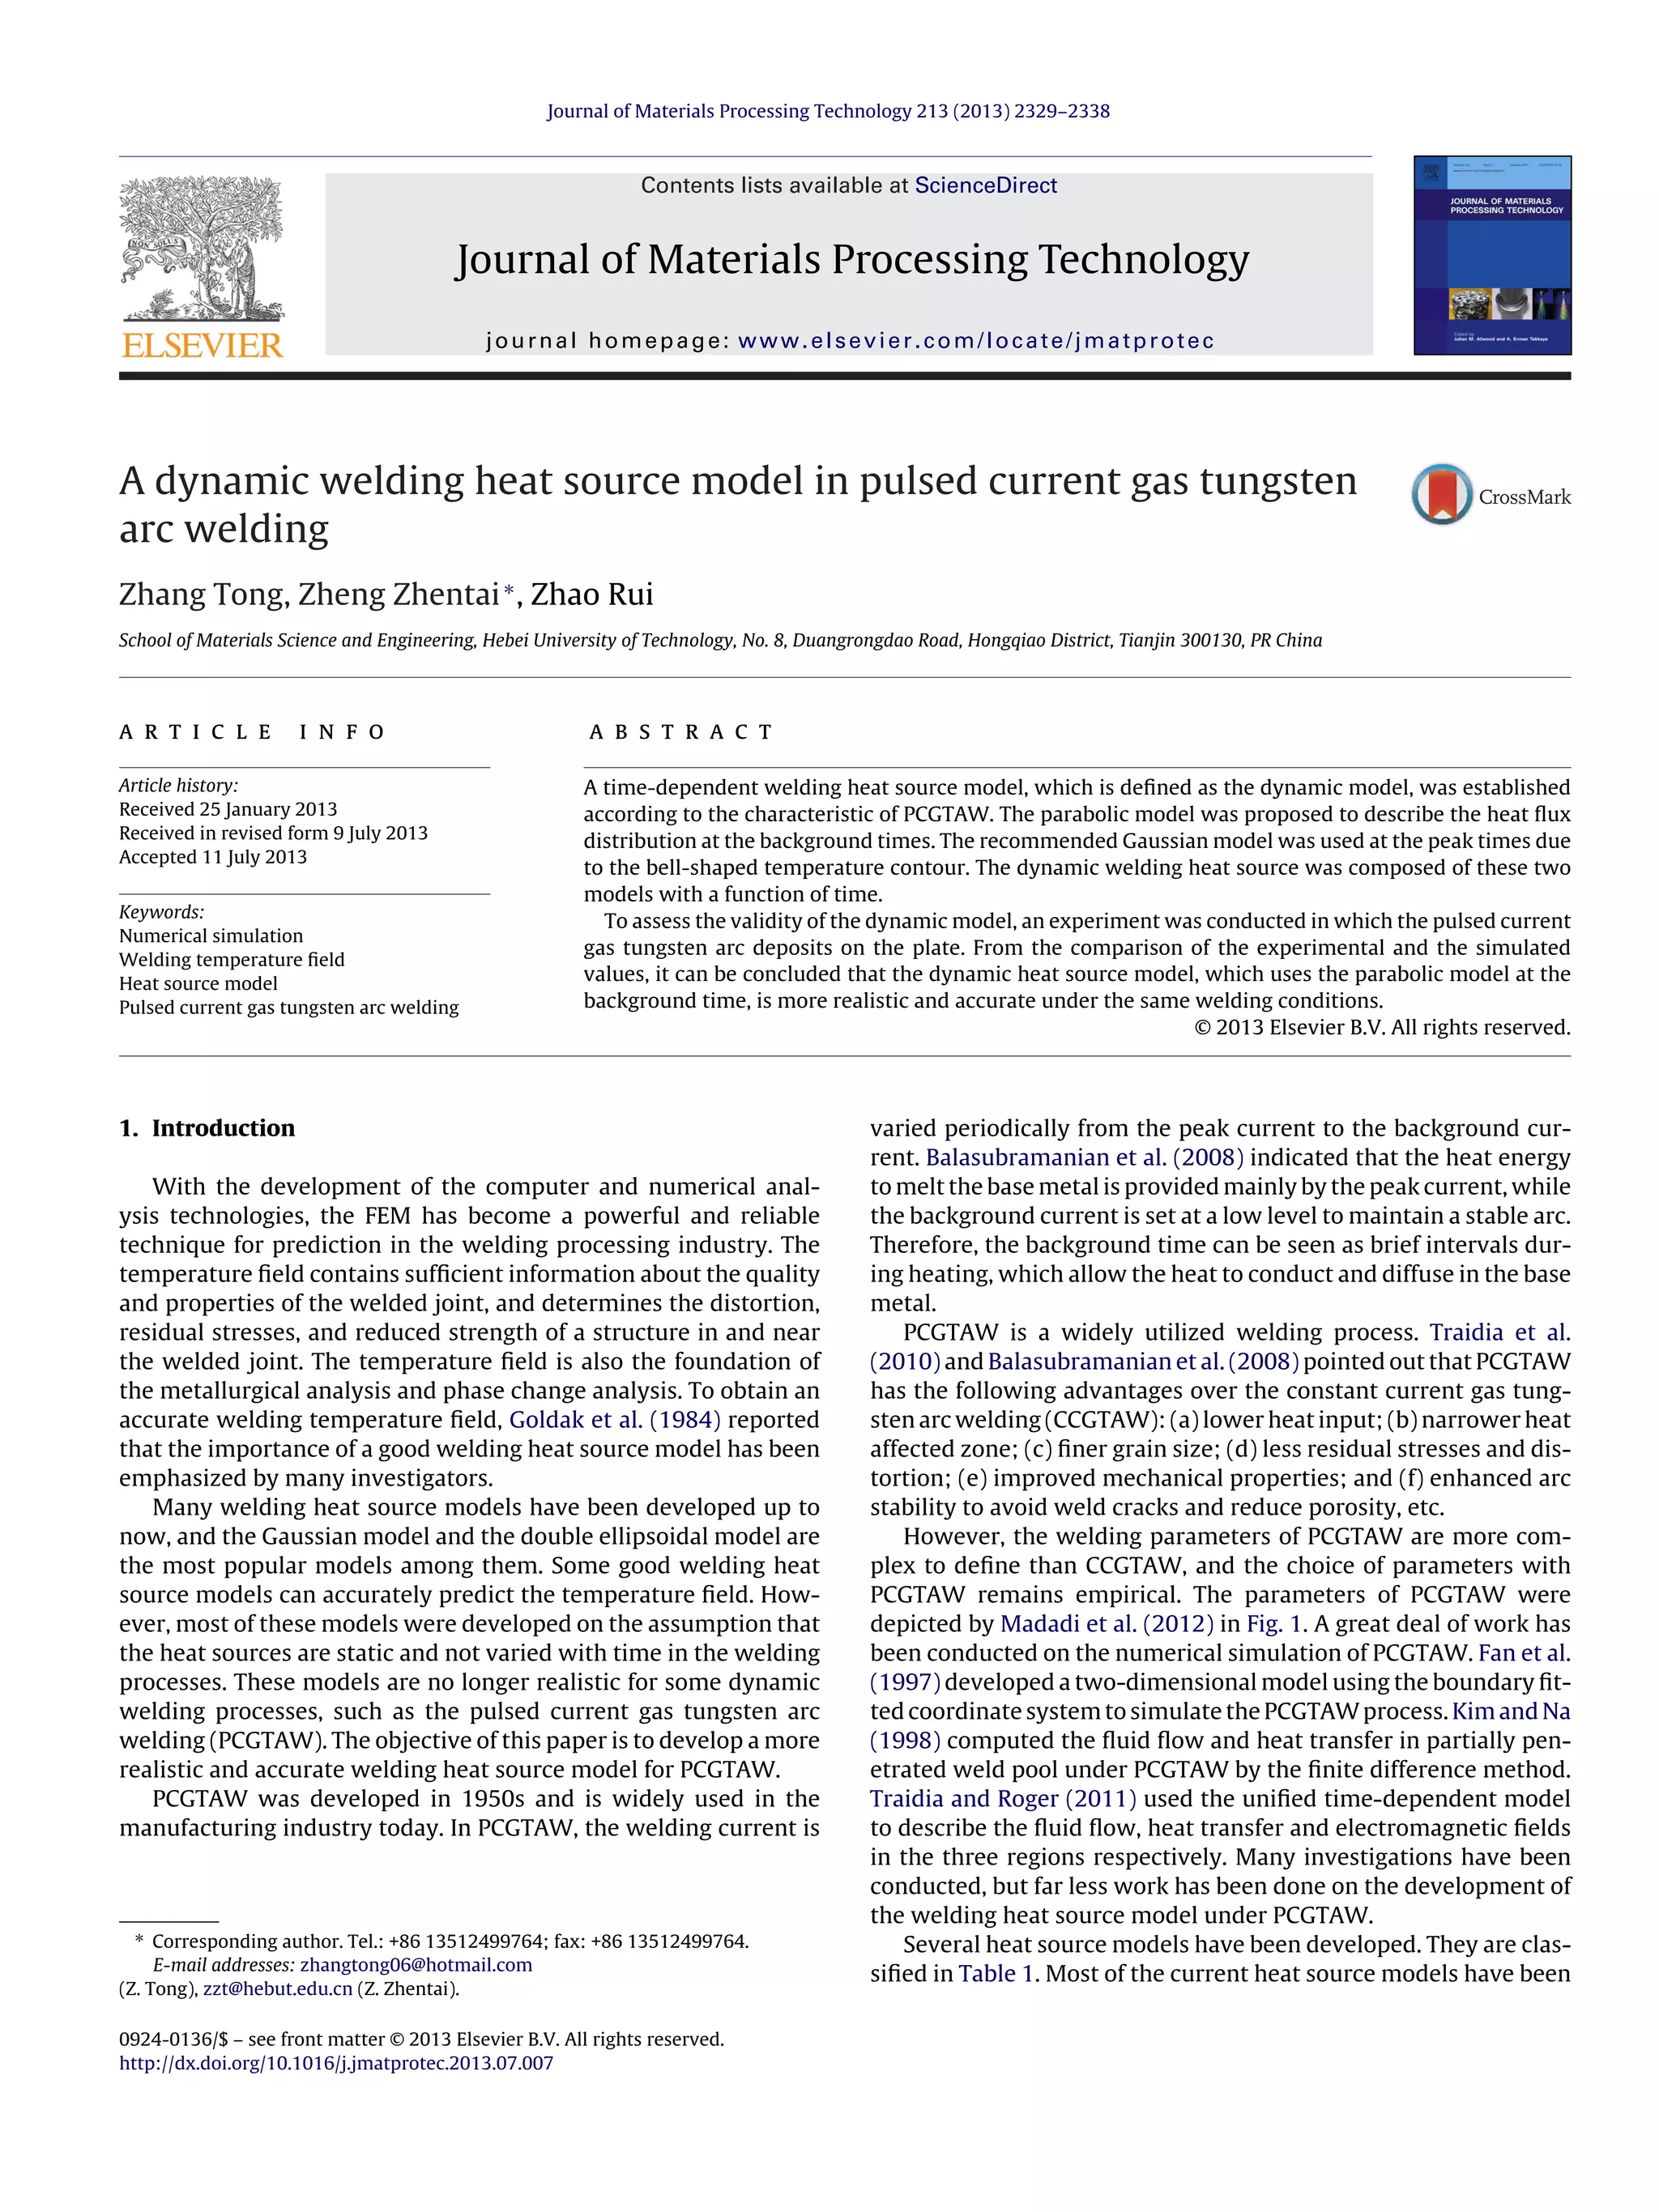
3. Evaluation of the dynamic model of welding heat source
in PCGTAW
One experiment was conducted in which the pulsed current
gas tungsten arc was deposited on the plate. The thermocouple
was used to measure the temperature field at the given points,
then the experimental values were compared with the simulated
values to assess the validity of the dynamic welding heat source
model.
Due to the lack of data on material properties, material mod-
eling has always been a critical issue in the welding simulation.](https://image.slidesharecdn.com/d0e30e27-037c-45c4-8546-511b3bebe233-170203032947/75/A-dynamic-welding-heat-source-model-in-pulsed-current-gas-tungsten-arc-welding-3-2048.jpg)
![Z. Tong et al. / Journal of Materials Processing Technology 213 (2013) 2329–2338 2333
Fig. 5. Thermal physical properties of AA7075: (a) specific heat and density and (b)
conductivity.
Fig. 6. Schematic diagram of welded plate used in the experiment.
Table 3
Welding parameter.
Process parameter Actual Simulated
Welding current
Peak current 180 A 180 A
Background current 60 A 60 A
Arc voltage 14 V 14 V
Welding speed 1.96–2.03 mm/s 2 mm/s
Pulse frequency 1 Hz 1 Hz
% Pulse on time 50% 50%
Electrode W–2%Th –
Electrode diameter 3.2 mm –
Arc length 2 mm –
Torch angle 60◦
–
Shielding gas Argon 99.9% –
Flow rate 15 L/min –
“coated” with Surf152 to represent the convective heat exchange.
The FEM model is shown in Fig. 7.
3.2.2. Welding heat source
In this research, the APDL programming languages of ANSYS
were applied to realize the moving load of the heat source. A
local coordinate system was established, and the center of the heat
source coincided with the original point of the local coordinate,
then the heat source moved gradually under the control of the loop
command in APDL.
To evaluate the validity of the dynamic heat source model, two
simulation tests were implemented under the same welding con-
ditions, which are described in Table 4. The parameters in the
dynamic welding heat source model are not easy to decide, so a
further study is needed.
3.2.3. Initial condition and boundary conditions
The ambient temperature is 28 ◦C. Considering the moving heat
source, heat losses due to convention and radiation are taken into
account in the finite element models. Heat loss due to convection
(qc) is taken into account using Newton’s law:
qc = hc(Ts − T0)
where hc is the heat transfer coefficient, Ts the surface temperature
of the weldment and T0 is the ambient temperature which is 28 ◦C.
Heat loss due to radiation is modeled using Stefan–Boltzmann’s
law:
qr = −ε · [(Ts + 273)4
− (T0 + 273)4
]
where ε is emissivity which is 0.6 and = 5.67 × 10⁻⁸ W/m2 ◦C−4 is
defined as the Stefan–Boltzmann constant.
3.2.4. Latent heat of phase transition
During the welding process, melting and solidifying will occur
in the welding pool, it will absorb or release latent heat in the
phase transition, which is defined as “latent heat of phase tran-
sition”. Lei et al. (2006) use the enthalpy method to deal with the
Fig. 7. FEM model.](https://image.slidesharecdn.com/d0e30e27-037c-45c4-8546-511b3bebe233-170203032947/75/A-dynamic-welding-heat-source-model-in-pulsed-current-gas-tungsten-arc-welding-5-2048.jpg)


![Finite Element Simulation of Plasma Transferred ARC Welding [PTAW] of Structu...](https://cdn.slidesharecdn.com/ss_thumbnails/b410040611-141115042900-conversion-gate02-thumbnail.jpg?width=640&height=640&fit=bounds)


![[IJET V2I5P19] Authors: D. Venkata Krishna, E. Mahesh, G. Kiran, G. Sai Suche...](https://cdn.slidesharecdn.com/ss_thumbnails/ijet-v2i5p19-161107144424-thumbnail.jpg?width=640&height=640&fit=bounds)


