Downloaded 255 times

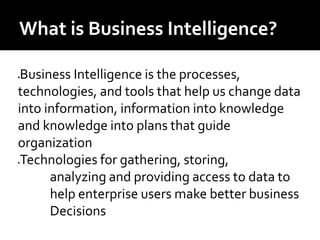

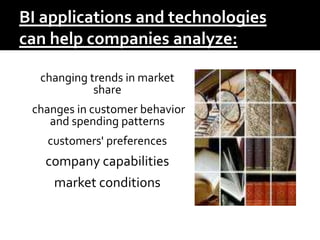


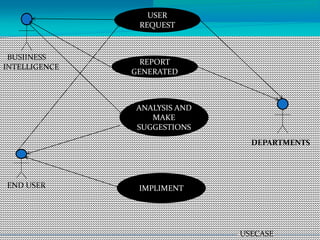
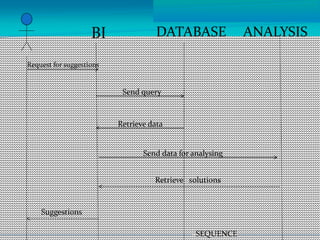


Business intelligence (BI) is the processes, technologies, and tools used to gather data from across an organization, analyze it, and provide insights that help make better business decisions. BI technologies help answer questions about past performance, current trends, and future predictions. Key BI applications and technologies can analyze changing market trends, customer behavior patterns, and other factors to help companies adapt quickly to changing customer demands. Common BI modules include dashboards, key performance indicators, graphical reporting, forecasting, and data visualization tools that provide timely insights to inform strategic planning and decision-making.


![[DSC Europe 25] Ivica Milaric - The Future of Gaming and AI Tools.pptx](https://cdn.slidesharecdn.com/ss_thumbnails/tijgzsmgse2kj2y5pzzp-5-ivica-milaric-the-future-of-gaming-x-ai-tools-260114111931-87c2b3ac-thumbnail.jpg?width=640&height=640&fit=bounds)
![[DSC Europe 25] Slobodan Dolinic - Smart and Intelligent Green Region.pptx](https://cdn.slidesharecdn.com/ss_thumbnails/0bribinjsp6ghwtvsvor-2-sigre-slobodan-dolinic-260115093812-c9c10e90-thumbnail.jpg?width=640&height=640&fit=bounds)


![[DSC Europe 25] Elena Menshikova - AI-Powered Operational Excellence: Revolut...](https://cdn.slidesharecdn.com/ss_thumbnails/es6nholbqy3zaao2c2yd-2-elena-menshikova-data-ai-in-decision-making-260115093812-4fba8b38-thumbnail.jpg?width=640&height=640&fit=bounds)


![[DSC Europe 25] Srba Markovic - From Pilot to Production: Overcoming AI Deplo...](https://cdn.slidesharecdn.com/ss_thumbnails/yjjmrtytmwbalxlba7px-4-srba-markovic-from-pilot-to-production-overcoming-ai-deployment-blockers-with-260114111931-4a892d44-thumbnail.jpg?width=640&height=640&fit=bounds)