The document describes methods for constructing block diagrams and fold cross-sections from geological field data. It discusses the Busk method, which uses concentric cylinders to reconstruct folds by varying curvature between dip measurements. However, this assumes constant layer thickness and parallel folding, which is unrealistic. The kink method is now more common, approximating folds as zones of constant dip between measurements. Cross-sections must be modified by hand to match both dip data and observed stratigraphy at the surface, rather than relying purely on geometric constructions below ground.
Numerical Study of Star Anchor Plate Embedded in Cohesive SoilIJERA Editor
Indonesia as an archipelago country has a very long coastline about 90.000 kms. Specifically for shore and offshore, there are many buildings utilizing structures including floating deck, mooring dolphin, offshore platforms etc. Those requires a solution to maintain the stability of the structures due to the vertical movement of tides and horizontal movement of currents, wind and waves. To maintain the stability due to buoyant force, structure of anchors are needed. Various types of the anchor have been widely used such as drag, helical, anchor plate circular shape and square. This study aims to do the development of new modifications of a plate anchor type star with 4 leaves with an area of a fixed and diameter equivalent different on any variations. Ultimate pullout capacity was obtained by using numerical geomechanics analysis within finite difference method. A perfectly plastic soil model was used with a tresca yield criterion. Results are presented including break-out factors based on various anchor shapes and embedment depth. Our findings are also compared with previous numerical and empirical solutions.
Effect of foundation flexibility on dynamic behaviour of asymmetric building ...eSAT Journals
Abstract In general the seismic design of building frame structures the designers will consider only the results of fixed base condition the effect of flexibility is ignored. In post-earthquake study the framed structure reveals that the interaction of soil and foundation plays an important role in damage of the building frame structures. In this regard a literature survey has been done on frame structures supported on various foundations such as isolated, combined, raft & pile foundations. To examine the literature revels the few investigations were done on asymmetric building frame structure is supported on isolated footing. So in this paper is an attempt to the study of dynamic behavior of asymmetric building frame structure is supported on isolated footings. The modeling and analysis is done by using “finite element method software” SAP2000 VERSION 14, by considering the different soil conditions, (soft, medium, hard) different soil parameters (passion’s ratio, young’s modulus, dynamic shear modulus) different height ratio’s, different span ratio’s & fixed base conditions. The response of the building frame structure is obtained in terms of fundamental natural period, lateral displacement and seismic base shear. Keywords: Soil structure interaction, Fundamental natural period, Base shear, Lateral displacement….
Extra ways to see: An Artist's Guide to Map Operationsjmallos
Map operations convert one subdivision of a surface into another, thereby suggesting alternate ways to decorate or build the surface. Over twenty map operations are described in a visual way by their truchet tiles. Paper presented at the 2011 ISAMA Chicago conference.
it is about dimensional, subtractive, additive, centralised, radial, clustered, grid forms.
it is about the design procedure and how can we make an innovative design follow ing a few simple transformation steps.
SOIL STRUCTURE INTERACTION STUDY ON PLANE BUILDING FRAME SUPPORTED ON PILE GR...IAEME Publication
Background/Objectives: The main objective of this work is to determine the soil interaction of a plane building frame underpinned by pile groups which are embedded in cohesive soil (clayey soil).Methods: The impact of Soil-Structure Interaction on response of a 4 storey framed Building underpinned by Pile group is reported in this paper. The four storey frame consists of three bays and columns of the frame supported by a pile group. The Pile group is presumed to be embedded in the Cohesive soil mass (clayey soil). The soil mass is represented by equivalent springs. The displacement of the building frame caused due to the deflection of the foundation with and without Soil Structure Interaction is analyzed using ANSYS. Findings: Soil non-linearity in lateral direction is indicated by the P-Y curve developed using Matlock equations. The soil properties which are used for clay (cohesive soil) are from the Triaxial Consolidated Undrained Compression Test on soil. Shear Force and Bending Moments at the base of the columns are determined for the frame which is analyzed with and without consideration of soil structure interaction.
Soil structure interaction effect on dynamic behavior of 3 d building frames ...eSAT Journals
Abstract The soil flexibility effect is generally not considered in seismic design of building frames and the design is done based on results of dynamic analysis taking fixed base condition. Flexibility effect of soil causes lengthening of lateral natural period due to overall reduction in lateral stiffness of the structure. Such lengthening lateral natural period (T) may considerably vary the seismic response of building frames resting on raft foundation. Hence it is necessary to unite the flexibility of soil on which the foundation rests during analysis such study being termed as soil structure interaction (SSI). In the present study the dynamic behavior of building frames over raft footing under seismic forces uniting soil structure interaction is considered. The analysis is carried out using FEM software SAP2000 *Ver14. For the interaction analysis of space frame, foundation and soil are considered as parts of a single compatible unit and soil is idealized using the soil models for analysis. The soil system below a raft footing is replaced by providing a true soil model (continuum model). In continuum model, soil is considered as homogeneous, isotropic, elastic of half space for which dynamic shear modulus and Poisson’s ratio are the inputs. Influence of number of parameters such as number of storey’s, soil types and height ratio for seismic zone-V is considered in present study. Building responses are considered for bare frame with and without accounting for soil flexibility. The responses in terms of lateral natural period and seismic base shear, lateral displacement (story drift), with and without soil flexibility is compared to evaluate the contribution of soil flexibility on building frames. Keywords: soil structure interaction, natural period, base shear, max. lateral displacement and raft footing etc…
Seismic Response Analysis of Structure A Perspective Viewijtsrd
"From past earthquakes it is proved that many of structure are totally or partially damaged due to earthquake. So, it is necessary to determine seismic responses of such buildings. There are different techniques of seismic analysis of structure. Time history analysis is one of the important techniques for structural seismic analysis generally the evaluated structural response is nonlinear in nature. For such type of analysis, a representative earthquake time history is required. In this project work seismic analysis of RCC buildings with mass irregularity at different floor level are carried out. Here for analysis different time histories have been used. This paper highlights the effect of mass irregularity on different floor in RCC buildings with time history and analysis is done by using ETABS software. Khileshwari Verma | Prof. Pratiksha Malviya ""Seismic Response Analysis of Structure: A Perspective View"" Published in International Journal of Trend in Scientific Research and Development (ijtsrd), ISSN: 2456-6470, Volume-3 | Issue-3 , April 2019, URL: https://www.ijtsrd.com/papers/ijtsrd22919.pdf
Paper URL: https://www.ijtsrd.com/engineering/civil-engineering/22919/seismic-response-analysis-of-structure-a-perspective-view/khileshwari-verma"
Finite element analysis of frame with soil structure interactioneSAT Journals
Abstract
For the analysis of a building frame, the columns at the foundation level are considered as fixed. But in real condition it is not the case. While considering soil in the analysis of building frame 100% fixity may not be ensured. Because of the settlement and rotation of foundation, shear force and bending moment in superstructure get altered. This effect is called as “Soil Structure Interaction” Present work is to study behavior of bare frame & in-filled frame having soil beneath. In these cases three types of soils are considered, soft, medium stiff and hard. Also in-filled panel is of brick masonry only. Various cases frames are studied. The following are the cases:
1] Analysis of bare frame with soil.2] Analysis of In-filled frame with Soil.3] Analysis of Bare frame without Soil.4] Analysis of In-filled frame without Soil Frame with different combinations mentioned above (with/without infill panel, with/without soil) is analyzed by using ANSYS 14.5. These results are comprised with SSI and without SSI.
Keywords: Soil Structure Interaction, In-Filled Frame, Bare Frame.
A graphic representation of the intersection of the geological bodies in the subsurface with a vertical plane of a certain orientation. It is a section of the terrain where the different types of rocks, their location, age, and composition, and the geometric relationship between them are represented. Which are made on the basis of geologic maps and data from geologic observations, mine works, boreholes, geophysical investigations, and so on.
Preparation of Geologic Sections:
1. Decide what the geologic cross section is going to be used for, and use this to guide you in selecting the appropriate scales.
2. Choose appropriate vertical and horizontal scales.
3. On the map, locate the well or borehole positions, land service elevations, depth of the well and the number of geologic units in each well bore.
4. Transfer the geologic information from each will long to the cross-section. This information represents discrete points of knowledge about the subsurface geology. Part of the geologist skills is interpretation from these discrete points of knowledge to those areas that lie in between. Part of this exercise is determining what units can be lumped together versus those which should be spit apart. Again, this mostly related to the data that is trying to be displayed.
5. Correlate the geologic information between boreholes. Applying knowledge of the specific deposition features of the rock or sediments can be used to increase the accuracy of the model. Look for differences in lithology, texture, or sediment or rock properties as a guide to defining contacts between contiguous geologic units. Use solid lines to indicate reasonably certain relations between discrete data points. Dashed lines are used to indicate uncertainty or inferred data. Areas where does not exist are typically labeled with question marks.
6. Incorporate Legend, Orientation, Title, and Scales to the cross-section. Ensure the units and use the same colour and pattern scheme as on the original geologic map.
Legend – the legend is a key to the patterns used to identify each unit on the cross-section. The units are ordered from oldest formation at the bottom of the legend to youngest unit at the top of the legend.
Orientation – the orientation of the cross-section is the direction that the cross-section line makes on Earth . You can indicate the orientation by writing the corresponding direction at each end of the cross-section (e.g., west and east).
Title – a descriptive title for the cross-section. You can include the letters used to identify the line on the original geological map in the title.
Scale – include a ratio scale and/or a bar scale to show the scale of the cross-section. The vertical and horizontal scales should be the same, so you only need to include one scale on the cross-section.
Strike and Dip Method
To measure and describe the geometry of geological layers, geologists apply the concepts of strike and dip.
•Strike refers to the line formed by the inte
ABAQUS simulation for consolidation of saturated soft soil in two-dimensional...IJRES Journal
For consolidation problem of saturated soft soil in two-dimensional finite region, choosing three different kind of boundary conditions, using finite element software ABAQUS simulated and searched the characteristics and laws of soil settlement under the shear or normal load on the surface. The results show that: both shear load or normal load that the final settlement has no connection with the boundary permeability, but with the load and the soil nature itself. Different boundary conditions that corresponding to the process of settlement are variable. Compared with the shear load, the normal load effect on the vertical displacement is larger and they have orders of magnitude difference. Same for horizontal displacement, the shear load effect on the horizontal displacement is larger and they have orders of magnitude difference.
Page | 304
Introductory GeoloGy crustal deformatIon
12.8 lab exerCIse
student responses Name___________________________
This Lab Assignment must be mailed to your Instructor. There is no online
assessment for the Crustal Deformation Lab.
Complete the entire assignment and mail to your instructor postmarked by the
assessment deadline. You should make an extra copy to practice on and mail in a
clean and neat version for grading. Make sure to include your name and staple all
of the pages together. It is a good idea to make a copy of what you mail in, just in
case it gets lost in the mail. For several parts of this lab there are multiple
interpretations! Ask if you have questions.
Part A (6 pts) Circle the correct answer to the following questions.
1. For the following diagram, determine the correct map symbol that would go in
the oval box.
a. b. c. d.
2. For the following diagram, determine the correct map symbol that would go in
the oval box.
a. b. c. d.
Page | 305
Introductory GeoloGy crustal deformatIon
3. Using Google Earth, search for the following area in Pakistan: 27 50 35.00N
67 10 03.70E. Zoom out to an eye altitude of approximately 25,000 feet. The
inclined layers in these folded rocks can be easily seen. As you view them, in
which compass direction are the beds dipping?
a. Northeast (NE) b. Southeast (SE) c. Northwest (NW) d. Southwest (SW)
Part B (24 pts)
For each of the following block diagrams complete the following: 1- Complete
the diagram drawing in geological contacts on each side of the block; 2- Add sym-
bols indicating the strike and dip of each geological layer as well as symbols docu-
menting any other geological features (include the direction of movement for any
faults); 3- In the space provided under the block diagram write the specific name
of the geology feature in the block diagram. Please note that in several of the blocks
the ages of the layers are provided.
Page | 306
Introductory GeoloGy crustal deformatIon
Part C (20 pts)
At the end of the lab there are two full-page block diagrams. Cut along the
dashed lines and fold along the solid lines to examine the block in three dimen-
sions. For each of the block diagrams complete the following: 1- Complete the dia-
gram drawing in geological contacts on each side of the block; 2- Add symbols in-
dicating the strike and dip of each geological layer as well as symbols documenting
any other geological features; 3- Identify the geologic structure presented on the
block and write the name of the structure on the top surface of the block. Please
unfold the blocks flat to mail in to your instructor.
Part D (24 pts)
The geological map on the following page is from the Paleozoic rocks in the
Northwest Georgia Mountains. Please refer to the key to rocks and their ages pres-
ent on the map in order to answer the questions. Note that the rock key is in
chronological order with the oldest rocks on the bottom (Conas.
International Journal of Engineering and Science Invention (IJESI) is an international journal intended for professionals and researchers in all fields of computer science and electronics. IJESI publishes research articles and reviews within the whole field Engineering Science and Technology, new teaching methods, assessment, validation and the impact of new technologies and it will continue to provide information on the latest trends and developments in this ever-expanding subject. The publications of papers are selected through double peer reviewed to ensure originality, relevance, and readability. The articles published in our journal can be accessed online.
Structural measurements in oriented core photograph january 2019_galkineVadim Galkine
n this post I describe the method of structural measurements of planar structures using oriented core digital photographs. The main advantage of the method is an opportunity to reduce field-based time of the drill-core processing. All the measurements can be done in the office.
Users can work either in the standard GIS platforms (ArcMap, MapInfo etc) or even use digitizers outside of GIS environment which makes the technique comparatively cheap.
The method consists of two steps:
1) digitazing photographs and obtaining a table of xy coordinates of the three-point sets of planar structures
2) calculating actual structure orientations using the MSExcel calculation spreadsheets.
The spreadsheets are provided as attachments to the post. They can also be downloaded from http://remoteexploration.com/oriented-core-techniques.html
Similar to A block diagram is a sketch of a relief model (20)
geological field report of upper dir kpk salman khan
it has made by me hope u would like it. . . i m the student of 2nd semester department of geology .shaheed benazir bhutto university sheringal dir upper . . .i would get happy on ur suggestions . .
Francesca Gottschalk - How can education support child empowerment.pptxEduSkills OECD
Francesca Gottschalk from the OECD’s Centre for Educational Research and Innovation presents at the Ask an Expert Webinar: How can education support child empowerment?
Acetabularia Information For Class 9 .docxvaibhavrinwa19
Acetabularia acetabulum is a single-celled green alga that in its vegetative state is morphologically differentiated into a basal rhizoid and an axially elongated stalk, which bears whorls of branching hairs. The single diploid nucleus resides in the rhizoid.
Unit 8 - Information and Communication Technology (Paper I).pdfThiyagu K
This slides describes the basic concepts of ICT, basics of Email, Emerging Technology and Digital Initiatives in Education. This presentations aligns with the UGC Paper I syllabus.
Macroeconomics- Movie Location
This will be used as part of your Personal Professional Portfolio once graded.
Objective:
Prepare a presentation or a paper using research, basic comparative analysis, data organization and application of economic information. You will make an informed assessment of an economic climate outside of the United States to accomplish an entertainment industry objective.
Digital Tools and AI for Teaching Learning and Research
A block diagram is a sketch of a relief model
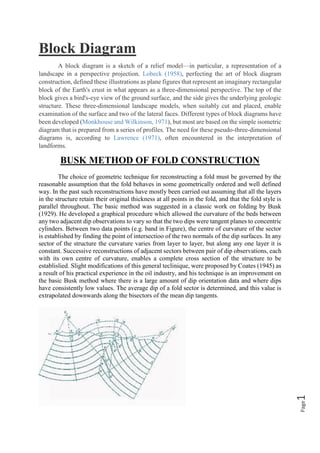
1. Page1
Block Diagram
A block diagram is a sketch of a relief model—in particular, a representation of a
landscape in a perspective projection. Lobeck (1958), perfecting the art of block diagram
construction, defined these illustrations as plane figures that represent an imaginary rectangular
block of the Earth's crust in what appears as a three-dimensional perspective. The top of the
block gives a bird's-eye view of the ground surface, and the side gives the underlying geologic
structure. These three-dimensional landscape models, when suitably cut and placed, enable
examination of the surface and two of the lateral faces. Different types of block diagrams have
been developed (Monkhouse and Wilkinson, 1971), but most are based on the simple isometric
diagram that is prepared from a series of profiles. The need for these pseudo-three-dimensional
diagrams is, according to Lawrence (1971), often encountered in the interpretation of
landforms.
BUSK METHOD OF FOLD CONSTRUCTION
The choice of geometric technique for reconstructing a fold must be governed by the
reasonable assumption that the fold behaves in some geometrically ordered and well defined
way. In the past such reconstructions have mostly been carried out assuming that all the layers
in the structure retain their original thickness at all points in the fold, and that the fold style is
parallel throughout. The basic method was suggested in a classic work on folding by Busk
(1929). He developed a graphical procedure which allowed the curvature of the beds between
any two adjacent dip observations to vary so that the two dips were tangent planes to concentric
cylinders. Between two data points (e.g. band in Figure), the centre of curvature of the sector
is established by finding the point of intersectioo of the two normals of the dip surfaces. In any
sector of the structure the curvature varies from layer to layer, but along any one layer it is
constant. Successive reconstructions of adjacent sectors between pair of dip observations, each
with its own centre of curvature, enables a complete cross section of the structure to be
establislied. Slight modifications of this general teclinique, were proposed by Coates (1945) as
a result of his practical experience in the oil industry, and his technique is an improvement on
the basic Busk method where there is a large amount of dip orientation data and where dips
have consistently low values. The average dip of a fold sector is determined, and this value is
extrapolated downwards along the bisectors of the mean dip tangents.
2. Page2
Constructions produced by the Busk method show a number of special geometric properties.
1. All layers in the fold retain constant orthogonal thickness irrespective of lithology.
2. Sudden clings of curvature occur in any surface in the fold where it cuts a line perpendicular
to an observed dip. In some positions in the structure these curvature changes are very marked
and give rise to cusp-like forms. Construction cusps of this type occur at different layer levels
in the structure. On the inner arc of the cusps the arc lengths measured along any folded surface
are smaller than those on the outside of the cusp.
3. The amplitude on the folds in successive layers always decreases away from the topographic
surface where the prime data were collected.
4. At some positions in the structure geometrical incompatibility occurs and, over certain
sectors, it is not always possible to retain constant layer thickness. At these positions Busk
suggested that the folds become non-parallel and that limb thinning takes place; he suggested
that freehand constructions should be used as there was no unique geometric solution to the
problem by the methods previously used. He was clearly aware of the problems of thickness
changes in folds but he thought that there were so many unknown factors that an exact
geometric solution of the problem was too complicated or even impossible.
All the features listed above arise because of the assumptions on which the method is
based are not applicable to most fold forms.
Folds with geometric charactenstics of the parallel 1B are generally uncommon. Folds
which have geometry approximating to this style are most commonly found in single layer
competent layers of ptygmatic structures, some multilayered complexes where strong
competence contrasts exist between the different components. In these multilayers parallel
folds may occur in the most competent layer, especially where they are strongly laminated
parallel to the contacts. In this case, however, the less competent layers take on forms of Class
3 folds. In multilayered Complexes which do not show strongly marked competence variations
the folds alternate between Class IC and 3, often approaching to the similar (Class 2) form. The
sudden changes in curvature which appear in these reconstructions are clearly an outcome of
the methods used and become less pronounced as more data arc incorporated into the
construction. A refinement of the Busk technique was suggested by Mertie (1940) in order to
smooth the curvature changes along each folded surface. He described a method for
establishing positions of continuously changing centres of curvature (an evolute), and how,
from this, it is possible to construct the surfaces in the structure showing continuously changing
curvature (an involute). This is an Improvement on the basic method of Busk, but it is still
open to the criticism that the folding remains parallel throughout the layers, and it still leads to
the appearance of cuspate discontinuities at certain points in the sectIOn. Cuspate folds are
commonly observed in natural folds but they are always localized at special positins in the
structure close to interfaces between materials of marked ductility constrast. This observation
conflicts with the random location of cusps appearing on the graphical constructions made by
the Busk-Mertie methods, and which arise entirely as a result of geometric construction
procedures. The changing amplitude of folds away from the data collection surface is an
outcome of the assumption of parallelism of the folded layers. It has been suggested that the
change of shape downwards implies that the folds pass into unfolded material, perhaps with an
intervening decoupling surface or decollement horizon. The same geometric feature also
appears in the sections in an upward direction, and so clearly this interpretation is unsound.
3. Page3
Kink Method
PURPOSE
Deformation of the Earth's surface is one of the most visible results of
activetectonics, but it is not the whole story. Some faults (“buried reverse faults”) can
causelarge earthquakes (for example, the 1994 Northridge earthquake that struck
the LosAngelesregion)eventhoughtheyneverbreakthesurface.Twoofthemostusefultoolsforstudying faults that
do not break the surface are 1) balanced cross sections, and 2)retrodeformation. This
exercise will acquaint you with these two tools and show you howtheycanbeappliedtoproblemsinactivetectonics,
activefolding,andearthquakehazard.
How the Kink Method Works
It's fairly common for folds to exhibit uniform dips for a wide interval and then change
dip abruptly. In other words the fold exhibits a series of kinks rather than smooth curvature.
We can approximate such folds using the kink method. It is a bit more common these days for
folds to be represented this way than with the Busk or arc method.
The basic method is to allow each dip measurement to define a zone where the dip is
constant. The boundaries of the dip zones are the lines that bisect angles between adjacent dips.
The example below begins with three different ways to find the bisector.
The actual point here the fold kinks may not coincide exactly with the bisector. Why
should it? If you have two dips at points 1 and 2, the change in dip could come anywhere
between them, and is not necessarily going to coincide with a line halfway between the two
dips. This method, like all fold construction techniques, is an approximation.
Tying the Diagram to Reality
It is virtually certain when you draw a cross section using strictly geometric methods
that the contacts will not match exactly with their predicted positions. There are many reasons
why not:
The units will not be uniform in thickness
There are small construction errors
Dips are not uniform from place to place
Dip measurements have small errors
Folds do not have ideal geometrical shapes.
4. Page4
Here we have indicated the
stratigraphy. It is virtually
certain when you draw a cross
section using strictly geometric
methods that the contacts will not
match exactly with their predicted
positions.
What we need to do now is redraw
the folds so the cross-section
matches both the dips and the
stratigraphy.
Here the cross section lines are
subdued.
Most of the time you can modify
the fold shapes by hand to match
the stratigraphy without too much
trouble. Modified contacts are in
black.
Do not get distracted by your dip symbols or stratigraphic colors. The only requirement is that
the stratigraphy and dips match on the surface. Be prepared to modify the colors and depart
from the dips below the surface if it's called for. Compare the two diagrams above to see that
this was actually done.