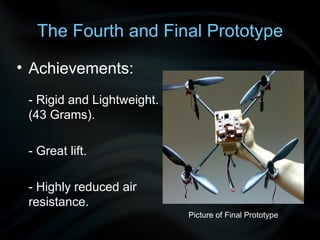
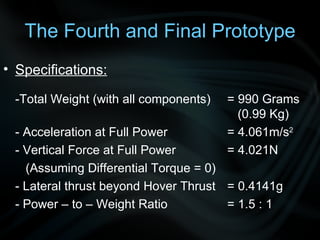
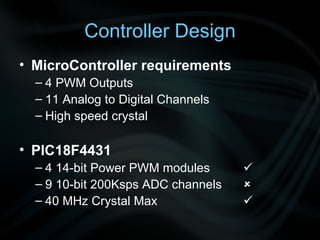
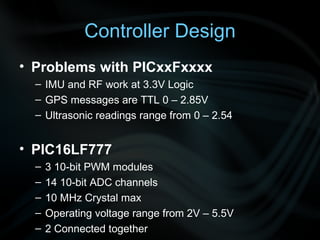
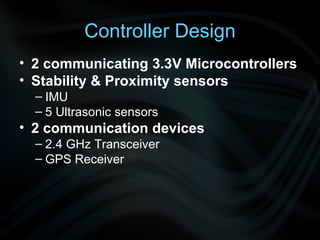
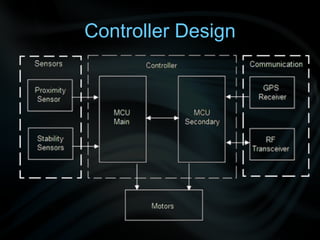
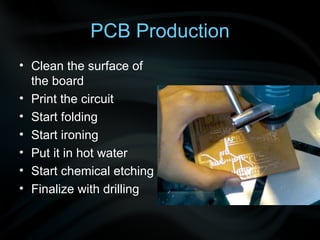
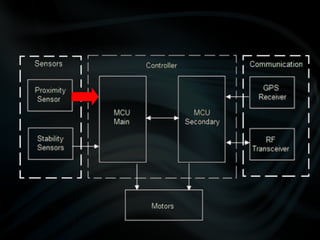
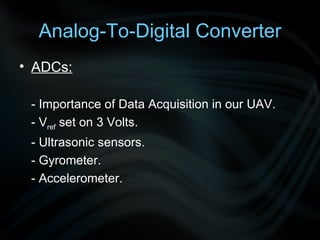
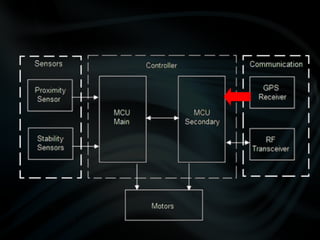
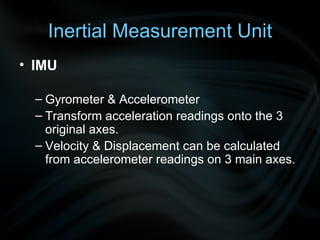
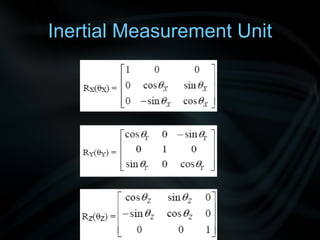
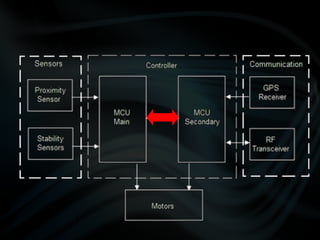
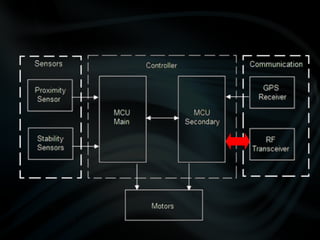
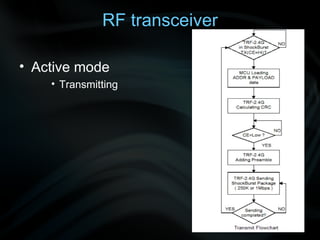
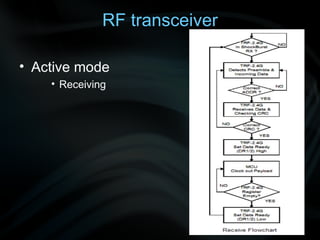
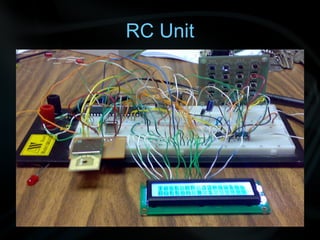
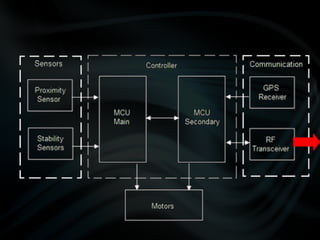
The document discusses the design and development of quadcopter unmanned aerial vehicles (UAVs). It describes the prototypes created, including improvements made to reduce weight and increase lift. Sensors and controllers are discussed, including sensors for position, proximity, and navigation. The final prototype achieved stable hovering with a weight of 43 grams and incorporated an inertial measurement unit, ultrasonic sensors, GPS, and radio frequency transmission for control and data transmission.


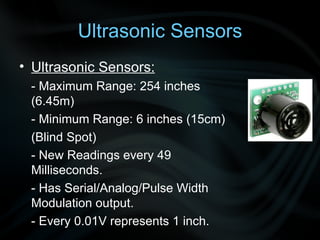


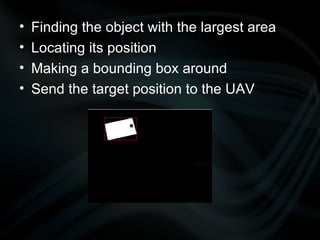
![Pixel connectivity The use of the labeling function [label,num]=bwlabel(y,4); stats=regionprops(label,'Area','BoundingBox','PixelList'); What are the importance of those functions](https://image.slidesharecdn.com/UAVPresentation-123078801129-phpapp03/85/UAV-Presentation-103-320.jpg)