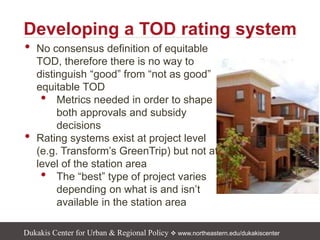
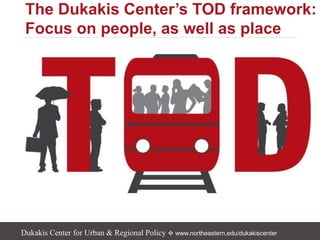
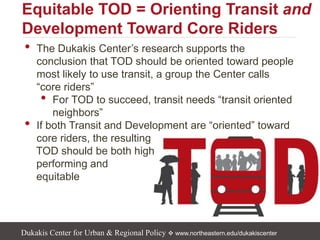
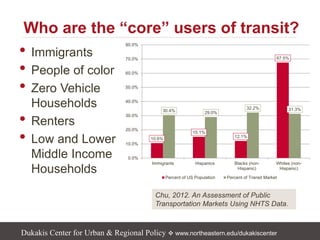
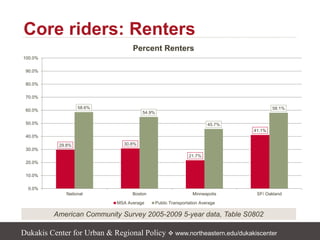
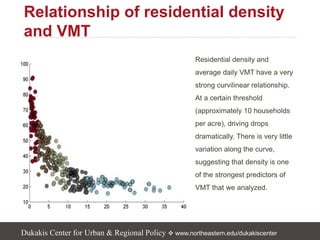
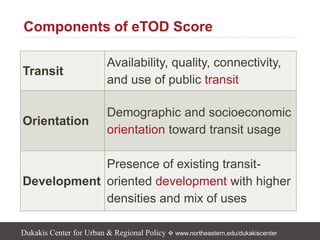
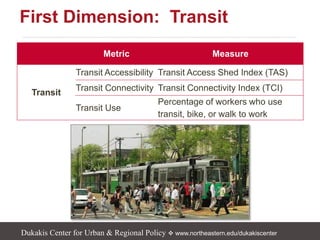
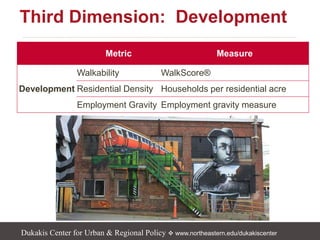
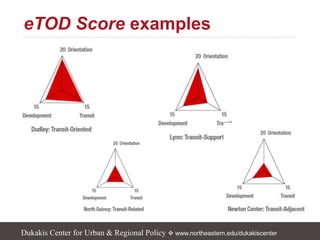
HOW CAN EQUITY IN TOD BE
DEFINED AND MEASURED?
Dukakis Center for Urban & Regional Policy  www.northeastern.edu/dukakiscenter
• No consensus definition of equitable
TOD, therefore there is no way to
distinguish “good” from “not as good”
equitable TOD
• Metrics needed in order to shape
both approvals and subsidy
decisions
• Rating systems exist at project level
(e.g. Transform’s GreenTrip) but not at
level of the station area
• The “best” type of project varies
depending on what is and isn’t
available in the station area
Developing a TOD rating system
Dukakis Center for Urban & Regional Policy  www.northeastern.edu/dukakiscenter
Why in Massachusetts? VMT data!!
Dukakis Center for Urban & Regional Policy  www.northeastern.edu/dukakiscenter
The Dukakis Center’s TOD framework:
Focus on people, as well as place
Dukakis Center for Urban & Regional Policy  www.northeastern.edu/dukakiscenter
OPTION ONE: TOD & equity sub-scores
Mixed-income
housing
Enhanced access
Neighborhood
amenities
Higher ridership
Lower VMT
Catalytic TOD
Higher Ridership/
Lower VMT
Greater Equity
Outcomes
Equitable
TOD
TOD
Rating
Equity
Rating
Dukakis Center for Urban & Regional Policy  www.northeastern.edu/dukakiscenter
• For “transit orientation” we know the desired outcome
– less driving, more transit use
• Analyze factors using daily household Vehicle
Miles Travelled as the “dependent variable”
• For “equity orientation” it is more difficult to define a
single desired outcome
• One option would be to construct an equity
“scale”
• Or, use a less quantitative approach and focus
on factors relevant to equity
But what is the equity “outcome”?
Dukakis Center for Urban & Regional Policy  www.northeastern.edu/dukakiscenter
OPTION TWO: One integrated
rating system
• Higher ridership
• Lower VMT
• Catalytic TOD
• Mixed-income
housing
• Enhanced access
• Neighborhood
amenities
TOD
Rating
Equity
Rating
Equitable
TOD
Dukakis Center for Urban & Regional Policy  www.northeastern.edu/dukakiscenter
• The Dukakis Center’s research supports the
conclusion that TOD should be oriented toward people
most likely to use transit, a group the Center calls
“core riders”
• For TOD to succeed, transit needs “transit oriented
neighbors”
• If both Transit and Development are “oriented” toward
core riders, the resulting
TOD should be both high
performing and
equitable
Equitable TOD = Orienting Transit and
Development Toward Core Riders
Dukakis Center for Urban & Regional Policy  www.northeastern.edu/dukakiscenter
Who are the “core” users of transit?
• Immigrants
• People of color
• Zero Vehicle
Households
• Renters
• Low and Lower
Middle Income
Households
Chu, 2012. An Assessment of Public
Transportation Markets Using NHTS Data.
10.6%
15.1%
12.1%
67.5%
30.4% 29.0%
32.2% 31.3%
0.0%
10.0%
20.0%
30.0%
40.0%
50.0%
60.0%
70.0%
80.0%
Immigrants Hispanics Blacks (non-
Hispanic)
Whites (non-
Hispanic)
Percent of US Population Percent of Transit Market
Dukakis Center for Urban & Regional Policy  www.northeastern.edu/dukakiscenter
Core riders: Zero vehicle households
American Community Survey 2005-2009 5-year data, Table S0802
36.0%
26.0%
22.4% 21.0%
31.1%
36.6%
30.3%
33.7%
32.8% 37.4% 47.2% 45.3%
4.3%
6.7%
2.8%
6.6%
0.0%
10.0%
20.0%
30.0%
40.0%
50.0%
60.0%
70.0%
80.0%
90.0%
100.0%
0.0%
10.0%
20.0%
30.0%
40.0%
50.0%
60.0%
70.0%
80.0%
90.0%
100.0%
National Boston Minneapolis SF/ Oakland
Public Transportation Users Distribution by Vehicle
Ownership
2+ vehicles available
1 vehicle available
No vehicle available
MSA No vehicle available
Dukakis Center for Urban & Regional Policy  www.northeastern.edu/dukakiscenter
Core riders: Renters
American Community Survey 2005-2009 5-year data, Table S0802
29.8% 30.8%
21.7%
41.1%
58.6%
54.9%
45.7%
58.1%
0.0%
10.0%
20.0%
30.0%
40.0%
50.0%
60.0%
70.0%
80.0%
90.0%
100.0%
National Boston Minneapolis SF/ Oakland
Percent Renters
MSA Average Public Transportation Average
Dukakis Center for Urban & Regional Policy  www.northeastern.edu/dukakiscenter
Residential density and
average daily VMT have a very
strong curvilinear relationship.
At a certain threshold
(approximately 10 households
per acre), driving drops
dramatically. There is very little
variation along the curve,
suggesting that density is one
of the strongest predictors of
VMT that we analyzed.
Relationship of residential density
and VMT
Dukakis Center for Urban & Regional Policy  www.northeastern.edu/dukakiscenter
The relationship
between percentage or
renters and average
daily VMT is generally
strongly negative: the
higher the proportion of
renters, the lower the
average daily household
VMT.
Relationship of proportion of
renters and VMT
Average
Daily
VMTper
Household
Percentage of renters
The eTOD Score rating
system
Dukakis Center for Urban & Regional Policy  www.northeastern.edu/dukakiscenter
Transit
Availability, quality, connectivity,
and use of public transit
Orientation
Demographic and socioeconomic
orientation toward transit usage
Development
Presence of existing transit-
oriented development with higher
densities and mix of uses
Components of eTOD Score
Dukakis Center for Urban & Regional Policy  www.northeastern.edu/dukakiscenter
First Dimension: Transit
Metric Measure
Transit
Transit Accessibility Transit Access Shed Index (TAS)
Transit Connectivity Transit Connectivity Index (TCI)
Transit Use
Percentage of workers who use
transit, bike, or walk to work
Dukakis Center for Urban & Regional Policy  www.northeastern.edu/dukakiscenter
Second Dimension: Oriented
Metric Measure
Orientation
Transit Dependency Percentage of 0-car households
Lower Income
Percent households with income
<$25,000
Rental Housing Percentage renters
Affordability
Percent of income spent on
transportation
Dukakis Center for Urban & Regional Policy  www.northeastern.edu/dukakiscenter
Third Dimension: Development
Metric Measure
Development
Walkability WalkScore®
Residential Density Households per residential acre
Employment Gravity Employment gravity measure
Dukakis Center for Urban & Regional Policy  www.northeastern.edu/dukakiscenter
Final list of eTOD Score attributes
Dukakis Center for Urban & Regional Policy  www.northeastern.edu/dukakiscenter
eTOD Score Ranges
eTOD Score Range
Mean VMT per day
per household
Description
41+ 21.3 Transit-Oriented
31-40 27.6 Transit-Supportive
21-30 36.5 Transit-Related
0-20 58.5 Transit-Adjacent
Dukakis Center for Urban & Regional Policy  www.northeastern.edu/dukakiscenter
eTOD Score examples
Dukakis Center for Urban & Regional Policy  www.northeastern.edu/dukakiscenter
Using eTOD Score
As a “think and do” tank, the Kitty and Michael Dukakis Center for Urban
and Regional Policy is equally committed to producing state-of-the-art
applied research and implementing effective policies and practices based
on that research. The Center’s collaborative research and problem-
solving model uses powerful data analysis, multidisciplinary research and
evaluation techniques and a policy-driven perspective to address critical
challenges facing urban areas.
A region’s economy and livability depend on the ability of the
transportation system to provide access to opportunity, support economic
growth and anchor sustainable development patterns. The Dukakis
Center's work on Researching Equitable and Sustainable Transportation
(ReSET) focuses on transportation equity, sustainable transportation,
equitable transit-oriented development and transportation finance.
Policy Focus Areas:
• Transportation
• Economic
Development
• Housing
• Labor/Workforce
Northeastern University
Dukakis Center for Urban & Regional Policy
Dukakis Center for Urban and Regional Policy
Northeastern University
310 Renaissance Park
360 Huntington Avenue
Boston, MA 02115
(617) 373-7870
www.northeastern.edu/dukakiscenter
A “Think and Do” Tank
Dukakis Center for Urban & Regional Policy  www.northeastern.edu/dukakiscenter

922 12 pollack_lunch learn equity

  • 1.
    HOW CAN EQUITYIN TOD BE DEFINED AND MEASURED?
  • 2.
    Dukakis Center forUrban & Regional Policy  www.northeastern.edu/dukakiscenter • No consensus definition of equitable TOD, therefore there is no way to distinguish “good” from “not as good” equitable TOD • Metrics needed in order to shape both approvals and subsidy decisions • Rating systems exist at project level (e.g. Transform’s GreenTrip) but not at level of the station area • The “best” type of project varies depending on what is and isn’t available in the station area Developing a TOD rating system
  • 3.
    Dukakis Center forUrban & Regional Policy  www.northeastern.edu/dukakiscenter Why in Massachusetts? VMT data!!
  • 4.
    Dukakis Center forUrban & Regional Policy  www.northeastern.edu/dukakiscenter The Dukakis Center’s TOD framework: Focus on people, as well as place
  • 5.
    Dukakis Center forUrban & Regional Policy  www.northeastern.edu/dukakiscenter OPTION ONE: TOD & equity sub-scores Mixed-income housing Enhanced access Neighborhood amenities Higher ridership Lower VMT Catalytic TOD Higher Ridership/ Lower VMT Greater Equity Outcomes Equitable TOD TOD Rating Equity Rating
  • 6.
    Dukakis Center forUrban & Regional Policy  www.northeastern.edu/dukakiscenter • For “transit orientation” we know the desired outcome – less driving, more transit use • Analyze factors using daily household Vehicle Miles Travelled as the “dependent variable” • For “equity orientation” it is more difficult to define a single desired outcome • One option would be to construct an equity “scale” • Or, use a less quantitative approach and focus on factors relevant to equity But what is the equity “outcome”?
  • 7.
    Dukakis Center forUrban & Regional Policy  www.northeastern.edu/dukakiscenter OPTION TWO: One integrated rating system • Higher ridership • Lower VMT • Catalytic TOD • Mixed-income housing • Enhanced access • Neighborhood amenities TOD Rating Equity Rating Equitable TOD
  • 8.
    Dukakis Center forUrban & Regional Policy  www.northeastern.edu/dukakiscenter • The Dukakis Center’s research supports the conclusion that TOD should be oriented toward people most likely to use transit, a group the Center calls “core riders” • For TOD to succeed, transit needs “transit oriented neighbors” • If both Transit and Development are “oriented” toward core riders, the resulting TOD should be both high performing and equitable Equitable TOD = Orienting Transit and Development Toward Core Riders
  • 9.
    Dukakis Center forUrban & Regional Policy  www.northeastern.edu/dukakiscenter Who are the “core” users of transit? • Immigrants • People of color • Zero Vehicle Households • Renters • Low and Lower Middle Income Households Chu, 2012. An Assessment of Public Transportation Markets Using NHTS Data. 10.6% 15.1% 12.1% 67.5% 30.4% 29.0% 32.2% 31.3% 0.0% 10.0% 20.0% 30.0% 40.0% 50.0% 60.0% 70.0% 80.0% Immigrants Hispanics Blacks (non- Hispanic) Whites (non- Hispanic) Percent of US Population Percent of Transit Market
  • 10.
    Dukakis Center forUrban & Regional Policy  www.northeastern.edu/dukakiscenter Core riders: Zero vehicle households American Community Survey 2005-2009 5-year data, Table S0802 36.0% 26.0% 22.4% 21.0% 31.1% 36.6% 30.3% 33.7% 32.8% 37.4% 47.2% 45.3% 4.3% 6.7% 2.8% 6.6% 0.0% 10.0% 20.0% 30.0% 40.0% 50.0% 60.0% 70.0% 80.0% 90.0% 100.0% 0.0% 10.0% 20.0% 30.0% 40.0% 50.0% 60.0% 70.0% 80.0% 90.0% 100.0% National Boston Minneapolis SF/ Oakland Public Transportation Users Distribution by Vehicle Ownership 2+ vehicles available 1 vehicle available No vehicle available MSA No vehicle available
  • 11.
    Dukakis Center forUrban & Regional Policy  www.northeastern.edu/dukakiscenter Core riders: Renters American Community Survey 2005-2009 5-year data, Table S0802 29.8% 30.8% 21.7% 41.1% 58.6% 54.9% 45.7% 58.1% 0.0% 10.0% 20.0% 30.0% 40.0% 50.0% 60.0% 70.0% 80.0% 90.0% 100.0% National Boston Minneapolis SF/ Oakland Percent Renters MSA Average Public Transportation Average
  • 12.
    Dukakis Center forUrban & Regional Policy  www.northeastern.edu/dukakiscenter Residential density and average daily VMT have a very strong curvilinear relationship. At a certain threshold (approximately 10 households per acre), driving drops dramatically. There is very little variation along the curve, suggesting that density is one of the strongest predictors of VMT that we analyzed. Relationship of residential density and VMT
  • 13.
    Dukakis Center forUrban & Regional Policy  www.northeastern.edu/dukakiscenter The relationship between percentage or renters and average daily VMT is generally strongly negative: the higher the proportion of renters, the lower the average daily household VMT. Relationship of proportion of renters and VMT Average Daily VMTper Household Percentage of renters
  • 14.
    The eTOD Scorerating system
  • 15.
    Dukakis Center forUrban & Regional Policy  www.northeastern.edu/dukakiscenter Transit Availability, quality, connectivity, and use of public transit Orientation Demographic and socioeconomic orientation toward transit usage Development Presence of existing transit- oriented development with higher densities and mix of uses Components of eTOD Score
  • 16.
    Dukakis Center forUrban & Regional Policy  www.northeastern.edu/dukakiscenter First Dimension: Transit Metric Measure Transit Transit Accessibility Transit Access Shed Index (TAS) Transit Connectivity Transit Connectivity Index (TCI) Transit Use Percentage of workers who use transit, bike, or walk to work
  • 17.
    Dukakis Center forUrban & Regional Policy  www.northeastern.edu/dukakiscenter Second Dimension: Oriented Metric Measure Orientation Transit Dependency Percentage of 0-car households Lower Income Percent households with income <$25,000 Rental Housing Percentage renters Affordability Percent of income spent on transportation
  • 18.
    Dukakis Center forUrban & Regional Policy  www.northeastern.edu/dukakiscenter Third Dimension: Development Metric Measure Development Walkability WalkScore® Residential Density Households per residential acre Employment Gravity Employment gravity measure
  • 19.
    Dukakis Center forUrban & Regional Policy  www.northeastern.edu/dukakiscenter Final list of eTOD Score attributes
  • 20.
    Dukakis Center forUrban & Regional Policy  www.northeastern.edu/dukakiscenter eTOD Score Ranges eTOD Score Range Mean VMT per day per household Description 41+ 21.3 Transit-Oriented 31-40 27.6 Transit-Supportive 21-30 36.5 Transit-Related 0-20 58.5 Transit-Adjacent
  • 21.
    Dukakis Center forUrban & Regional Policy  www.northeastern.edu/dukakiscenter eTOD Score examples
  • 22.
    Dukakis Center forUrban & Regional Policy  www.northeastern.edu/dukakiscenter Using eTOD Score
  • 23.
    As a “thinkand do” tank, the Kitty and Michael Dukakis Center for Urban and Regional Policy is equally committed to producing state-of-the-art applied research and implementing effective policies and practices based on that research. The Center’s collaborative research and problem- solving model uses powerful data analysis, multidisciplinary research and evaluation techniques and a policy-driven perspective to address critical challenges facing urban areas. A region’s economy and livability depend on the ability of the transportation system to provide access to opportunity, support economic growth and anchor sustainable development patterns. The Dukakis Center's work on Researching Equitable and Sustainable Transportation (ReSET) focuses on transportation equity, sustainable transportation, equitable transit-oriented development and transportation finance. Policy Focus Areas: • Transportation • Economic Development • Housing • Labor/Workforce Northeastern University Dukakis Center for Urban & Regional Policy Dukakis Center for Urban and Regional Policy Northeastern University 310 Renaissance Park 360 Huntington Avenue Boston, MA 02115 (617) 373-7870 www.northeastern.edu/dukakiscenter A “Think and Do” Tank Dukakis Center for Urban & Regional Policy  www.northeastern.edu/dukakiscenter Dukakis Center for Urban & Regional Policy  www.northeastern.edu/dukakiscenter