
Recommended
More Related Content
What's hot
What's hot (20)
Viewers also liked
Viewers also liked (13)
Similar to Benchmarking TOD
Similar to Benchmarking TOD (20)
Recently uploaded
Recently uploaded (20)
Benchmarking TOD
- 1. BENCHMARKING TRANSIT-ORIENTED DEVELOPMENT: A COMPREHENSIVE SET OF TOOLS FOR EVALUATING TOD OUTCOMES JENNIFER YEAMANS PROFESSIONAL REPORT Submitted in partial satisfaction of the requirements of the degree of MASTER OF CITY PLANNING in the Department of City and Regional Planning of the UNIVERSITY OF CALIFORNIA, BERKELEY APPROVED Prof. Elizabeth Deakin Gary Binger Paul Marx Date: Spring 2007
- 2. i TABLE OF CONTENTS EXECUTIVE SUMMARY .........................................................................................................E-1 I. INTRODUCTION....................................................................................................................... 1 Definition of TOD....................................................................................................................... 1 Why Benchmark Transit-Oriented Development? ..................................................................... 2 II. METHODOLOGY..................................................................................................................... 3 Literature Review: Defining TOD.............................................................................................. 3 Case Studies................................................................................................................................ 5 III. CRITERIA FOR SELECTING BENCHMARKS AND INDICATORS................................. 7 Identifying the Six Benchmarks.................................................................................................. 7 IV. QUANTITATIVE AND QUALITATIVE ELEMENTS ......................................................... 8 Quantitative Approach................................................................................................................ 8 Qualitative Approach................................................................................................................ 10 V. BENCHMARK OVERVIEW AND RATIONALE ................................................................ 12 Benchmark 1: Transit Usage and Reduced Auto Dependence................................................. 12 Benchmark 2: Land Use, Density, and Growth........................................................................ 14 Benchmark 3: Access to Transit ............................................................................................... 18 Benchmark 4: Equity ................................................................................................................ 19 Benchmark 5: TOD Market Factors ......................................................................................... 20 Benchmark 6: Institutional and Political Context..................................................................... 22 VI. CONCLUSIONS .................................................................................................................... 23 Limitations of the Benchmarks................................................................................................. 24 Future Research ........................................................................................................................ 24 BIBLIOGRAPHY......................................................................................................................... 26 APPENDIX A............................................................................................................................. A-1 Qualitative TOD Benchmark Questionnaire for Local and Regional Authorities.................. A-1 APPENDIX B............................................................................................................................. B-1 Example Evaluation Criteria for and Applications for Indicators .......................................... B-1 LIST OF TABLES Table 1. Quantitative Indicators by Benchmark and Their Sources............................................... 9 Table 2. Qualitative Indicators by Benchmark and Their Sources............................................... 11 Table 3. Vehicle Density Rates and Housing Growth within a Half-Mile of Transit Stations..... 14 Table 4A. Yield of Riders from Housing within a Quarter-Mile of Transit................................. 16 Table 4B. Yield of Riders from Housing within a Half-Mile of Transit...................................... 16 LIST OF FIGURES Figure 1. Barriers to Access at a Light Rail Station in California................................................ 19
- 3. Benchmarking Transit-Oriented Development: Executive Summary E-1 EXECUTIVE SUMMARY Transit-oriented development is proposed as a way to increase transit ridership, provide mixed- income housing and job opportunities, create walkable communities, and expand consumer choices. This paper provides an outcomes-oriented definition of TOD: TOD is defined as development within a half-mile of a station served by fast and frequent transit, with sufficient housing and employment densities to generate at least half of needed ridership within walking distance, with high-quality multi- modal access where parking is managed, and a mix of uses provides convenient retail and services for residents, workers, and transit users. Because successful TOD requires such a complex formula, this paper proposes a comprehensive set of benchmarks to designed to analyze TOD outcomes objectively in any region. The benchmarks were based on a review of relevant TOD literature as well as background data gathered in seven study regions from demographic and transportation data sets, stakeholder interviews, and site visits. The six benchmarks used to analyze TOD outcomes are: (1) Transit usage and reduced auto dependence (2) Land use, density, and growth (3) Access to transit (4) Equity (5) TOD market factors (6) Institutional and political context Each benchmark comprises several indicators to measure TOD performance at numerous geographic scales, such as a single station-area, a transit corridor, individual jurisdiction(s), urban versus suburban areas, or an entire region, via both quantitative and qualitative measures. Each benchmark features a set of indicators to help evaluate the benchmark’s performance. Benchmark 1: Transit Usage and Reduced Auto Dependence In many regions, a major goal of TOD is to reduce dependence on the private automobile by providing people with convenient transportation alternatives and creating the circumstances that will encourage them to use the alternatives. This set of indicators provides an essential set of measurements as to whether TOD is an effective means of curbing driving and increasing transit usage. (1A) Do areas in the city (or suburbs) near transit show higher transit mode share than elsewhere in the city (or suburbs)? (1B) Does transit contribute a significant portion of work trips to the CBD? (1C) Is transit mode share increasing in both the city and the suburbs? (2) Is the percent increase in transit ridership for a given period greater than the national average? (3) Is the percent increase in off-peak transit ridership for a given period greater than the national average?
- 4. Benchmarking Transit-Oriented Development: Executive Summary E-2 (4) Do people who live near transit have fewer vehicles per household (lower vehicle density) than those who live elsewhere in the city (or suburbs)? (5) Are a higher proportion of housing units near transit car-free than elsewhere in the city (or suburbs)? (6) Is annual VMT per capita decreasing? Benchmark 2: Land Use, Density, and Growth This set of indicators represents a fundamental core of how impacts of TOD and planning on development outcomes in a region and near transit stations can be better analyzed and understood. (7) Is population growing faster in the city than in the suburbs? (8) Is housing supply growing faster in the city than in the suburbs? (9) Is employment growth in the city remaining competitive with employment growth in the suburbs? (10A) Is housing density above a transit-supportive threshold? (10B) Is housing density increasing at a greater rate around transit than elsewhere in the city (or suburbs)? (11A) Is employment density above a transit-supportive threshold? (11B) Is the change in employment density in the city (a) positive and (b) greater than in the suburbs? (12) Does the region have a TOD plan specifically addressing station areas? (13) Do zoning regulations exist which require minimum densities of at least 20 du/acre near transit stations? (14) Do zoning regulations include parking maximums not exceeding one per dwelling unit? (15) Do zoning regulations allow for mixed use by right (i.e. not as a conditional use)? Benchmark 3: Access to Transit Accessibility of transit to users is a vital element of successful TOD. In many TODs, access must be balanced carefully between users accessing the station by numerous modes: automobiles, bicycles, pedestrians, and transit users making transfers at the station.. These modes have the potential to conflict with one another in dense station areas, and prioritizing one mode, such as access by car, can create very different outcomes from prioritizing another mode, such as access for pedestrians. These indicators measure access to transit: (16) Is parking is provided at a limited number of stations, generally near the end of line? (17) Are station area parking fees priced to cover costs? (18) Do existing regulations require sidewalks and pedestrian paths in new developments? (19) Do existing regulations require bike paths in new developments? (20) Does the street design along the transit corridor enable pedestrian traffic? (21) Are pedestrian-friendly amenities such as benches, lighting, street trees and trash cans ubiquitous around station areas?
- 5. Benchmarking Transit-Oriented Development: Executive Summary E-3 Benchmark 4: Equity TOD often introduces new housing and transportation choices to an area. As part of a smart growth strategy, demographic characteristics of growth around transit should echo regional trends. The following indicators are a check to ensure that the opportunities presented by developing near transit are equitably distributed in the population, particularly among those who cannot or prefer not to drive a car: (22) To what extent are people with disabilities being served by transit? (23) To what extent are older people being served by transit? (24) To what extent are minorities being served by transit? (25A) To what extent are lower-income households being served by transit? (25B) Does transit serve regional concentrations of poverty? (26) Are there public programs to facilitate the creation of affordable housing units in transit station areas? Benchmark 5: TOD Market Factors A frequent argument for TOD is that it is a cost-effective solution for generating transit ridership and meeting demand in under-served housing markets. TOD has the potential to increase ridership and thereby reduce costs per rider, but it can only do so if the regional market factors support TOD and justify its development. The TOD market factor indicators evaluate TOD performance from both transit supply perspective (demand for development near transit hinges in part on the quality of transit service supplied to the station area) and the development demand perspective: (27) Is the percent change in annual vehicle revenue hours greater than the national average for the same mode for the same period? (28) Is the percent change in annual unlinked passenger trips per annual vehicle revenue hour positive? (29) Are all station areas served by fast, frequent transit service to major destinations? (30) Is public funding for TOD available throughout the region? (31) Is there a high level of developer interest in development around station areas? (32) Do market studies compiled by government agencies show the high demand for TOD? (33) Do development incentives exist to promote TOD? (34) Are joint development opportunities used to promote TOD? (35) Are staff responsible for generating interest in TOD and assisting developers? (36) Are zoning codes available on the Internet? Benchmark 6: Institutional and Political Context This benchmark presumes that a TOD-supportive institutional framework — that is, policies that are integrated both vertically along many levels of decision making as well as horizontally across many jurisdictions in a region — is a better predictor of likely TOD success in a region. These indicators evaluate the level of outreach to the public to build support for TOD, whether the
- 6. Benchmarking Transit-Oriented Development: Executive Summary E-4 political environment supportive of transit and TOD, and the availability of knowledgeable planning staff to promote TOD: (37) Does the region have an integrated transit and land use plan? (38) Do all jurisdictions with land use authority that are served by transit have an enacted transit and land use plan? (39) Do most of stations have station-area plans to guide development in a TOD supportive manner? (40) Is there a systematic method in place for tracking the implementation of TOD plans? (41) Does the political environment in the region favor the expansion of transit and the development of TOD zones? (42) Have efforts been made to develop community support for transit supportive intensities and styles of development? (43) Is the region free of institutional barriers to TOD, and has community opposition to TOD been limited or unorganized? Taken together, these indicators are designed to be assembled quickly and easily from commonly available data sources, and can be used by a variety of agencies that review, fund, or depend upon TOD performance.
- 7. Benchmarking Transit-Oriented Development 1 I. INTRODUCTION Transit-oriented development (TOD) is at the center of an increasingly broad dialogue among elected officials, planners, developers, and researchers interested in investigating TOD as a key component of smart growth. However, there are many obstacles that arise in developing near transit, and no universally accepted definition of TOD exists. The term has been used to describe a single building, a station-area plan, a whole station-area development, or part of a regional growth strategy. Another factor is the different scales TOD can take in areas with different growth patterns and with various transit modes (bus versus rail, or light rail versus heavy rail, for example).While a limited number of empirical studies of TOD are beginning to be published, not very many mature TODs exist to provide longitudinal studies, and much of the current literature is promotional or anecdotal in nature. Because of these issues, a set of objective benchmarks to measure TOD performance could be immediately useful in many regions evaluating existing or future TOD. In areas where TOD is a mature concept, TOD benchmarks could measure performance over time to see whether TOD is meeting locally or regionally defined objectives. In areas where TOD is new or in planning stages, benchmarks could provide valuable baseline data from which to measure future progress. This chapter outlines the process by which the University of California Transportation Center developed a comprehensive set of benchmarks to measure the performance and effectiveness of TOD in a region. It begins with an outcomes-oriented definition of TOD, drawn from the literature, upon which our research was based, and an assessment of why indicators can be a useful measure of TOD. Next, we discuss the research methodology which helped inform our selection of meaningful TOD benchmarks. Finally, we define each benchmark and its relevant indicators, and explain how each is relevant to understanding TOD success within a region. Definition of TOD Since TOD can vary with type of transit, size of investment, location within the region, and other factors, we chose a simple set of parameters to include in our definition of transit-oriented development. In this study TOD is defined as: • An area within one-quarter to one-half mile of a station or stop • Served by fast and frequent transit • Developed at sufficient employment and/or housing densities that at least half of needed ridership is within walking distance • Served by high-quality multi-modal access with pedestrian-oriented streetscapes and a managed parking supply • Provided with conveniently located mixed-use retail and services for the TOD’s residents, workers, and transit users. These factors are widely understood to be important to transit and TOD success. However, for each factor, some flexibility is allowed, and specific thresholds of effectiveness can be defined to match the region, corridor, and station, accounting for local costs and likely performance.
- 8. Benchmarking Transit-Oriented Development 2 Why Benchmark Transit-Oriented Development? Benchmarks are a common business management practice used to identify and replicate best practices. In TOD evaluations, benchmarks provide a framework of consistency for measurements and analysis via a set of performance indicators relevant to each benchmark. How Benchmarks Can Be Used TOD benchmarks are intended to demonstrate how a region’s specific TODs are performing and how effectively regions are channeling growth to areas around transit stations. Concurrently, the benchmarks serve as guidance toward what is needed to make TOD succeed. The information the benchmarks provide will allow cities and regions to maximize TOD success by focusing on attaining a critical set of characteristics that support TOD, such as sufficient density and pedestrian-friendly access. Also of importance is the ability of the benchmarks and their indicators to serve as an evaluation tool for agencies that review, fund, or depend upon TOD performance — the Federal Transit Administration (FTA), Metropolitan Planning Organizations (MPOs), the Department of Housing and Urban Development (HUD), state transportation departments, and others . Through performance indicators, benchmarks can help identify on-the-ground accomplishments as well as deficits or liabilities, and can measure progress (or the lack of it) toward TOD objectives. Finally, the benchmarks can serve a diagnostic role by helping to uncover the reasons for accomplishments or lack thereof, and by measuring the degree to which widely accepted best- practice strategies have been implemented. While the benchmarks help take a measure of a region, city, or station area in its TOD performance, they are not designed for cross-regional comparisons, since desired outcomes vary with regional conditions. Selection Criteria for Performance Indicators In order to benefit those wishing to benchmark TOD, it is essential to use the best performance indicators. According to the OECD, an indicator is “a statistic or parameter that, tracked over time, provides information on trends in the condition of a phenomenon and has significance extending beyond that associated with the properties of the statistic itself.”1 In choosing the indicators for TOD benchmarks, we considered the following characteristics of useful indicators2 3 4 : • Relevance: An indicator should be directly linked to the objective of interest. • Clarity: The indicator must be easily understood without a great deal of explanation. • Measurability: For consistency, indictors must be measurable and economically feasible to obtain. • Replicability: The method of measurement for an indicator must be replicable over time (i.e. a third party should have the ability to collect similar data). 1 Hoornweg 2006. 2 Hoornweg 2006. 3 “Integrating Sustainability into the Transportation Planning Process” 2005. 4 Lee 2003.
- 9. Benchmarking Transit-Oriented Development 3 • Flexibility: A successful indicator should accommodate measurement improvements. The indicators selected for TOD were chosen with these characteristics in mind. Many of the quantitative indicators selected for this study come from clear, reliable, replicable sources such as the decennial Census and Federal Transit Administration data, while qualitative indicators can be obtained from agency surveys. Since many data important to TOD evaluation are already collected or can relatively easily be obtained, the indicators chosen should prove to be both replicable and flexible. One caveat to indicator data obtained from national surveys is the potential for survey questions or data acquisition to change from survey year to survey year, which must be considered in any longitudinal analysis. Despite this potential limitation, however, these sources are likely to provide the most consistent data accessible across the entire nation. Application While indicators can be valuable evaluation tools, they may also have a high propensity for misinterpretation. These top-level indicators should not form the sole basis for decisions regarding transportation or land use investments; rather, they should facilitate the understanding how effective TOD policies and outcomes are relative to the general region or a preexisting set of goals. Examples of how the TOD indicators can be used to evaluate regions, transit agencies, and local land use authorities is given in Appendix B. II. METHODOLOGY The methodology used in this study began with a review of the literature on TOD , followed by an evaluation of seven metropolitan study areas currently using or considering TOD as part of an FTA New Starts funding proposal. From the literature and interviews we developed a working definition of TOD and identified the most important elements that it should capture. We also began the process of developing a baseline evaluation of TOD plans and one or more TOD sites in each of seven case study regions. Literature Review: Defining TOD Cervero et al. characterize TOD as compact, mixed-use development near transit facilities with high-quality walking environments.5 However, TOD is not well-defined as it relates to specific projects, mainly because development that would be considered dense, pedestrian-friendly, and transit supportive in some places would be viewed quite differently in others. Mobility-Based Definitions TOD projects are thought to generate five primary mobility benefits, four of which are derived from locating development adjacent to transit stations. First, they increase transit ridership and farebox revenues.6 Second, by increasing transit use, they reduce the number of automobile trips generated from new development and thus curtail additional congestion, pollution, and resource 5 Cervero 2004. 6 Cervero 1994.
- 10. Benchmarking Transit-Oriented Development 4 consumption.7 Third, they create housing and employment options that substantially improve accessibility to transit,8 particularly for those who are transit dependent, people who are more likely to be low-income, disabled, or elderly. Fourth, they eliminate automobile trips to the transit station by creating walkable and bikeable environments.9 The fifth transportation benefit generated from TOD projects is the elimination of some vehicle trips altogether, because of the high percentage of trips that remain within the TOD area. Research indicates that by incorporating mixed uses into the plans for the TOD area10 and by providing an unobstructed and pleasant streetscape,11 workers and residents of TODs choose to walk or bicycle to commercial establishments or public facilities in the area instead of driving, at least for some trips. For example, perhaps 30 percent or more of shopping and personal-business trips have been found to remain internal to the TOD area. Performance-Based Definitions TOD has been defined by elements, such as transit service, mixed-income housing options, and streetscape improvements, and also goals, such as increased transit ridership, congestion reduction, and improved air quality. Those who advocate for defining TOD based on goals suggest creating a framework that can be used for planning and analysis of projects with a focus on the desired functional outcomes of TOD, not just physical characteristics. By focusing on outcomes, better benchmarks of success are created, and better measures of the tradeoffs involved in TOD projects are identified. Autler and Belzer define six performance criteria that can be used to evaluate project function and outcomes12 : (1) Location efficiency (2) Value recapture (3) Livability (4) Financial return (5) Choice (6) Efficient regional land-use patterns It is notable that the criteria focus heavily on the characteristics of the land uses in the TOD and surprising that more emphasis has not been placed on transit ridership or transit level of service characteristics. Multi-Station Corridor and Regional Definitions While most TOD definitions envision a transit “village” or district with a broad range of land uses, the TOD concept also can be expanded and applied to the corridor level.13 Development focused around transit corridors need not be mixed-use in the area around a specific transit station, but rather a mix of (specialized) uses can be provided along an entire corridor, with the 7 Arrington 2002. 8 Cervero 2004. 9 Cervero 2001. 10 Cervero 2004. 11 Schlossberg 2004. 12 Autler 2002. 13 Arrington 2002.
- 11. Benchmarking Transit-Oriented Development 5 resulting transportation benefits emerging from the combination of opportunities along the corridor. For example, development at some stations could be primarily office-focused, others predominantly retail, others housing. This conception of TOD allows for both economies of scale and specialization of place, while allowing transit to be a major means of travel from place to place. The corridor-level TOD approach presents a challenge to regional planners, however, who must coordinate these land uses over many different local jurisdictions. TOD also can be examined from a regional perspective, with an emphasis on connectivity and level of service. Regional TOD analysis provides a macro-level view of the impact of joint transportation and land use initiatives. In order to influence regional travel behavior, transit lines that serve TODs must be integrated into a large transit network with a high level of service at both peak and off-peak times. The network must be well connected and provide access to key locations (trip generators) around the region.14 Organization-Specific Definitions Regardless of whether TOD is characterized by physical attributes or desired outcomes, there is substantial agreement on four basic elements: high densities, transit orientation, walkability, and mixed uses. Beyond these four elements, however, there are disparate views of exactly what defines TOD. Public and private agencies and organizations tend to define TOD based on their own perspectives. For example, the Center for Transit Oriented Development (CTOD), created to facilitate the use of TOD as a nationally recognized real estate product, considers housing choice a key element. However, the Washington Metropolitan Area Transit Authority (WMATA), the predominant transit operator in the nation’s capital region, emphasizes the creation of “special places” around transit stations. WMATA is the transit operator to several successful TOD projects. At a state level, the TOD policy of the California Department of Transportation (Caltrans) states that although projects should be designed to encourage pedestrian and transit use, they should not be designed to exclude automobile access.15 Case Studies Seven regions/cities were selected as case studies for developing the benchmarks: • Baltimore • Portland • Phoenix • San Diego • Charlotte • Minneapolis • Sacramento The regions were chosen principally because all had FTA-funded New Starts projects that are currently in operation or under construction. These regions also were selected because they represent a range of TOD projects and transit-supportive policies that are both already in place 14 Cervero 2004. 15 Arrington 2002.
- 12. Benchmarking Transit-Oriented Development 6 and are planned for near future. The sample of regions includes a broad range of urban development patterns, growth trajectories, transit service levels, and traveler characteristics. Another criterion in choosing the study regions was the participation of the area in FTA- sponsored regional discussion groups designed to address issues pertaining to TOD. The transcripts from the FTA discussion groups provided a starting point from which investigators were able to extract key regional and local TOD issues. After the case study selection, we collected data on regional and New Start corridor characteristics, changes over time, and plans. Most data were gathered from online resources. Plans at the regional, local, transit agency, and specific corridor and station-area levels were examined. Additional policies and zoning that affected density, the pedestrian environment, and mobility also were studied and assessed as to their impacts on TOD. Data from the U.S. Census, gathered at both the American Factfinder and at the Bureau of Transportation Statistics (BTS) web sites, provided much of the demographic and travel behavior information used for the initial analysis of the study regions. We used 1990 as well as 2000 data, to begin a longitudinal analysis. Transit operation characteristics for the regions were obtained from the Federal Transit Administration’s National Transit Database. Roadway extent, characteristics, and performance information were taken from the Federal Highway Administration’s Highway Statistics web site. Finally, the Texas Transportation Institute’s 2005 Urban Mobility Study was used to assess the growth of traffic congestion and delay during the period from 1993 to 2003. Interviews Interviews were conducted with approximately 40 stakeholders, which included a diverse range of interests, including regional agencies, local agencies , transit agencies, redevelopment agencies, developers, and various special districts. An interview questionnaire was developed to help stakeholders provide a well-rounded sense of the current environment for TOD within each region. Interviewees were assured anonymity in order to encourage an unvarnished assessment of what was or was not happening in the region to support TOD. The questions were designed to address a range of issues relevant to TOD, from market studies and planning to implementation and post-occupancy. The questions addressed how TOD was being formulated in the region and what was the response. The interviews also investigated the challenges and opportunities in promoting TOD and how any results of TOD were tracked. Other questions covered governmental support and policies, inter-agency relations, as well as public outreach and education efforts. The interviews were conducted by a team of two or three University of California Transportation Center researchers and were approximately 90 minutes in length. Four to six on- site interviews, each representing one of the stakeholders noted above, were conducted for each region. Follow-up contacts were made as needed by phone and e-mail. Site Visits In tandem with the on-site interviews, site visits were conducted within each case study region. Focusing specifically on current and prospective TOD sites along New Starts Project facilities, visits also included other TOD examples, as well as central business districts and other major destinations served by transit. Some locations visited included sites specifically recommended by those interviewed as being the best examples of TOD in the region. The main purpose of these
- 13. Benchmarking Transit-Oriented Development 7 visits was to ascertain whether the level of density and the provision of amenities and connectivity were conducive to TOD. Another goal was to examine whether there was congruency between what was on the ground and the perceptions stated in stakeholder interviews. III. CRITERIA FOR SELECTING BENCHMARKS AND INDICATORS The literature review, initial regional examinations, interviews, and site visits provided the foundation for selecting the benchmarks and their associated indicators. This process clarified what kinds of information relevant to TOD were easy to obtain in different regions, and what kinds of information, though valuable, were inconsistently available. For example, most regions had some kind of regional transit plan that at a minimum outlined their expected service levels and ridership objectives. In contrast, only some regions or transit operators had recent travel surveys from which travel behavior could be assessed. Building permit data, despite its potential value as a measure of growth and market demand in a given area, was readily available in some jurisdictions, organized differently across different jurisdictions in many areas, and in other jurisdictions it was difficult to obtain at all. Initially, it was necessary to prioritize what characteristics would best represent the goals of successful TOD. Ensuring that the benchmarks and corresponding indicators for evaluating TOD would be successful in practice depended upon two criteria. The first criterion was that the data be easily accessible from reliable data sources, such as the decennial Census and other national data sets. The second criterion was that the benchmarks be easily replicated and analyzed over time and space. While we left open the possibility that some regions, transit operators, and cities would be able to provide far more detailed and sophisticated data, we wanted to identify a basic set of benchmarks that any city or region could be required to use. Identifying the Six Benchmarks The literature and initial data gathering revealed six benchmarks by which TOD performance could be assessed most effectively. These were: (1) Transit usage and reduced auto dependence (2) Land use, density, and growth (3) Access to transit (4) Equity (5) TOD market factors (6) Institutional and political context Each benchmark is designed to be evaluated by a set of specific indicators of performance in that area. Some of these indicators, such as population growth and density, could be drawn directly from the regional background data gathered. Other, more subtle measures, such as access to transit and institutional support, would require a qualitative approach, and could be further informed by the stakeholder interviews and site visits.
- 14. Benchmarking Transit-Oriented Development 8 IV. QUANTITATIVE AND QUALITATIVE ELEMENTS The selection criteria produced a set of 22 quantitative and 26 qualitative indicators to support the six benchmark categories. The different approaches to quantitative and qualitative benchmarks are described below. Quantitative Approach The 22 quantitative indicators (see Table 1), are all available from common online data sources: the decennial Census, the Bureau of Transportation Statistics’ Census Transportation Planning Package (CTPP), the Federal Highway Administration’s Highway Statistics, and the Federal Transit Administration’s National Transit Database. The quantitative indicators are analyzed in one of two ways: either as an index, where one data point is compared to another such as by a ratio; or as a threshold, whereby a data point is analyzed as being either above, at, or below a certain level defined for that indicator. Analyzing Different Geographic Scales with the Quantitative Indicators The quantitative indicators are suitable for analyzing objective measures such as growth, density, demographics, transit share and ridership, and auto ownership and usage, and allow for specific figures to be compared over time. Most indicators can also be compared across a variety of different geographies within the study area: regional, urban, suburban, all stations along a corridor, or individual station areas. Corridor-level and station-area analyses use Geographic Information Systems (GIS) and Census data to analyze block groups and tracts within a specified radius of transit stations. This study focused on the area within a half-mile of stations, but other distances, such as a quarter-mile or one mile, can be analyzed as desired. Many indicators, particularly those drawn from Census-based data, can assess data at multiple geographic levels. For example, housing density can be examined for a whole region (MSA), a single city, all suburban areas within a region, all stations along a corridor, or a single station area. The geographies selected in Table 1 show the levels of geographic analysis we recommend to best understand and analyze TOD within a region.
- 15. Benchmarking Transit-Oriented Development 9 Table 1. Quantitative Indicators by Benchmark and Their Sources. Geographies Analyzed Benchmark No. Issue Addressed Measure Indicator Type Region Urban Transit Stations (1/2 mi.) Suburban Transit Stations (1/2 mi.) Data Source 1A Do areas in the city (or suburbs) near transit show higher transit mode share than elsewhere in the city (or suburbs)? Transit Mode Share Census 1B Does transit contribute a significant portion of work trips to the CBD? Transit Mode Share to CBD CTPP 1C Is transit mode share increasing in both the city and the suburbs? Change in Transit Mode Share Census 2 Is the percent increase in transit ridership for a given period greater than the national average? Transit Demand FTA 3 Is the percent increase in off-peak transit ridership for a given period greater than the national average? Percent Change in Off-Peak Transit Ridership FTA 4 Do people who live near transit have fewer vehicles per household than those who live elsewhere in the city (or suburbs)? Household Vehicle Density Census 5 Are a higher proportion of housing units near transit car-free than elsewhere in the city (or suburbs)? Percent of Housing Units That Are Car- Free Census Transit Usage and Reduced Auto Dependence 6 Is annual VMT per capita decreasing? Change in Average Daily VMT per Person FHWA 7 Is population growing faster in the city than in the suburbs? Percent Change in Population Census 8 Is housing supply growing faster in the city than in the suburbs? Percent Change in Housing Units Census 9 Is employment growth in the city remaining competitive with employment growth in the suburbs? Percent Change in Employment CTPP 10A Is housing density above a transit-supportive threshold? Housing Density Census 11A Is employment density above a transit-supportive threshold? Employment Density Census 10B Is housing density increasing at a greater rate around transit than elsewhere in the city? Change in Housing Density Census Land Use, Density and Growth 11B Is the change in employment density in the city (a) positive and (b) greater than in the suburbs? Change in Employment Density CTPP 22 To what extent are people with disabilities being served by transit? Disabilities in Population Census 23 To what extent are older people being served by transit? Proportion of Population That Is Elderly Census 24 To what extent are minorities being served by transit? Non-Minority Population Census 25A To what extent are lower-income households being served by transit? Average Household Income Census Equity 25B Does transit serve regional concentrations of poverty? Poverty Concentration Mapping Census 27 Is the percent change in annual vehicle revenue hours greater than the national average for the same mode for the same period? Transit Service Supply FTA TOD Market Factors 28 Is the percent change in annual unlinked passenger trips per annual vehicle revenue hour positive? Transit Service Effectiveness FTA Legend Quantitative Measure: Threshold Quantitative Measure: Index
- 16. Benchmarking Transit-Oriented Development 10 Qualitative Approach While many measures of TOD success lend themselves well to quantitative analysis, many other factors are better examined qualitatively, as many are related to assessments of specific policies or issues at a local or regional level. The 26 qualitative indicators are presented in the form of a questionnaire (provided in Appendix A) to evaluate how a region or jurisdiction meets certain TOD objectives relating to five of the six benchmarks (see Table 2). (The benchmark of transit use and reduced auto dependence is not assessed qualitatively since its indicators are all quantitatively based.) We suggest a simple scoring function for evaluating a jurisdiction’s performance, coupled with a written description or narrative. Jurisdictions may score a 0 if the benchmark objectives are not being met at all, a 1 if objectives have been identified but their implementation is vague or faces barriers, or a 2 if objectives have been identified and demonstrably acted upon. Scores can be averaged across all 26 indicators to provide general overview, or if desired they can be weighted toward a specific focus, such as accessibility. The narrative should be an easily readable evaluation of performance on each measure.
- 17. Benchmarking Transit-Oriented Development 11 Table 2. Qualitative Indicators by Benchmark and Their Sources. Geographies Analyzed Benchmark No. Issue Addressed Region Local Land Use Authorities Data Source 12 Does the region have a TOD plan specifically addressing station areas? Regional Planning Documents 13 Do zoning regulations exist which require minimum densities of at least 20 du/acre near transit stations? Local ZO 14 Do zoning regulations include parking maximums not exceeding one per dwelling unit? Local ZO Land Use, Density and Growth 15 Do zoning regulations allow for mixed use by right? Local ZO 16 Is parking is provided at a limited number of stations, generally near the end of line? MPO/ Transit Operator Plans 17 Are station area parking fees priced to cover costs? MPO/ Transit Operator Plans 18 Do existing regulations require sidewalks and pedestrian paths in new developments? Local ZO 19 Do existing regulations require bike paths in new developments? Local ZO 20 Does the street design along the transit corridor enable pedestrian traffic? Orthophotography/ site visits Access to Transit 21 Are pedestrian-friendly amenities such as benches, lighting, street trees and trash cans ubiquitous around station areas? Orthophotography/ site visits Equity 26 Are there public programs to facilitate the creation of affordable housing units in transit station areas? MPO/Local Authorities 27 Are all station areas served by fast, frequent transit service to major destinations? Transit Operator 30 Is public funding for TOD available throughout the region? MPO/ Local Authorities 31 Is there a high level of developer interest in development around station areas? Local Planning Officials 32 Do market studies compiled by government agencies show the high demand for TOD? MPO/ Local Authorities 33 Do development incentives exist to promote TOD? MPO/ Local Authorities 34 Are joint development opportunities used to promote TOD? MPO/ Transit Operator/ Local Authorities 35 Are staff responsible for generating interest in TOD and assisting developers? MPO/ Local Authorities TOD Market Factors 36 Are zoning codes available on the Internet? Local ZO 37 Does the region have an integrated transit and land use plan? MPO 38 Do all jurisdictions with land use authority that are served by transit have an enacted transit and land use plan? Local Planning Documents 39 Do most of stations have station-area plans to guide development in a TOD supportive manner? Local Planning Documents 40 Is there a systematic method in place for tracking the implementation of TOD plans? Local Planning Documents 41 Does the political environment in the region favor the expansion of transit and the development of TOD zones? MPO/ Local Authorities 42 Have efforts been made to develop community support for transit supportive intensities and styles of development? MPO/ Local Authorities Institutional/ Political Context 43 Is the region free of institutional barriers to TOD, and has community opposition to TOD been limited or unorganized? MPO/ Local Authorities
- 18. Benchmarking Transit-Oriented Development 12 V. BENCHMARK OVERVIEW AND RATIONALE The following sections explain the specific indicators related to the six benchmarks, how they measure what they measure, and what the results might say about TOD in a region. This section is organized by benchmark and describes both the quantitative and qualitative indicators that support each benchmark. Benchmark 1: Transit Usage and Reduced Auto Dependence In many regions, a major goal of TOD is to reduce dependence on the private automobile by providing people with convenient transportation alternatives and creating the circumstances that will encourage them to use the alternatives. This set of indicators provides an essential set of measurements as to whether TOD is an effective means of curbing driving and increasing transit usage. Transit Use Transit mode share is a straightforward indicator of whether development around transit stations presents an attractive alternative to driving. These indicators use Census journey-to-work data and CTPP Part 2 (Place of Work) data to answer these questions: (1A) Do areas in the city (or suburbs) near transit show higher transit mode share than elsewhere in the city (or suburbs)? (1B) Does transit contribute a significant portion of work trips to the CBD? (1C) Is transit mode share increasing in both the city and the suburbs? Analyzing mode share for block groups near stations should indicate a higher proportion of people who live and work near transit stations using transit. Furthermore, areas near transit stations should show a growing number of transit commuters if TOD is to be considered successful in terms of generating ridership. However, one potential drawback of this approach to analyzing transit ridership at the station-area or even corridor level is that it may not reflect the true nature of how TOD generates trips across all modes and trip purposes. Because vibrant, walkable, mixed-use communities are often the goal of TOD, over time many potential transit trips could be replaced by walking and bicycle trips if people have the opportunity to live within walking distance to where they work. On-site trip capture is a frequently cited benefit of TOD in terms of reducing automobile trips, but it has the potential to eliminate the need for transit trips as well. In addition to transit mode share indicators, two other important transit-use indicators draw from National Transit Database statistics to analyze transit service supply, service demand, and service effectiveness at the regional level. These are: (2) Is the percent increase in transit ridership for a given period greater than the national average?
- 19. Benchmarking Transit-Oriented Development 13 (3) Is the percent increase in off-peak transit ridership for a given period greater than the national average? Transit service indicators should show increasing demand for both peak and off-peak trips. Flat or diminishing transit demand may have one or a combination of several causes. Causes might be that development near transit has not been effective as a means of generating new ridership, or that the transit service provided is not a sufficiently attractive alternative to driving, either because service quality is poor or because automobile congestion is not a major factor in the region. It also may be the case that the transit services are capturing an increased share of work trips but a declining share of total trips, which in turn is likely to be related to the quality of off- peak service, or the price and travel time for off-peak trips on transit compared to driving. Auto Use and Reduced Auto Dependence Reducing automobile use and dependence is an important goal of TOD, and can be a mainstay of political support for TOD in areas facing growing congestion and sprawl. The following indicators can be analyzed for block groups surrounding transit stations to determine whether proximity to transit is affecting vehicle ownership habits: (4) Do people who live near transit have fewer vehicles per household (lower vehicle density) than those who live elsewhere in the city (or suburbs)? (5) Are a higher proportion of housing units near transit car-free than elsewhere in the city (or suburbs)? Because vehicle ownership is affected by other important factors such as broader-scale land use patterns and income, it is useful to compare vehicle ownership in urban station areas with the city as a whole, and suburban station areas with the region’s suburbs as a whole. Ideally, TOD areas should demonstrate a reduction in vehicle density, and some increase in the percentage of car-free housing units. In general, vehicle density rates diminish with factors such as increased housing opportunities near transit, increased transit service quality, and station-area zoning regulations that limit residential parking provisions. However, if housing densities are increased near suburban transit stations without a decrease vehicle density, the result can be urban-style vehicle congestion near suburban stations, as illustrated in Table 2. Scenario A is an urban station area, with high housing density and low vehicle density that diminishes slightly over time. Scenario B is a low-density/low-growth scenario unlikely to produce much transit ridership over time. Scenarios C and D are suburban station areas with similarly increasing densities over time under different TOD strategies, where Scenario C has an accompanying decrease in vehicle density due to effective TOD planning and high-quality transit service, and Scenario D’s vehicle density stays at the national average due to zoning regulations that do not reduce parking requirements. Under Scenario D, there would be approximately 4,250 vehicles present in the half-mile radius of the transit station by 2020, which would produce automobile congestion comparable to the urban setting of Scenario A with 4,800 vehicles. Under Scenario C, which has the same increase in suburban housing density as Scenario D but with diminishing vehicle density, the aggregate number of vehicles located near the station would be 2,250 in 2020, about half that of Scenario
- 20. Benchmarking Transit-Oriented Development 14 D. These scenarios are purely hypothetical, but they underscore the importance of monitoring indicators of auto ownership near transit stations. Table 3. Hypothetical Impacts over Time of Vehicle Density Rates and Housing Growth within a Half-Mile of Transit Stations, in Terms of Total Vehicles. Scenario A: High-Density Urban Station Area Scenario B: Suburban Station Area, Low-Density, Low-Growth Scenario C: Suburban Station Area, Increasing Housing Density with Diminishing Vehicle Density Scenario D: Suburban Station Area, Increasing Housing Density with Flat Vehicle Density Year Avg Veh./ HU # of HUs Total Vehicles Avg Veh./ HU # of HUs Total Vehicles Avg Veh./ HU # of HUs Total Vehicles Avg Veh. / HU # of HUs Total Vehicles 1990 1.1 4,000 4,400 1.7 120 204 1.7 120 204 1.7 120 204 2000 1.0 4,500 4,500 1.7 250 425 1.4 300 420 1.7 300 510 2010 0.9 5,500 4,950 1.7 350 595 1.2 1,000 1,200 1.7 1,000 1,700 2020 0.8 6,000 4,800 1.7 500 850 0.9 2,500 2,250 1.7 2,500 4,250 Net Increase in Total Vehicles, 1990-2020 400 646 2,046 4,046 At the regional level, the following indicator measures the total effects of driving in the region: (6) Is annual VMT per capita decreasing? Considering larger factors that affect how much people drive, such as the overall economic health of a region, TOD is unlikely to influence these indicators on its own — especially if transit and TOD is only available in a tiny portion of the region. Vehicle miles of travel (VMT) per capita can also be an indicator of sprawl in a region. A region pursuing smart growth, congestion management, or clean-air objectives may use this indicator as a baseline to analyze whether regional transportation and land use planning are effective in curtailing vehicle miles traveled or at least diminishing its annual rate of increase. Benchmark 2: Land Use, Density, and Growth This set of indicators represents a fundamental core of how impacts of TOD and planning on development outcomes in a region and near transit stations can be better analyzed and understood. Targeting Growth This set of indicators measures at the regional level whether population, housing, and employment growth is being targeted toward the urban core, or whether growth is sprawling out into the suburbs. Using ten-year intervals from the Census, they compare growth rates in the urban core with growth rates in the suburbs to create a comparative index that addresses the following questions: (7) Is population growing faster in the city than in the suburbs? (8) Is housing supply growing faster in the city than in the suburbs?
- 21. Benchmarking Transit-Oriented Development 15 (9) Is employment growth in the city remaining competitive with employment growth in the suburbs? Regions that accommodate growth by allowing it to sprawling into suburban and exurban areas are less likely to be able to sustain markets for higher-density TOD, especially in greenfield areas. Density Many recent transit projects have gone to areas developed or zoned at densities lower than those that can support major transit investments. Hence, density is an important indicator both to help predict ridership and to determine whether transit service is reaching the areas it might serve most effectively. These indicators use Census data to measure the following densities for block groups within a half-mile radius around transit stations: (10A) Is housing density above a transit-supportive threshold? (11A) Is employment density above a transit-supportive threshold? A major issue in the planning of TOD is the sufficient generation of ridership for transit at these sites. The level of density within the walking distance is a critical factor at those TOD station areas that provide the residential opportunities along any transit corridor. Establishing new density levels can also be a source of local controversy. Despite this fact, setting transit- appropriate density levels for TOD is essential to its success. Determining what constitutes a transit-supportive density threshold is seldom simple or straightforward, but one effective tool for arriving at transit-supportive density thresholds is FTA’s cost-effectiveness guidance measuring new transit investments in terms of cost per new trip served. Even though FTA has since changed its cost-effectiveness rating system to measure time savings, analyzing costs in terms of new ridership generation is helpful in assessing transit-supportive densities for TOD. Tables 4A and 4B illustrate the residential ridership potential of TOD within a quarter- mile (Table 4A) and half-mile (Table 4B) of transit stations over a variety of densities. Table 4A assumes that in the 125 acres lying within one-quarter mile of a station area, there would be a maximum 40 percent allocation of the land to residential use, an average of 1.5 commuters per residence, and a 40 percent mode share for transit. Table 4B makes similar assumptions over a 500-acres area within one-half a mile of a transit, except 60 percent of the land has been allocated to residential use. These ridership figures are much larger than can be expected in real- world circumstances, with residential land allocation, average number of commuters per unit, and transit mode share all being set at very optimistic thresholds. Nonetheless, even under these optimistic assumptions the ridership generated is not adequate to support a typical light-rail transit investment until densities approach 20 units per acre within a half-mile radius.
- 22. Benchmarking Transit-Oriented Development 16 Table 4A. Yield of Riders from Housing at a Range of Densities within a Quarter-Mile of Transit, Assuming 30 Percent of the Approximately 125-Acre Area is Residential. Housing Units/Acre Acres Within 1/4 Mile of Station % of Net Land Given to Housing Total Housing Units Total Commuters at Average 1.3 per Unit Number of Transit Riders at 20% Mode Share Number of Transit Riders at 40% Mode Share 5 125 30% 188 244 49 98 10 125 30% 375 488 98 195 15 125 30% 563 731 146 293 20 125 30% 750 975 195 390 30 125 30% 1,125 1,463 293 585 40 125 30% 1,500 1,950 390 780 50 125 30% 1,875 2,438 488 975 60 125 30% 2,250 2,925 585 1,170 Table 4B. Yield of Riders from Housing at a Range of Densities within a Half-Mile of Transit, Assuming 50 Percent of the Approximately 500-Acre Area is Residential. Housing Units/Acre Acres Within 1/2 Mile of Station % of Net Land Given to Housing Total Housing Units Total Commuters at Average 1.3 per Unit Number of Transit Riders at 20% Mode Share Number of Transit Riders at 40% Mode Share 5 500 50% 1,250 1,625 325 650 10 500 50% 2,500 3,250 650 1,300 15 500 50% 3,750 4,875 975 1,950 20 500 50% 5,000 6,500 1,300 2,600 30 500 50% 7,500 9,750 1,950 3,900 40 500 50% 10,000 13,000 2,600 5,200 50 500 50% 12,500 16,250 3,250 6,500 60 500 50% 15,000 19,500 3,900 7,800 In order to arrive at the appropriate density thresholds, it is essential to analyze what the project costs are per new rider generated by the station(s). According to cost-effectiveness rating guidance from the FTA, the threshold breakpoints are given as follows in terms of cost per new trip served: Rating CE Threshold High $10.99 and under Medium-High $11.00 - $13.99 Medium $14.00 - $21.99 Medium-Low $22.00 - $27.99 Low $28.00 and over
- 23. Benchmarking Transit-Oriented Development 17 Successful TODs are those which generate sufficient ridership to support transit investments. For example, suppose a station cost $250 million to build and operate over 30 years. The area around it was developed as described in Table 4B at 10 units per acre in the half-mile radius to generate 1,300 transit trips per workday (assuming an optimistic 40 percent mode share), or 338,000 work trips per year, for a total of 10.14 million trips over 30 years. The total station cost divided by the total number of trips results in an average of $24.65 per new trip, which is within the medium-low threshold. Suppose instead that the station were developed at 30 units per acre given all the same circumstances. This station would generate 30.42 million trips over 30 years, for an average of $8.22 per trip served, well within the high rating for cost-effectiveness. These density indicators can therefore help set goals and track progress toward ridership generation from TODs. In addition to looking at current density thresholds, it is helpful to examine changes in density over time. The following indicators measure changes in density for block groups within a half-mile radius of transit stations to determine: (10B) Is housing density increasing at a greater rate around transit than elsewhere in the city (or suburbs)? In order to analyze density changes, an index is created to compare density changes in city station areas with the city as a whole, and density changes in suburban station areas to the suburbs as a whole. Areas near transit should show higher positive changes in density than for the city or suburbs as a whole. Changes in employment density trends in the region are also an important factor in generating transit ridership. In many regions, employment is decentralizing from the urban core to low-density greenfield sites which are difficult to serve effectively with transit. On the other hand, regions where employment primacy remains in the urban core are more likely to be able to serve region-wide work trips by transit. Thus the employment density change indicator assesses two aspects of employment density change over time from a regional perspective: (11B) Is the change in employment density in the city (a) positive and (b) greater than in the suburbs? In order to analyze this indicator an index is generated that compares the change in employment density in the city with the change in employment density in the suburbs. Transit-Supportive Land Use When multiple jurisdictions have transit stations across a regional system, each jurisdiction should demonstrate a commitment to supporting regional transit objectives through local land use policies designed to increase densities, allow mixed use, and limit parking in TODs. Some regions may devise regional TOD plans, but in most cases it is individual jurisdictions that must ensure that transit-supportive development characteristics are integrated into their local zoning ordinances. These characteristics include establishing minimum densities, establishing parking maximums, and allowing for mixed uses by right near transit stations. The following indicators capture whether local land uses are transit-supportive: (12) Does the region have a TOD plan specifically addressing station areas?
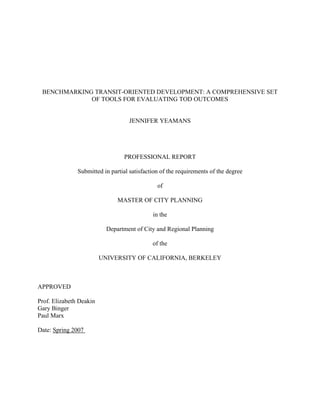
- 24. Benchmarking Transit-Oriented Development 18 (13) Do zoning regulations exist which require minimum densities of at least 20 du/acre near transit stations? (14) Do zoning regulations include parking maximums not exceeding one per dwelling unit? (15) Do zoning regulations allow for mixed use by right (i.e. not as a conditional use)? Benchmark 3: Access to Transit Accessibility is a vital element of successful TOD. A principal goal of connecting development and transit with TOD is to reduce automobile trips. However, these benefits can be undermined by a lack of pedestrian and bicycle amenities within TODs, especially if automobile access is prioritized over other modes by the provision of excessive parking or parking that is priced below market rate. Without adequate infrastructure and competitive pricing for non-automobile travel, people may be more likely to drive their cars to nearby destinations instead of walking, biking, or taking transit. In TODs with parking provided, adequate pedestrian and bicycle infrastructure is essential to keeping the area around the station safe and appealing for all transportation modes. Indicators that analyze the nature of automobile access to stations include the following questions: (16) Is parking is provided at a limited number of stations, generally near the end of line? (17) Are station area parking fees priced to cover costs? Indicators that analyze the quality and extent of bicycle and pedestrian infrastructure include the following questions: (18) Do existing regulations require sidewalks and pedestrian paths in new developments? (19) Do existing regulations require bike paths in new developments? (20) Does the street design along the transit corridor enable pedestrian traffic? (21) Are pedestrian-friendly amenities such as benches, lighting, street trees and trash cans ubiquitous around station areas? In evaluating TOD for these indicators, special attention should be paid to the barriers that rail lines and parking facilities can create. It is generally accepted practice to view the area within one-half mile (2,640 feet), or roughly a 10-minute walk, to be the area available for TOD. Therefore, station access within that half-mile radius plays a critical role in how well the station functions in delivering high ridership. Fences, irregular street patterns, and insufficient rail crossings can significantly lengthen pedestrian access routes to the station, thereby causing developments within a half-mile radius to not be within the 10-minute walking shed. In the
- 25. Benchmarking Transit-Oriented Development 19 example illustrated in Figure 1, a relatively short journey of 300 feet from a dense housing development east of a transit station platform is blocked by a long wall and lack of track crossings. On the ground, the actual pedestrian route to the station platform is 4,085 feet, more than three quarters of a mile and13 times longer than the optimal route. This scenario and others similar to it were found at numerous station areas within our study regions. Often there is a trade- off between acquiring inexpensive rights of way and developing transit corridors that are truly accessible. FIGURE 1 Barriers to access at a light rail station in California. Residents of housing adjacent to the station platform must walk more than three-quarters of a mile to get there. (Source: UCTC illustration based on Google Earth orthophoto.) Benchmark 4: Equity TOD often introduces new housing and transportation choices to an area. As part of a smart growth strategy, demographic characteristics of growth around transit should echo regional trends. The following indicators are a check to ensure that the opportunities presented by developing near transit are equitably distributed in the population, particularly among those who cannot or prefer not to drive a car:
- 26. Benchmarking Transit-Oriented Development 20 (22) To what extent are people with disabilities being served by transit? (23) To what extent are older people being served by transit? (24) To what extent are minorities being served by transit? (25A) To what extent are lower-income households being served by transit? (25B) Does transit serve regional concentrations of poverty? (26) Are there public programs to facilitate the creation of affordable housing units in transit station areas? Comparing demographic characteristics of block groups within a half-mile of transit with overall city, suburban, and regional trends can inform planners in a variety of ways: a growing senior population may suggest an expanding potential market for transit and TOD, particularly for off-peak trips. Rising white/non-Latino populations may reflect gentrification in transit-rich neighborhoods. Areas near transit with incomes lagging behind city and suburban averages may suggest a need for more affordable housing as a component of TOD. There is no clear method of defining equity. Just as every region is different and reflects different stages of its TOD development, equity issues that arise also may be different. For example, an area with rapidly rising housing costs might address equity by increasing the availability of affordable housing units in TODs. Other regions might have a high proportion of transit-dependent residents, such as low-income, elderly, or disabled individuals. These areas might prioritize making transit more accessible to these populations. Benchmark 5: TOD Market Factors A frequent argument for TOD is that it is a cost-effective solution for generating transit ridership and meeting demand in under-served housing markets. TOD has the potential to increase ridership and thereby reduce costs per rider, but it can only do so if the regional market factors support TOD and justify its development. The TOD market factor indicators evaluate TOD performance from both transit supply perspective (demand for development near transit hinges in part on the quality of transit service supplied to the station area) and the development demand perspective. Transit Service Supply and Effectiveness Service effectiveness can indicate how cost-effective transit is, while service supply is an overall indicator of service quality that is often a critical factor in how strong the market for “choice” riders — that is, most potential residents of TOD — will be in a region. Moreover, one qualitative indicator evaluates whether growth patterns influence transit service and investment decisions, or whether transit simply goes where it is easiest or cheapest to send it. The following indicators measure transit supply and effectiveness as a change over time:
- 27. Benchmarking Transit-Oriented Development 21 (27) Is the percent change in annual vehicle revenue hours greater than the national average for the same mode for the same period? (28) Is the percent change in annual unlinked passenger trips per annual vehicle revenue hour positive? (29) Are all station areas served by fast, frequent transit service to major destinations? Regions with diminishing transit supply — particularly if service cuts accompany fare increases that negatively impact demand — may indicate systemic transit problems greater than TOD can solve. Funding Availability In many regions there are specific public funding programs to encourage compact, walkable forms of development, whose funds can be applied toward TOD. This indicator assesses: (30) Is public funding for TOD available throughout the region? Regions may have funding programs that include local matching funds for streetscape or rail station improvements that encourage non-motorized forms of transportation. For example, in the San Francisco Bay Area, the Metropolitan Transportation Commission funds such projects through its Transportation for Livable Communities program. The Minneapolis–St. Paul region’s Metro Council has a similar program established by the Minnesota Legislature. Such funding can be instrumental in helping to generate markets for TOD in areas where such development has not existed previously, and in developing local TOD project models that can then be adapted and implemented in other areas. Development Market TOD is unlikely to succeed, or even be built, in regions where there is no market for it or where regulatory barriers are prohibitive. Market studies must present that demand for such development exists. Since most market studies are short-range, it makes sense to monitor markets over time as conditions may be unsupportive in one time period but supportive in another. Analyzing local and regional outreach to developers is essential in helping understand likely outcomes for TOD projects. In regions where TOD is a relatively new concept, developer interest, success, and support is key to encouraging more such development in the future. Planning staff dedicated to promoting TOD and innovative programs such as joint development agreements are important elements to getting TOD off the ground. Indicators that evaluate the level of developer outreach and support include: (31) Is there a high level of developer interest in development around station areas? (32) Do market studies compiled by government agencies show the high demand for TOD?
- 28. Benchmarking Transit-Oriented Development 22 (33) Do development incentives exist to promote TOD? (34) Are joint development opportunities used to promote TOD? (35) Are staff responsible for generating interest in TOD and assisting developers? (36) Are zoning codes available on the Internet? Success in these areas means that local and regional planning staff are aware of and promote the benefits of TOD, that information valuable to developers is readily available, and that a variety of developer-supportive programs are in place to help establish the viability of TOD. While developer outreach and particularly market studies are valuable tools in determining whether development near transit will be cost effective, a downside is that market studies have limited utility and a short shelf-life. Changes in station-area or transit service plans might invalidate a study. Moreover, markets are volatile; even if a concept plan for office space and high-rise condominiums is adopted, by the time development plans are ready to proceed market demand may have shifted to retail and townhouses. Benchmark 6: Institutional and Political Context Some TODs have succeeded despite weak policies and institutional support; others have foundered despite strong policies and support. Overall, however, this benchmark presumes that a TOD-supportive institutional framework — that is, policies that are integrated both vertically along many levels of decision making as well as horizontally across many jurisdictions in a region — is a better predictor of likely TOD success in a region. Outreach to the public to build support for TOD, as well a political environment supportive of transit and TOD, are also important factors. Availability of knowledgeable planning staff to promote TOD is also a good measure of support for TOD. Integrated Policies Typically, transit planning is done by a transit agency with a regional perspective, while TOD is a local land use issue handled by a municipal or county authority. Coordinating the two to be mutually supportive is a challenge requiring transit-supportive land use policies at both the local and the regional level. A very direct method of integrating policies is through a regional government such as Portland’s METRO, which is responsible for both regional transportation and land use planning. In most metropolitan areas, however, regional transportation and land use planning are the responsibility of different entities. Such arrangements require careful coordination through the deliberate alignment of transportation and land use plans and policies across numerous institutions: the MPO, the regional transit provider, cities and counties, and any other relevant planning entities in the region. The institutional framework indicators evaluate regions and jurisdictions based on the following questions: (37) Does the region have an integrated transit and land use plan?
- 29. Benchmarking Transit-Oriented Development 23 (38) Do all jurisdictions with land use authority that are served by transit have an enacted transit and land use plan? (39) Do most of stations have station-area plans to guide development in a TOD supportive manner? (40) Is there a systematic method in place for tracking the implementation of TOD plans? Special attention should be paid to TOD plans and policies in outlying jurisdictions, which may be less likely than their urban or inner-suburb counterparts to allow for or implement transit-supportive densities. A major potential benefit of integrating local and regional transportation and land use policies is that the process of doing so can build public support for transit and transit-supportive land use policies. A preliminary policy integration process opens up beneficial dialogue among stakeholders long before development plans hit the ground. Stakeholders who have already engaged in long-range visioning are more likely to support transportation investments and the land use policies and future developments that will make them more effective. Political Environment and Public Perception Strong political and public support for TOD and transit-supportive land use policies are essential to local and regional success of TOD. In many regions where MPOs have scant regulatory authority, smart growth principles benefit from a vocal political champion. It is also important to have strong support for TOD among regional and local planning staff. Organized opposition to TOD or transit-supportive densities from politicians or community organizations should be analyzed closely, as should public outreach efforts to build community support for transit and TOD. Highly politicized regions where sweeping political changes are frequent or dramatic can put TOD-supportive policies and planning in jeopardy. The following questions were developed to evaluate the regional political environment and public perception of TOD: (41) Does the political environment in the region favor the expansion of transit and the development of TOD zones? (42) Have efforts been made to develop community support for transit supportive intensities and styles of development? (43) Is the region free of institutional barriers to TOD, and has community opposition to TOD been limited or unorganized? Scores for these indicators should demonstrate few significant barriers to TOD exist in a region. Moreover, if political or institutional barriers exist, these indicators will reveal whether there is a means to approach these barriers productively. VI. CONCLUSIONS A comprehensive set of TOD benchmarks and indicators can be useful to a variety of entities. Transit agencies could use them as part of their short-term transit improvement plans by better
- 30. Benchmarking Transit-Oriented Development 24 understanding network-level trends. MPOs could use them to track and communicate progress toward smart growth goals in a region. Local jurisdictions could use them to help maximize the potential of TOD locally. Community organizations and members of the public may use them to evaluate TOD proposals or as part of their advocacy efforts. Interviews indicated that different regions currently prioritize what aspects of TOD, if any, they wish to track, but this process can sometimes overlook certain other important considerations. Another benefit of a comprehensive set of benchmarks is that it can help regions or jurisdictions leverage potential benefits of TOD that might otherwise not have been prioritized or monitored. Limitations of the Benchmarks While the benchmarks and indicators are designed to be as comprehensive as possible, they do not take into account some important aspects of TOD. In most cases these aspects represent more complex issues than can be addressed by a set of indicators designed to be straightforward and easy to use. For example, the benchmarks do not capture the effects of orienting transit toward major trip generators beyond housing and employment. These might include sports stadiums, airports, college campuses, and the like. Many transit systems target such trip generators as an effective means of serving specific areas that otherwise would generate high demand for automobile trips. Another drawback of the benchmarks is that they do not evaluate the effects of predominant land uses around stations, or the mixing of uses. They do not measure whether there is an appropriate blend of housing, employment, and services at either the station-area or the corridor level, nor do they take into account whether there is an appropriate balance of daytime versus nighttime populations. Another limitation of the analysis stems from a lack of consistent access to fine-grained geographic data. Our analysis focused primarily on block group–level data to define station areas, because it was widely available and easy to use with the Census Summary File 3 data. Certainly data that is available at the Census block or TAZ level would produce a more precise analysis, but such analysis would also prove more time-consuming and therefore costly. These indicators are designed to be quick and easy to use with widely available data sets, and so we did not delve into these finer-grained geographies. Another complication with GIS analysis arises when barriers or the impediments to access are not present in the spatial data. In other words, what may be a quarter-mile walk as the crow flies may actually be a half-mile journey given physical barriers common to station areas. GIS will fail to capture these nuances of access if such barriers are not part of the data analyzed. Finally, the benchmarks do not provide guidance on how best to allocate access by different modes in TODs. Parking is a contentious issue that planners and stakeholders are often reticent to confront head-on; however, increasing densities in TODs without managing automobile access and parking can be a recipe for gridlock. Surrounding transit stations with traffic jams seems counterproductive. Future Research The benchmarks in their present form take advantage of data and technology that is currently widely available. However, as new technologies emerge, especially given the explosion in availability of geospatial information and technology, better, more precise indicators may
- 31. Benchmarking Transit-Oriented Development 25 become more widely available. Free software such as Google Earth can provide users a fairly current snapshot of land uses and parcel availability near transit stations, while user-created overlays can collect and disseminate a host of data sets relevant to TOD. Such information might then become freely available, unlike many current parcel-level data sets that are often proprietary and costly. These benchmarks do not address a fundamental question of what the purpose of TOD is. Is it to generate new and stable sources of transit ridership while reducing private automobile dependence? Or is its purpose to create vibrant, mixed use, walkable communities that eliminate the need for many motorized trips altogether, which would necessarily include both auto and transit trips? Future studies of TOD and its longer-range impacts should scrutinize these questions carefully.
- 32. Benchmarking Transit-Oriented Development 26 BIBLIOGRAPHY Arrington, G., T. Parker, M. McKeever, and J. Smith-Heimer. 2002. Statewide Transit-Oriented Development Study: Factors for Success in California. California Department of Transportation. Autler, G., and D. Belzer. 2002. Transit-Oriented Development: Moving from Rhetoric to Reality. Washington, D.C.: The Brookings Institution Center on Urban and Metropolitan Policy. Cervero, R., H. Lund, and R. Willson. 2004. Travel Characteristics of Transit-Focused Development in California. Bay Area Rapid Transit District and California Department of Transportation. Cervero, R. 1994. Transit-Based Housing in California: Evidence on Ridership Impacts. Transport Policy, Vol. 3: 174–183. Hoornweg, D., et al. 2006. “City Indicators: Now to Nanjing.” Paper presented by the World Bank. Vancouver, Canada: Third World Urban Forum. “Integrating Sustainability into the Transportation Planning Process.” 2005. Committee for the Conference on Introducing Sustainability into Surface Transportation. Washington, D.C.: Transportation Research Board. Lee, R., P. Wack, and E. Jud. 2003. Toward Sustainabile Transportation Indicators for California. Mineta Transportation Institute, College of Business, San Jose State University. Schlossberg, M., and N. Brown. 2004. Comparing Transit Oriented Developments Based on Walkability Indicators. Washington, DC: Transportation Research Board Conference.
- 33. Benchmarking Transit-Oriented Development: Appendix A A-1 APPENDIX A Qualitative TOD Benchmark Questionnaire for Local and Regional Authorities
- 34. Benchmarking Transit-Oriented Development: Appendix A A-2 Each answer has been assigned a point value; circle the appropriate score. Provide a brief explanation of the basis of your answer in the space below each question. Corresponding indicator numbers are given in [brackets] following each question. 1. Does the region have a plan specifically addressing station areas (areas within 1/2 mile of transit stations) that sets density, parking, and use standards? [12] Circle score Yes, there is an enacted plan that efficiently that clearly addresses station areas and sets density, parking, and use standards. 2 Yes, a plan has been drafted to address station areas but has not yet been adopted. 1 No, the region does not have a plan that specifically addresses station areas. 0 Specify plan name and date adopted. If the plan has not been adopted, provide a short explanation as to why it has not been adopted. 2. How is station area parking distributed? [16] Circle score Parking is provided at a limited number of stations, generally near the end of line. 2 Parking is provided in most of the suburban station areas. 1 Parking is provided at most stations in the system. 0 Specify percentage of stations with parking facilities and approximate total number of spaces.
- 35. Benchmarking Transit-Oriented Development: Appendix A A-3 3. Are station area parking fees priced to cover costs? [17] Circle score Yes, all parking is priced to cover the cost of construction and maintenance. 2 Yes, parking is priced to cover maintenance costs. 1 No, parking is provided at below cost. 0 Specify percentage of parking that is not free. 4. Are there public programs to assist developers with the creation of affordable housing units within transit station areas? [26] Circle score Yes, there are public programs to facilitate the creation of affordable housing units in transit station areas and they have been widely used. 2 Yes, there are public programs to facilitate the creation of affordable housing units in transit station areas, but to date they have not been widely used by developers 1 No, there are no public programs to facilitate the creation of affordable housing units in transit station areas 0 Please list policies and programs and date adopted.
- 36. Benchmarking Transit-Oriented Development: Appendix A A-4 5. Is public funding for TOD available throughout the region? [30] Circle score Yes, public funding for TOD is available from either a regional body or the majority of jurisdictions within the region. 2 Yes, public funding for TOD is available but not consistently throughout the region. 1 No, there is no public funding for TOD available. 0 Specify TOD funding programs and the jurisdictions which offer them. 6. Does the region have an integrated transit and land use plan? [37] Circle score Yes, there is an enacted transit and land use plan that efficiently builds upon and coordinates synergies between the public transit system and the land uses in the region. 2 Yes, an integrated transit and land use plan has been drafted has not yet been adopted. 1 No, the region does not have an integrated plan 0 Specify plan name and date adopted. If the plan has not been adopted, provide a short explanation as to why it has not been adopted.
- 37. Benchmarking Transit-Oriented Development: Appendix A A-5 Please duplicate questions 7 through 20 and provide answers for each jurisdiction that contains at least one New Starts station (or, alternatively, for each individual station area being analyzed). Jurisdiction or station area (specify): 7. Have specific zoning regulations addressing density been established in station areas (within 1/2 mi. of stations)? [13] Circle score Yes, zoning regulations exist which require minimum densities of at least 20 dwelling units per acre. 2 Yes, there are zoning regulations, but minimum densities are below 20 dwelling units per acre. 1 No, there are no designated zoning regulations that address density. 0 Specify minimum densities in the space below. 8. Have specific zoning regulations addressing parking been established in station areas? [14] Circle score Yes, zoning regulations include parking maximums not exceeding one per dwelling unit. 2 Yes, there are zoning regulations with parking maximums, but they exceed one per dwelling unit. 1 No, zoning regulations do not include parking maximums. 0 Specify parking maximums in space below, and list other programs, incentives, and/or policies used to limit parking (location efficient mortgages, shared parking, unbundled parking, etc.).
- 38. Benchmarking Transit-Oriented Development: Appendix A A-6 9. Have specific zoning regulations addressing mixed use been established in station areas? [15] Circle score Yes, zoning regulations allow for mixed use by right. 2 Yes, zoning regulations allow for mixed use as a conditional use. 1 No, mixed uses are not permitted. 0 Briefly describe regulations that encourage mixed use. 10. Do the existing regulations require sidewalks and pedestrian paths in new developments? [18] Circle score Yes, regulations require sidewalks in new development and include design standards that aim to make walking an efficient and enjoyable transportation option. 2 Yes, regulations do require sidewalks in new developments, but there are no design standards. 1 No, there are limited requirements for sidewalks and/or pedestrian paths. 0 Please comment on the effectiveness of current regulations to improve walkability. If applicable, please provide developments where this has been successful.
- 39. Benchmarking Transit-Oriented Development: Appendix A A-7 11. Do the existing regulations require bike paths in new developments? [19] Circle score Yes, regulations require bike paths in new development and include design standards that aim to make biking an efficient and enjoyable transportation option. 2 Yes, regulations do require bike paths, but there are no design standards. 1 No, there are limited requirements for bike paths. 0 Please comment on the effectiveness of existing zoning plans to encourage bike-friendly development. 12. Does the existing street design along the transit corridor enable pedestrian traffic? [20] Circle score Yes, in general the areas surrounding transit stations have a solid network of sidewalks and pedestrian/bike paths that provides safe and efficient access to the transit system. 2 Yes, the surrounding areas have somewhat of a pedestrian amenable environment and/or an improvement plan has been created but not yet implemented. 1 No, the sidewalk network is limited and there are no plans for improvement. 0 If the sidewalk network is limited, please suggest barriers to expansion (e.g. large parking lots, highways, train tracks, budget constraints).
- 40. Benchmarking Transit-Oriented Development: Appendix A A-8 13. What is the extent of pedestrian-friendly amenities such as benches, lighting, street trees and trash cans, station areas (within 1/2 mi. of stations)? [21] Circle score Pedestrian amenities are ubiquitous within ½ mi. radius of most stations. 2 Station areas vary in their provision of pedestrian amenities, with some areas lacking sufficient infrastructure. 1 Pedestrian amenities are lacking in many of the station areas. 0 If the pedestrian amenities are lacking, please suggest barriers to expansion (e.g. large parking lots, highways, train tracks, budget constraints). 14. Are station areas served by fast, frequent transit service to major destinations? Service at stations must provide all three of the following: (1) service operations at least 18 hours per day, (2) minimum 15-minute average headways, and (3) fast service to numerous major destinations. [29] If analyzing a jurisdiction, use the following criteria to score: Circle score Yes, all three qualifications are met at all stations. 2 Yes, more than two-thirds of stations meet all three qualifications. 1 No, fewer than two-thirds of stations meet all three qualifications. 0 If analyzing an individual station area, use the following criteria to score: Yes, all three qualifications are met. 2 Yes, at least two qualifications are met. 1 No, fewer than two qualifications are met. 0 If applicable, please provide additional details about provision of transit service.
- 41. Benchmarking Transit-Oriented Development: Appendix A A-9 15. Is there a high level of developer interest in development around station areas? [31] Circle score Yes, a number of local and national development firms are interested in building high density, potentially mixed-use development within 1 mile of existing or proposed transit stations. 2 Yes, there is interest in development in station areas, but developers are less interested in applying TOD principles to their development. 1 No, there is little interest in developing residential or commercial properties within 1 mile of stations. 0 Please list development firms which are actively pursuing TOD projects. Please list which station areas are most attractive to TOD developers at this time. 16. Do market studies compiled by government agencies show the high demand for TOD? [32] Circle score Yes, market studies have been compiled for residential, commercial, and office development along all transit corridors and the information has shown high demand for TOD. 2 Yes, market studies have been compiled, and the information has shown moderate demand for TOD. 1 No, market studies have been compiled, and information has show low demand for TOD. 0 If market studies have not been compiled, please list barriers to this process.
- 42. Benchmarking Transit-Oriented Development: Appendix A A-10 17. Do incentives, such as permit expediting, tax abatement, parcel assemblage, transit impact fee credits, exist to promote TOD? [33] Circle score Yes, incentives exist and have been successfully employed to generate developer interest in TOD. 2 Yes, incentives exist, but have not been utilized frequently to encourage TOD. 1 No, specific incentives do not exist to promote TOD. 0 Please list specific incentives. 18. Are joint development opportunities used to promote TOD? [34] Circle score Yes, TOD policies encourage joint development and this strategy has been employed to generate TODs 2 Yes, TOD policies encourage joint development, but this strategy has not yet been employed. 1 No, joint development to promote TOD is not specifically encouraged. 0 Please list project/site names where joint development has generated or is planned to generate TOD. 19. Is staff responsible for generating interest in TOD and assisting developers with the permitting and design process? [35] Circle score Yes, there is an identified staff person whose primary responsibility is working to increase developer interest in TOD and assisting them with the design and permitting process. 2 Yes, staff are encouraged to work with developers to increase interest in TOD and design appropriate projects, but there is no identified staff person. 1 No, TOD projects receive the same staff support as any other real estate project in the community. 0 Please give name, title, and contact information for TOD coordinators.
- 43. Benchmarking Transit-Oriented Development: Appendix A A-11 20. Are zoning codes available on the Internet? [36] Circle score Yes, zoning codes are available on the internet and are presented in a user-friendly fashion. 2 Yes, zoning codes are available on the internet, however they are not user-friendly. 1 No, zoning codes are not available on the internet. 0 Please describe efforts to make zoning codes available on the internet. For Questions 21 to 26, please answer taking into account all jurisdictions that contain at least one New Starts station. If you feel that those jurisdictions do not accurately represent the region, please provide an explanation in the Comments section. 21. Do the jurisdictions listed on the cover sheet have integrated transit and land use plans? [38] Circle score Yes, in all jurisdictions there is an enacted transit and land use plan that efficiently builds upon and coordinates synergies between the public transit system and the land uses. 2 Yes, in some jurisdictions there is an enacted transit and land use plan that efficiently builds upon and coordinates synergies between the public transit system and the land uses. 1 No, none of the jurisdictions have an integrated plan. 0 Specify jurisdictions that have plan and date adopted.
- 44. Benchmarking Transit-Oriented Development: Appendix A A-12 22. Do the existing and proposed transit stations have station-area plans? [39] Circle score Yes, most of the stations have station-area plans to guide development in a TOD supportive manner. 2 Yes, several of the stations have station-area plans to guide development in a TOD supportive manner. 1 No, there are no station-area plans at this time. 0 List stations with adopted plans and stations with drafted plans. 23. Is there a method for tracking implementation of TOD plans? [40] Circle score Yes, there is a systematic method in place for tracking the implementation of TOD plans. 2 There are individual methods for tracking the implementation of TOD plans, but they have not been formalized. 1 No, there is no systematic method for tracking the implementation of TOD plans. 0 Specify individual/group responsible for tracking implementation of TOD plans. If there is currently no method for tracking TOD plans, please suggest barriers preventing systematic tracking of TOD plans. 24. Does the political environment in the region favor the expansion of transit and the development of TOD zones? [41] Circle score Yes, there is a critical mass of elected public officials and senior public servants who have favored TOD and transit vis- à-vis sprawl/drive-alone in their platforms and during their time in office. 2 TOD and transit are not a significant component of the agenda of current administrations throughout the region due to either conflicting interests or a lack of political will to push forward the issue decisively. 1 No, there is no political support for TOD in the region. 0 Please specify elected officials by name and position who have favored TOD and transit.
- 45. Benchmarking Transit-Oriented Development: Appendix A A-13 25. Have efforts been made to develop community support for transit supportive intensities and styles of development? [42] Circle score Yes, there has been a coordinated outreach effort through a series of targeted public forums and presentation of models of successful TOD developments, in addition to public meetings on rezonings and station area plans. 2 Yes, there have been public meetings on rezoning to increase density and the formation of station area plans. 1 No, there haven't been public education efforts specific to land use changes necessary to support transit service. 0 Please briefly describe outreach efforts. 26. Are there barriers to TOD due to policy/institutional structure and/or community opposition? [43] Circle score No, policy and institutional structure support TOD, and community opposition has been limited and unorganized. 2 Yes, some barriers to TOD exist due to current policy/institutional structure and community opposition. TOD proposal have been, delayed, and/or redesigned. 1 Yes, barriers to TOD due to current policy/institutional structure and community opposition have prevented the development of TOD or forced plans to be cancelled altogether. 0 Please list specific groups who have opposed TOD efforts. Briefly describe other barriers to TOD.
- 46. Benchmarking Transit-Oriented Development: Appendix B B-1 APPENDIX B Example Evaluation Criteria for and Applications for Indicators The following pages provide examples of how the indicators can be applied to evaluations of regional TOD policies and outcomes, evaluations of transit station areas, or evaluations of local land use authorities’ policies and regulations. For each kind of analysis, example criteria are given showing how such criteria might elicit “strong,” “neutral,” or “weak” ratings based on certain thresholds and calculations, which are also provided. These criteria are provided as guidance as to how these indicators can evaluate the efficacy of TOD policies and outcomes. However, different regions and authorities should consider their own goals and priorities in developing appropriate criteria. Ultimately, different weighting systems could be developed whereby different benchmarks are measured based on the strength of predetermined weights, such as land use regulations, equity, or transit usage.