
Recommended
Recommended
More Related Content
Similar to 913-Article Text-907-1-10-20080428.pdf
Similar to 913-Article Text-907-1-10-20080428.pdf (20)
Recently uploaded
Recently uploaded (20)
913-Article Text-907-1-10-20080428.pdf
- 1. 1 X. Zheng and Y. Lan. “Effects of Drying Temperature and Moisture Content on Rice Taste Quality”. Agricultural Engineering International: the CIGR Ejournal. Manuscript FP07 023. Vol. IX. November, 2007. Effects of Drying Temperature and Moisture Content on Rice Taste Quality X. Zheng* and Y. Lan** * College of Engineering, Northeast Agricultural University, 150030,Harbin, China, zhengxz2006@yahoo.com.cn ** USDA-ARS, 2771 F&B Road, College Station, 77845, TX, U.S.A ylan@sparc.usda.gov ABSTRACT The influence of drying temperature on rice taste quality was studied in this paper. The heated-air temperature of 40℃, 45℃, 50℃, 55℃, and 60℃, respectively, were used to dry fresh paddy. The critical drying temperature of 45℃ for paddy rice with an initial moisture content of 21.36% w.b. was obtained, which induce the rice taste value declining significantly. Also, the amorphous starch matrix inside the rice kernel, which takes the shape of hardly dissolved starch granular, was observed by electron microscope. The fatty acid content of the rice increases as the drying temperature, which results in a higher degree of rice aging and restrains starch gelatinization during rice cooking. Those are key factors leading to the degradation of rice taste in the post-drying paddy. In order to preserve rice taste quality, a drying temperature below 45℃ is recommended for drying paddy, if its initial moisture content is less than 21.36%. The relationship between the major rice ingredients viz protein, amylose, moisture, and fat acid and taste value was established based on the experiment data used to predict rice taste quality. Keywords: Drying temperature, rice, taste, moisture content, fatty acid, China 1. INTRODUCTION Paddy (threshed, unmilled rice), as the thermal sensitive bio-material, is apt to display degradation phenomena including cracking and inferior taste during the drying process. It is necessary to analyze and calculate the taste value of the post-drying paddy for paddy processing and dryer designing. Researchers have studied the quality variation of post-drying paddy. Chen (1997) and Bonazzi et al (1997) suggested that variety, temperature and relative humidity were the main factors that lead to HRY decrease. Some changes in rice functionality associated with the temperature and time used in drying have been reported. Mullenet et al (1998) observed that a high drying temperature (54.3℃) resulted in softer cooked rice kernels but higher cohesiveness based on texture profile analysis with a texture analyzer. Elaine (1996) and Chanpagen et al (1997) concluded that the rice flavor density at 15% moisture content is better than 12% moisture content, and the influence of rice whiteness on flavor density is relevant to moisture content and variety. Yamashita (1996) demonstrated that when drying temperature exceeded 40℃, rice taste quality decreased. David L (1971) and Batcher et al (2004) reported that drying at elevated temperatures (up to 71 ℃) caused neither marked improvement nor deterioration in the cooking quality of milled rice. Wiset et al(2001) noted that head rice yield, amylose content, gel consistency, water absorption, and volume expansion were affected by the method or temperature used in drying rough rice.
- 2. 2 X. Zheng and Y. Lan. “Effects of Drying Temperature and Moisture Content on Rice Taste Quality”. Agricultural Engineering International: the CIGR Ejournal. Manuscript FP07 023. Vol. IX. November, 2007. Koji Takahashi (1982) applied differential thermal analysis to examine thermal behavior of the rice starch, which could explain the thermal variability of the rice during the drying process. Koji Takahashi measured the denaturation temperature of brown rice grain at 53.5℃. However, further research results from James Patindol et al (2003) reveal that drying regime caused no apparent changes no starch molecular-size distribution and amylopectin chain-length distribution. Taste is an important index to evaluate the quality of rice. Shinjiro Chikubu et al (1983,1985) established the taste estimation formula of rice by multiple regression analysis based on the five items of physicochemical properties: the protein of milled rice, maximum viscosity, minimum viscosity, breakdown in amylographic characteristics of milled rice flour, and starch-iodine blue value of residual liquid in cooking quality of milled rice. The relationship between palatability evaluation of cooked rice and physicochemical properties of rice was determined. The present research of post-drying paddy quality is mostly focused on stress cracks. However, the results from preliminary research showed that rice taste might greatly degrade, even when stress cracks do not appear. Therefore, it is necessary to study paddy-drying quality for protecting rice taste quality. The objectives of this study were to develop a mathematical model to calculate the rice taste for the post-drying paddy, and analyze the effect of drying temperature on rice taste quality. 2. MATERIALS AND METHODS Medium fresh paddy varieties-- Dongnong 9316, Dongnong 420 and Dongnong 419 -- with initial moisture content of 21.4% (w.b.) were harvested from Northeast Agricultural University farm at Xiangfang, China, in September 2006. The samples were stored in a refrigerator (-10℃) prior to use after being cleaned in a separator. Thin-layer drying experiments were performed using perforated trays in the same drying chamber as described by Zheng (1999), where drying air conditions including temperature and relative humidity were controlled by an auto-controller. The drying temperatures were 40℃, 45℃, 50℃, 55℃, and 60℃. Relative humidity of the heated air was 15%. Surface velocity was 0.4 m/s. Each of the paddy samples (only Dongnong 420) was spread in a perforated tray containing about 70g and was weighed at time intervals of 5 min. When the sample weight reached 92g with moisture content (M.C) of 14.5%, the paddy was taken out and cooled down. The drying paddy sample was milled (Yamamoto, made in Japan) and sealed in plastic bags. Samples were allowed to equilibrate to room temperature. A McGill ample Sheller (husker) was used to remove the hull and a McGill No. 2 mill was used to remove the bran. Samples were milled to a constant degree of milling (DOM) of 90. The DOM was measured using a Satake milling meter MM-1B. Three varieties of paddy dried by natural air -- Dongnong 9316, Dongnong 420 and Dongnong 419 -- were used to measure the taste value. Twelve professionally trained panelists, employed by the National Rice Quality Test Center, Harbin, P.R. China, developed a sensory profile of cooked rice samples according to the GB/T1568.2-1995 (rice sensory standard from Department of Agricultural, P.R China). During panel tests, the cooked rice taste was evaluated in terms of flavor (15 points), appearance (15 points), tooth sense (60 points) and texture of the cool cooked rice (10 points). The appearance attributes examined were color, glossiness, intactness of
- 3. 3 X. Zheng and Y. Lan. “Effects of Drying Temperature and Moisture Content on Rice Taste Quality”. Agricultural Engineering International: the CIGR Ejournal. Manuscript FP07 023. Vol. IX. November, 2007. grains and plumpness. Eight attributes to evaluate cooked rice flavor included boiled egg white, puffed corn, raw rice, wet cardboard, hay-like, metallic, sweet taste, and bitter taste. The panelists adequately describing the texture profile of cooked rice identified nine tooth sense attributes: adhesiveness to lips, hardness, cohesiveness of mass after three chews, cohesiveness of mass after eight chews, roughness of mass, toothpull, particle size, toothpack, and loose particles. Texture attributes included the degree of agglomeration, adhesiveness and roughness. Park (2001) described the definitions and degree of those attributes and test procedure for measuring cook-rice taste. Each of the rice samples (500g) were cooked in household steam rice cookers (National, SR_W10FN, Japan) with 1.45:1(v/v) water-to-rice ratio. Twenty minutes after the cooker shifted from cook to warm setting, the cooked rice within 1 cm of the top, bottom, and side of the inner pan in the rice cooker was discarded and the middle portion was transferred to a bowl. Cooked rice placed in a bowl was stirred gently five times with a fork using an up and down motion, then held for 5 min at room temperature. Stirring and holding procedures of cooked rice were repeated twice. The cooked rice was then cooled and portioned for taste evaluation. Cooked rice samples (40g) cooled to room temperature were taken with the chopsticks, covered and presented to the panelists. First, the panelists opened the cover to evaluate intensity of each flavor attribute. Secondly, appearance color and kernel structure of cooked rice were observed according to the above standards. Third, the tooth sense of cooked rice in terms of softness, cohesiveness and taste were evaluated. One hour later, the texture attributes of cool cooked rice were determined. A randomized complete block design with four replicates was used for the taste evaluation of cooked rice. The scores of all samples were listed in Table 1. Moisture content of milled rice was measured by a single kernel moisture tester (PQ-510, Kett, Japan), Protein (N×5.95), lipid and fatty acid, amyolse (dry weight basis) were determined by AOAC methods. 3. RESULTS AND DISSCUSION 3.1 Rice Taste Value The main ingredients of rice that determine taste are protein, starch, lipid and moisture. In terms of nutrition, it was generally suggested that the higher the protein content, the more nutrition. However, in terms of taste, a lower protein appeared to be more desirable. The amylose content in the starch, which also affected the taste of rice, determined the viscosity of cooked rice. When the moisture content of rice dropped to below 15%, the taste value decreased as well. In addition to these three main ingredients, the lipid content also affects the taste of rice. When rice ages, the neutral lipid turns into fatty acid and releases a particular odor, which becomes an undesirable part of the taste. Table 1. The ingredients and taste value of the rice Amylose content Protein content Moisture content/ lipid content Rice taste measured value Rice taste calculating value % % % % % % 17.5 7.4 14.5 1.73 72 72 17.1 7.7 14.2 1.73 70 72
- 4. 4 X. Zheng and Y. Lan. “Effects of Drying Temperature and Moisture Content on Rice Taste Quality”. Agricultural Engineering International: the CIGR Ejournal. Manuscript FP07 023. Vol. IX. November, 2007. 19.6 8.3 13.4 1.75 56 56 17.8 7.6 14.3 1.78 71 67 18.0 7.8 14.1 1.68 68 67 18.9 8.0 13.9 1.68 63 61 19.0 7.7 13.9 1.68 63 63 18.9 7.7 13.9 1.68 64 63 17.3 7.8 14.0 1.75 68 70 19.4 8.1 13.6 1.68 60 58 19.3 8.1 13.7 1.73 58 58 18.7 8.2 13.9 1.73 61 60 19.6 8.1 13.6 1.75 57 57 18.5 7.7 14.1 1.73 66 65 16.5 7.7 14.4 1.80 70 75 17.7 7.3 14.6 1.75 73 72 20.3 7.5 14.1 1.65 58 59 20.7 7.3 14.5 1.65 58 59 20.0 7.3 14.4 1.65 63 61 20.2 7.4 14.4 1.63 59 60 18.9 7.5 14.3 1.73 66 64 18.0 8.4 14.0 1.73 57 62 21.2 7.2 14.3 1.68 57 57 18.5 8.2 14.2 1.70 60 62 19.1 7.3 14.6 1.70 65 65 20.7 7.5 14.3 1.73 56 57 19.3 7.5 14.5 1.63 61 63 18.5 8.2 14.2 1.70 60 62 21.2 7.2 14.3 1.68 57 57 18.7 8.4 14.0 1.73 58 59
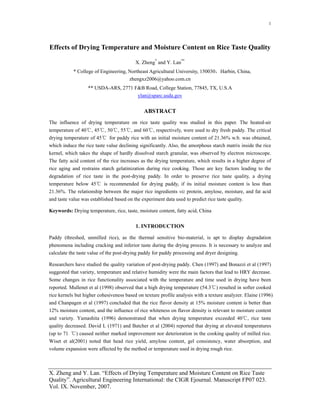
- 5. 5 X. Zheng and Y. Lan. “Effects of Drying Temperature and Moisture Content on Rice Taste Quality”. Agricultural Engineering International: the CIGR Ejournal. Manuscript FP07 023. Vol. IX. November, 2007. 18.9 7.5 14.3 1.73 63 64 19.0 7.5 14.6 1.63 64 64 23.7 7.2 14.6 1.68 47 48 Therefore, the taste of rice can be predicted by measuring its protein, amylose, moisture and lipid contents. SAS was used to fit the experimental data (in Table 1) in a mathematical model. The model was obtained as: 2 ) 15 15 ( 23149 28 . 0 06 . 0 81 . 0 33 . 1 − − + = F M P A S (1) Where: S is the rice taste value. A represents the rice amylose content. P represents the rice protein content. M represents the rice moisture content. F represents the rice lipid content. Although rice taste involves physiological elements such as "touch and feel in the mouth," and perceptive elements such as "color and luster," and rice main ingredients in a complicated way, Equation 1 can be used to calculate the rice taste value according to rice ingredients, whose correlation coefficient between measured and predicted value of taste is 0.95. The correlation coefficients between the taste of cooked rice and amylose, protein, moisture and lipid of rice were –0.83, -0.14, 0.23, and 0.36, respectively. The results from statistics analysis show that rice taste value is negatively related to amylose and protein content and positively correlated with moisture and fat content. In general, the appearance and flavor of the cooked rice is better with increasing lipid content. When the moisture content range was 14.0-15.0%, the rice taste improves. The texture attribute of cooked rice in terms of hardness, adhesiveness, and cohesiveness decreased with the increase of the content of amylose and protein in rice. 3.2 Rice Taste Variables of Post-drying Paddy The paddy-drying curves in Figure 1 show that the drying rate increases with an increase of drying temperature due to the higher moisture-diffusing coefficient. The surface layer moisture of the paddy, lie in mechanic unit state with the solid skeleton of paddy kernel with low unit energy, is easy to remove. Therefore, the drying rate of paddy is high at the initial drying stage. With the drying proceeding, the moisture of mechanic unite state disappeared and the moisture with stronger physical-chemical unite state inside paddy kernel appear and the drying rate of paddy descended. The moisture gradient inside paddy kernel increases with the drying rate rise, which result in the cracking rate greatly increased and HRY and taste decreased. Taste ratio was used to explain the degree of post-drying paddy taste which is ratio between heated-air and natural-air drying paddy at same moisture content. A significant effect about drying temperature on rice taste value was found, as shown in figure 2. The result shows that the value of rice taste did not change
- 6. 6 X. Zheng and Y. Lan. “Effects of Drying Temperature and Moisture Content on Rice Taste Quality”. Agricultural Engineering International: the CIGR Ejournal. Manuscript FP07 023. Vol. IX. November, 2007. when paddy drying temperature was lower than 45℃. When the drying temperature of paddy rose above 45℃, the value of taste dropped quickly. It is inferred that higher drying temperature makes paddy crack and further decreases the cooked rice viscosity. The micro-structure on the cooked rice surface was observed with an optic microscope (model MM40/2T, NIKON Inc., Japan). A three-dimensional imagine with developed network structure with countless slight cavities on the surface of rice with the high taste value (>65) was found. The boundary among endosperm cell was difficult to be discriminated. It may be the reason that the high taste value rice was soft and elastic. However, the low taste value rice (<60) has fewer networks on the cooked rice surface and cavities are even. During cooking, the fluid starch paste had high viscosity and a low expanding rate, which created low rice viscosity and elasticity, hardness and poor taste. Comparing Figure 1 and Figure 2, with the drying temperature increases, as the drying rate increases the rice taste ratio plummets. 3.3 Relationship between T and MC Obtaining the Best Taste Figure 3 describes the change rate of rice taste with various drying temperatures for paddy with different initial moisture content (IMC). It was concluded that the change rate of rice taste increases with the increase of initial paddy moisture content at the same drying temperature. The taste begins to drop for the paddy with relatively high IMC at low drying temperature. For the paddy with IMC of 25%, the taste significantly decreases at drying temperatures above 35℃. However, little taste decrease was found at the drying temperature 50 ℃ for the paddy with IMC of 16%. It was inferred that the taste of paddy with the low IMC could be maintained under relatively high drying temperature. Therefore, the drying technology from low to high drying temperature may maintain the tastes of the post-drying paddy. A mathematical model was developed based on the data from Figure 3 with SAS software to describe the relationship between the initial moisture content and the critical temperature (CT) of paddy. CT is defined as a drying temperature that guarantees the change rate is no more 5% of the original rice taste for final paddy after drying. T=exp (5.021-0.058M) (2) Where: T is critical drying temperature (℃). 0 .6 0 .6 5 0 .7 0 .7 5 0 .8 0 .8 5 0 .9 0 .9 5 1 0 5 1 0 1 5 2 0 2 5 3 0 3 5 4 0 4 5 5 0 5 5 6 0 40℃ 45℃ 50℃ 55℃ 60℃ 14 14.5 15 15.5 16 16.5 17 17.5 18 18.5 19 19.5 20 20.5 21 21.5 22 0 5 10 15 20 25 30 35 40 45 50 55 60 40℃ 45℃ 50℃ 55℃ 60℃ Drying time min Figure 1. Drying rate curve Drying time min Figure 2. Rice taste ratio change curve Taste ratio M.C/%
- 7. 7 X. Zheng and Y. Lan. “Effects of Drying Temperature and Moisture Content on Rice Taste Quality”. Agricultural Engineering International: the CIGR Ejournal. Manuscript FP07 023. Vol. IX. November, 2007. M is the initial moisture content of the paddy (%, w.b.). The equation is suitable for paddy with moisture content range of 16% - 25%. The equation can be used to determine the drying temperature in a paddy dryer to preserve the rice taste. 3.4 Effect of Drying Temperature on Fatty Acid Table 2 indicates fatty acid content of post-drying rice stored for 1 month, which revealed that as paddy drying temperature increases, there is an increase in fatty acid content in rice. Therefore, the gelatinization temperature of rice rises due to the combination of fatty acid and amylose restraining rice swell during cooking. High fat acid content is another disadvantage that decreased rice taste value. Table2. Post-drying paddy fatty-acid content Drying temperature/ ℃ Natural-air drying 40 45 50 55 60 Fatty-acid content/ mg.100g-1 6 6 8 14 17 17 3.5 Analyzing Post-drying Paddy Micro-structure Rice grain consists of about 90% (d.b) rice starch. Endosperm of milled rice is tightly packed with polygonal starch granules and spherical-shaped protein bodies. The cross section of milled rice after drying with different methods was observed by scanning electron method technique. Figure 4a. Natural air drying Figure 4b. 40℃ DT Figure 4c. 50℃ DT Figure 3. The relationship between temperature and taste retention rate 60 65 70 75 80 85 90 95 100 30 35 40 45 50 55 60 Drying temperature 16% 19% 22% 25% Taste retention rate %
- 8. 8 X. Zheng and Y. Lan. “Effects of Drying Temperature and Moisture Content on Rice Taste Quality”. Agricultural Engineering International: the CIGR Ejournal. Manuscript FP07 023. Vol. IX. November, 2007. Three post-drying rice slices were examined with an electron microscope. Figure 4a and Figure 4b show that the starch granules called β–starch are in an orderly arrangement inside a rice kernel dried by natural air and heated air (40℃), respectively. It was seen that polygon-shaped starch granules, as well as spherical protein bodies were clearly separated, and no significant difference was apparent between the two samples. With drying temperature raised, starch granules fiercely moved and spread during drying. Figure 4c shows that at a drying temperature of 50℃, there was acceleration in starch molecular reassociation of the arrangement leading granules from order to disorder. The starch granules absorbed moisture leading to partial gelatinization, which formed a paste called α -starch during the drying process. After cooling, this kind of starch structure was neither α -starch nor β -starch, but aging starch, which formed hardly dissolved starch granular during cooking. Rice containing aging starch granular is less sticky and tastes worse. In following figures, the RMS and DT respectively represent the rice microstructure and drying temperature. 4. CONCLUSIONS The following conclusions can be drawn from the experiments: •Increasing fatty acid content, disorder and unsystematic starch structure and partial gelatinization with aging starch granular are indications that high-temperature drying influences cooked-rice taste in characteristics of low viscosity and high hardness. •If the drying temperature were determined based on equation (2), the mathematical model (1) could be used to predict rice taste value after drying paddy. Variable drying temperature from low to high according to equation (2) is a reasonable treatment to dry paddy with high taste quality. Further research needs to be conducted to analyze in greater quantity the effect drying conditions have on rice taste value. 5. ACKNOWLEDGMENT The authors of this paper would like to take this opportunity to acknowledge the financial support of the Education Department of Heilongjiang Province in China for the Oversea Researcher Projects (No 1151HZ01 & 10531002) that have provided funding for this project. 6. REFERENCES Bonazzi, C., M. Peuty, and, A.Themelin. 1997. Influence of drying conditions on the process quality of rough rice. Drying Technology15 (3&4):1141-1157. Champagne, E.T. 2004.Rice: Chemistry and Technology. Minnesota: American association of cereal chemists,Inc. Champagne, E, T. 1996.Quality evaluation of U.S. medium-grain rice using a Japanese taste analyzer. Cereal Chemistry 73(2): 290-294. Champagne, E, T., L. Karen, B. Bett, and, T.Vinyard. 1997. Effects of drying conditions, final moisture content and degree of milling on rice flavor. Cereal Chemistry 74(5): 566-570.
- 9. 9 X. Zheng and Y. Lan. “Effects of Drying Temperature and Moisture Content on Rice Taste Quality”. Agricultural Engineering International: the CIGR Ejournal. Manuscript FP07 023. Vol. IX. November, 2007. Chen, H., T.J. Siebenmorgen, and, B.P. Marks. 1997. Relating drying rate constant to head rice yield reduction of long-grain rice. Transactions of the ASAE 40(4):1133-1139. David, L. and B. D. Webb. 1971. Effect of the method of dryer operation on performance and on the milling and cooking characteristics of rice. Transactions of the ASAE 14(1):142-145. James, P. and, U. J. Wang. 2003. Properties of Flours and Starches as Affected by Rough Rice Drying Regime. Cereal Chemistry 80(1): 30-34. Koji, T. 1982.Application of differential thermal analysis to examination of thermal behavior of starch. Journal of the Japanese Society of Agricultural Machinery 29(1):56-67. Meullenet, C. and A. Mauromoustakos. 1998. Sensory descriptive texture analyses of cooked rice and its correlation to instrumental parameters in an extrusion cell. Cereal chem. 75(5):714-720. Park, J, K. and S, S. Kim. 2001. Effect of milling ratio on sensory properties of cooked rice and on physicochemical properties of milled and cooked rice. Cereal Chemistry 78(2):151-156. Shinjiro,C., W. Shozo, and, S. Teizo. 1983. Relation between palatability evaluations of cooked rice and physicochemical properties of rice. J. Jpn. soc. Sci 30(4): 333-341. Shinjiro, C., W. Shozo, and, S. Teizo. 1985. Establishment of palatability estimation formula of rice by multiple regression analysis. J.Jpn. soc. Starch Sci, 32 (1): 51-60. Wiset, L., G. Srzednicki, R. H. Driscoll, C.Nimmuntacin, and, Siwapornrak P. 2001.Effects of high temperature drying rice quality. Agricultural Engineering International: the CIGR Journal of Scientific Research and Development. Manuscript FP01 003.Vol, III. Yamashita. 1996. Drying method of keeps grain quality. Journal of the Japanese Society of Agricultural Machinery 58(2):55-60. Zheng, X.Z. 1999. Study on paddy drying mechanism and quality and reasonable technology parameter”, Ph.D. diss., College Engineering, Northeast Agriculture Univ., China (in Chinese).