1. Arashdeep Singh et al Int. Journal of Engineering Research and Applications www.ijera.com
ISSN : 2248-9622, Vol. 4, Issue 8( Version 5), August 2014, pp.80-90
www.ijera.com 80 | P a g e
Effect of Storage Period on the Physicochemical, Sensory and Microbiological Quality of Bakery Flavoured Ice Cream Arashdeep Singh, Usha Bajwa, Rajpreet Kaur Goraya Department of Food Science and Technology Punjab Agricultural University Ludhiana Abstract Storage conditions were known to bring about some physicochemical changes in frozen foods. The present investigation was therefore carried out to examine the effect of storage period on the physicochemical, sensory and microbiological quality of bakery flavoured ice cream. Bakery flavoured ice cream incorporating cookies (plain and chocolate) and cakes (vanilla and chocolate) at 10 per cent level were prepared and subjected to 60 days of frozen storage and evaluated periodically at intervals of 15 days. With the progress in the storage period total solids, acidity and specific gravity of all ice cream samples increased significantly (p<0.01) during the storage, while pH, antioxidant activity and overrun decreased significantly (p<0.01). Protein, fibre and ash content do not show any significant change during storage. The decrease in total phenolic content was found to be non significant with increase in storage period from 0 to 60 days. Storage period had significant (p<0.01) on L and a*colour attributes of ice cream samples. First dripping time increased while melting rate decreased in all samples. The mean sensory scores of all ice cream samples decreased significantly with progress in storage period at -18±1o C. There was a significant decline in Standard Plate Count (SPC) and increase in psychrophillic count with progress in storage period. Keywords: Ice cream, physicochemical, sensory quality, first dripping time, melting rate, microbiological quality, storage.
I. Introduction
Ice cream is a frozen product composed of milk, protein fortifiers (whey protein concentrates skim milk powder, etc.), sweeteners, stabilizers, emulsifiers and flavourings. It is manufactured with homogenized and pasteurized mix followed by ageing the mix at low temperature and finally freezing the aged mix with the incorporation of air at proper conditions (Frost et al 2005; Guner et al 2007). Ice cream consists of at least 4 major discrete phases: ice crystals, air cells, fat globules, and liquid phase. Ice cream quality is dependent on many factors, ice crystal size, storage time and temperature and temperature fluctuation during storage. Ice crystals form at the beginning of the freezing process. The freezing process involves rapid removal of heat while agitating vigorously to incorporate air, thus imparting the desirable smoothness and softness of the frozen product (Marshall et al 2003). The faster the ice cream mix is frozen, placed into the final container and sent through the freezer, the smaller ice crystals are in the finished product. Smaller ice crystals in ice cream are more desirable to consumers, as the product is perceived to be less icy. Other factors that can contribute to change in quality of ice cream during storage are long storage time and variable storage temperatures (Marshall and Arbuckle 1996). Ice crystals grow during storage when the ice cream warms: some of the ice crystals will melt and the free water is attracted to other crystals onto which it is frozen, creating larger ice crystals as the temperature decreases during storage (Marshall et al 2003). Ice crystals are also influenced by ingredients and ingredient interactions. Fat content influences texture by decreasing the ice crystal size through mechanical obstruction and by producing a lubricating effect, causing a smooth sensation in the mouth (Goff et al 1993).The maintenance of excellent body and texture and flavour during storage is an important factor in the successful storage of ice cream. Conditions under which ice cream is held should be well controlled if the quality of the product is to be maintained (Earl and Tracy 1960). During storage several physical and chemical changes occur in ice cream. The overall quality of ice cream depends upon the storage period of ice cream during which many undesirable changes might occur in the ice cream that lead to deteriorate the physicochemical and sensory quality. The physical and organoleptic properties of the ice cream deteriorated with increase in storage time and temperature (Mahran et al 1987; Guzeler et al 2011; 2012). The storage time should not be more than 30 days because longer storage had an undesired effect on the physical and sensory properties of ice cream. The present investigation was, therefore, planned to study the changes in physicochemical, sensory and microbiological quality of ice cream during the frozen storage.
RESEARCH ARTICLE OPEN ACCESS
2. Arashdeep Singh et al Int. Journal of Engineering Research and Applications www.ijera.com
ISSN : 2248-9622, Vol. 4, Issue 8( Version 5), August 2014, pp.80-90
www.ijera.com 81 | P a g e
II. Materials and methods
Fresh whole milk was obtained from Guru Angad Dev Veterinary and Animal Sciences University (GADVASU), Ludhiana. Cream, skim milk powder, sugar, sodium alginate and glycerol monostearate were procured from the local market. Cookie and cake were prepared in the laboratory. The ingredients for ice cream mix were calculated as per the formulae given by Arbuckle (1977). The cooled and aged ice cream mix was added with cookie and cake in the freezer followed by freezing the contents in a batch type freezer (Sigma Sales Corporation, New Delhi). Physicochemical analysis: Moisture, ash, protein and titratable acidity were determined according to AOAC (2000) method. The pH of samples was measured using pocket pH meter (IQ Scientific USA, Model IQ 125). The fibre content was estimated using Fibertec (Foss instrument, Sweden). Total phenolic content was measured using Folin-Ciocalteu reagent according to the modified method of Swain and Hillis (1959). Antioxidant activity was estimated using the method of Shimada et al (1992). Colour of the ice cream samples were noted on Hunter Colour Lab (Ultra Scan, Hunter Lab, USA) in terms of „L‟, „a‟, „b‟ values. Specific gravity of ice cream samples was calculated as described by Winton (1958). Overrun of the ice cream was calculated on weight basis using the following formula: Overrun % = wt.of ice cream mix−wt.of ice creamwt.of ice cream mix×100 First drip time and melting rate was estimated at 20 ± 1 ºC using the method of Akesowan (2008) with little modifications. Sensory evaluation: Ice cream samples were evaluated by a semi trained panel of 8 judges for the attributes of appearance, flavor, body and texture and overall acceptability scores on a 9-point hedonic scale (Larmond 1970). Microbiological analysis: The ice cream samples were analyzed for Standard Plate Count (SPC) and psychrophilic count using nutrient agar and yeast and mould count using glucose yeast agar as per standard APHA (1992) procedures. Statistical analysis: The experimental data was analyzed by analysis of variance (ANOVA) using CPCS-I software developed by Department of Mathematics and Statistics, Punjab Agricultural University, Ludhiana. Each value was a mean of three observations.
III. Result and discussion
Effect of storage on physicochemical properties of ice cream: Total solids play an important role in the quality of ice cream. Total solid content of all ice cream samples increased significantly (p<0.01) during storage period (Table 1). The elevation in total solids of all ice cream samples may be attributed to the loss of moisture from the samples during storage. Bajwa et al. (2003) reported a significant decline in moisture content of ice cream with strawberry pulp during storage. Gradual increase in total solids of ice cream with fig paste during storage was also observed by Murtaza et al. (2004b) due to decrease in moisture. Abdullah et al. (2003) also noticed an increase in total solid content of ice cream with soymilk and skim milk blends during the storage of 30 days. The effect of incorporation of different bakery products was found to be significant (p<0.01) while that of storage period was non-significant on protein, fibre and ash content of ice cream containing different bakery products (Table 1). The acidity of all ice cream samples increased significantly (p<0.01) during the storage period while pH value decreased progressively (Table 2). The acidity of control sample was appreciably higher than that with bakery items at 0 day. It increased from 0.171 to 0.182 per cent in control. Acidity of ice creams with vanilla and chocolate cake also increased significantly (p<0.01) during 60 days storage at -18 ± 1oC. The increase in the acidity was possibly due to the formation of lactic acid by lactic acid bacteria (LAB) and psychrophillic bacteria during storage (Murtaza et al. 2004a). The results of this study are similar to those reported by Siddique et al. (1988), Abdullah et al. (2003) and Murtaza et al. (2004a) who found that there was a gradual increase in acidity on storage of ice cream. Acidity of yoghurt ice cream also increased during storage (Singh et al. 2006).The pH has a direct influence on the flavour perception of the dairy products (Hegenbert 1991) and a gradual decrease in pH of all samples throughout the storage period was observed. This was due to increase in titratable acidity of ice cream. Interaction between ice cream type and storage was found to be significant (p<0.01). The findings are in concordance with the results of earlier workers, Abdullah et al. (2003), Bajwa et al. (2003) and Singh et al. (2006).
As shown in Table 2, significant (p<0.01) difference was observed in antioxidant activity and phenol content of ice cream samples with bakery items. A significant (p<0.01) decrease in the antioxidant activity of samples at-18±1 oC during 60 days storage period was observed. After 60 days storage, highest decrease of 16.41 per cent in plain cookies, while lowest decrease of 8.09 per cent in chocolate cake ice cream samples was observed. Patthamakanokporn et al. (2008) reported that antioxidant activity in the guava pulp decreased significantly during storage at -20 oC and continued to decrease during 3 months of storage. Interaction between treatment and storage was found to be significant (p<0.01) for antioxidant activity. The
3. Arashdeep Singh et al Int. Journal of Engineering Research and Applications www.ijera.com
ISSN : 2248-9622, Vol. 4, Issue 8( Version 5), August 2014, pp.80-90
www.ijera.com 82 | P a g e
decrease of antioxidant activity may be attributed to the decrease in bioactive components during storage such as Maillard reaction products and total phenols. The phenols reduced during the storage of ice cream; however, the reduction during storage was not found to be significant. The main deleterious process that takes place during frozen storage is lipid oxidation. Oxidative reactions still occur in the lipid fraction of frozen foodstuffs, although at a slower rate than at refrigeration or room temperature and tend to increase with high oxygen permeability and higher fat content (Bhattacharya et al. 1988) Incorporation of bakery products in ice cream significantly (p<0.01) decreased the overrun of ice cream. A substantial decrease also occurred after 60 days storage of ice cream (Table 3). A decrease of 16.41 per cent was observed in plain cookie followed by 11.21 per cent in vanilla cake, 8.59 per cent in chocolate cookie and 8.09 per cent in chocolate cake ice cream. This decrease was due to loss of air and moisture from ice cream. Potter and Hotchkiss (1995) described that the shrinkage in the ice cream during storage was caused by the loss of air due to collapse of weakened films of mix from ice cream leading to a loss in volume. Guzeler et al. (2012) found that during storage of ice cream, overrun values decreased significantly among samples with different stabilizers and emulsifiers. Murtaza et al. (2004a) observed a decrease in overrun values of ice cream from 49.35 to 44.83 per cent for storage period of 40 days. Abdullah et al. (2003) and Bajwa et al. (2003) also reported similar results of ice cream with soymilk blends and strawberry pulp and Butt et al. (1999) in ice cream formulated with combination of stabilizer and emulsifier blends during storage. Specific gravity values of samples formulated with bakery products were affected significantly (p<0.01) with ice cream type and storage. It increased significantly (p<0.01) with progress in storage in all the samples containing both cookies and cakes. There was a significant (p<0.05) interaction between treatment and storage. During the storage of ice cream, air cells collapsed, causing ice cream to lose its volume thus leading to shrinkage in the ice cream. Because of this shrinkage ice cream became heavy and dense resulting in increased specific gravity of the sample.
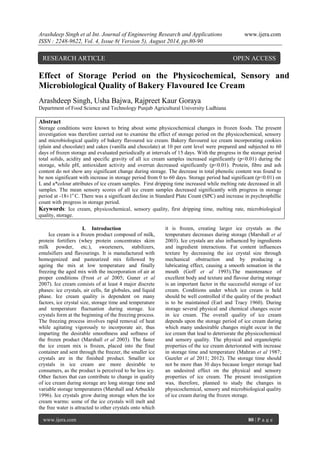
The effect of storage on colour attributes (L, a and b values) of ice cream formulated with different bakery products is depicted in Table 4.Ice cream type and storage period both had a significant (p<0.01) effect on L and „a‟ attributes. L value which designates the whiteness of the product decreased significantly (p<0.01).There was a significant (p<0.01) increase in “a” value during storage of 60 days indicating that products became more red during storage. Highest “a” value which represents more red colour, was observed in sample with chocolate cookies. The „b‟ value differed significantly (p<0.01) with the type of ice cream while storage period did not have a significant effect on „b‟. Kaur et al. 2011 reported a decrease in L values of control and lycopene treated ice cream samples during the 4 months of storage. Effect of storage on first dripping time and melting rate of ice cream: First dripping time of all ice cream samples increased (Fig 1), whereas melting rate decreased (Fig 2) with progress in the storage period. The per cent decrease in melting rate ranged from 2.32 to 9.12 per cent being lowest in plain cookie and highest in chocolate cake ice cream. A decrease in melting rate of 4.46 and 6.66 per cent was observed in chocolate cookie and vanilla cake samples, respectively. Guzeler et al. (2011) observed a significant (p<0.01) increase in first dripping time of ice cream during 3 months of storage period in plain ice cream. Meltdown is an important property of ice cream that affects its sensory quality. The meltdown of ice cream is influenced by its composition, the amount of air incorporated, additives, the nature of the ice crystals and by the network of fat globules formed during freezing (Koxholt et al. 2001). Sakurai et al. (1996) found that ice creams with high overruns melted quickly whereas those with low overruns began to melt slowly and had a good melting resistance. As the ice cream melts, heat is transferred from the warm air surrounding the product into the ice cream to melt the ice crystals. They explained that initially the ice melts at the exterior of the ice cream and there is a local cooling effect (in the vicinity of the melting ice). The water from the melting ice diffuses into the viscous unfrozen serum phase and this diluted solution then flows downwards (due to gravity) through the structural elements that are destabilized fat globules, air cells, and remaining ice crystals etc. to drip through the screen on which the ice cream rests. The use of Konjac flour alone or combined with κ- carrageenen as stabilizer retarded the meltdown of ice cream samples with respect to the control (Akesowan 2008).
Effect of storage on mean sensory scores of ice cream: The appearance/colour scores of control, plain cookie, chocolate cookie, vanilla cake and chocolate cake incorporated ice cream samples did not differ significantly at 0 day of storage (Table 5). The scores decreased significantly (p<0.01) with progress in the storage period. The mean body and texture scores of all types of ice cream were comparable at 0 day of storage. However, the scores for body and texture of bakery flavoured ice cream were reduced significantly (p<0.01) during storage. The reduction in sensory scores was more in vanilla and chocolate cake samples than with cookies. The mouthfeel and flavour scores of all type of ice cream were comparable when evaluated afresh. However, the scores were reduced significantly (p<0.01) in all
4. Arashdeep Singh et al Int. Journal of Engineering Research and Applications www.ijera.com
ISSN : 2248-9622, Vol. 4, Issue 8( Version 5), August 2014, pp.80-90
www.ijera.com 83 | P a g e
ice cream samples after 60 days of storage. This was due to the growth of bacteria that increased during storage, results in flavour changes and caused deterioration in flavour scores. The decrease in flavour scores were also due to increase in the acidity of the product and decrease of pH. With progress in the storage period moisture lost from the ice cream making it denser and thus affecting the mouthfeel scores. The overall acceptability scores of all ice cream samples were reduced significantly (p<0.01). The overall acceptability scores of chocolate cookies and plain cookies ice cream remained high but dropped sharply in both vanilla and chocolate cake ice cream. Mahran et al. (1987) reported that sensory quality of the ice cream decreased with increase in storage time. Murtaza et al. (2004a) observed a gradual decrease in scores for all the sensory characteristics of ice cream samples during storage. A decline in overall acceptability scores had also been reported by Butt et al. (1999) and Abdullah et al. (2003).
Effect of storage on the microbiological quality of ice cream: Microbiological quality of ice cream as affected by ice cream type and storage is presented in Table 6. Standard Plate Count (SPC) of all the samples decreased significantly (p<0.01) during storage period of 60 days. A progressive reduction in the SPC of all samples may be due to destruction of microorganisms at low temperature storage. Interaction between treatment and storage was found to be significant (p<0.05). The decline in microbial count during storage could mainly be due to ice crystal formation (Davidson et al. 2000) that damaged the cell wall of microorganisms leading to lysis of cell. The other reason might be the accumulation of toxic metabolites which could further enhance cell lysis by feedback exhibition. The results were within the acceptable range as per ISI specification i.e. 250 log10cfu/ml max (De 1997). Lee and White (1991) also observed a decline in standard plate count of ice cream samples during storage. The yeast and mould count was non detectable in all ice cream samples throughout the 60 days of storage. The growth of psychrophillic bacteria was not observed in all samples during first 30 days of storage period. Thereafter, very few colonies were observed. With further progress in the storage period its count increased from 3.97 to 4.01 log10cfu/ml in control ice cream being higher than other samples. Interaction between treatment and storage was found to be significant (p<0.01).
IV. Conclusion
Results of the present study indicated that with progress in the storage period, total solid content in all samples increased due to loss of moisture during the storage of ice cream while no change in , protein, fibre and ash content was observed during this period. Acidity of all ice cream samples increased due to formation of lactic acid and pH, antioxidant activity and total phenolic content were found to reduce with progress in the storage. Increase in the storage time results in decreased overrun and L values of all samples. Sensory scores of all ice cream samples were found to decrease progressively with storage. First dripping time increased and melting rate decreased. SPC in all samples decreased and psychrophillic count increased with increase in storage period of ice cream.
5. Arashdeep Singh et al Int. Journal of Engineering Research and Applications www.ijera.com
ISSN : 2248-9622, Vol. 4, Issue 8( Version 5), August 2014, pp.80-90
www.ijera.com 84 | P a g e
Table 1: Effect of storage on total solids, protein, fibre and ash content of bakery flavoured ice cream ** Significant at p<0.01, ND: Non Detectable
Table 2: Effect of storage on acidity, pH, antioxidant activity and total phenolic content of bakery flavoured ice cream
Ice cream type
Storage period (days)
0
15
30
45
60
Acidity ,% Lactic acid
Control
0.171
0.173
0.175
0.179
0.182
Plain cookies (10%)
0.164
0.165
0.168
0.171
0.173
Chocolate cookies (10%)
0.161
0.164
0.166
0.169
0.171
Vanilla cake (10%)
0.156
0.158
0.161
0.162
0.164
Chocolate cake (10%)
0.158
0.159
0.162
0.165
0.167
pH
Control
6.62
6.61
6.60
6.60
6.59
Plain cookies (10%)
6.64
6.64
6.63
6.63
6.63
Chocolate cookies (10%)
6.65
6.65
6.64
6.64
6.63
Vanilla cake (10%)
6.68
6.67
6.67
6.65
6.64
Chocolate cake (10%)
6.67
6.67
6.66
6.64
6.63
Antioxidant activity, % inhibition of DPPH
Ice cream type
Storage period (days)
0
15
30
45
60
Total solid content, %
Control
37.49
37.72
37.98
38.25
38.59
Plain cookies (10%)
41.87
42.14
42.37
42.71
43.04
Chocolate cookies (10%)
42.28
42.59
42.85
43.14
43.49
Vanilla cake (10%)
39.89
40.19
40.58
40.92
41.24
Chocolate cake (10%)
40.04
40.28
40.71
41.07
41.42
Protein, %
Control
5.34
5.34
5.33
5.33
5.33
Plain cookies (10%)
5.60
5.60
5.60
5.60
5.59
Chocolate cookies (10%)
5.68
5.68
5.68
5.68
5.67
Vanilla cake (10%)
5.75
5.75
5.75
5.75
5.74
Chocolate cake (10%)
5.79
5.79
5.79
5.79
5.78
Fibre, %
Control
ND
ND
ND
ND
ND
Plain cookies (10%)
0.113
0.113
0.113
0.113
0.112
Chocolate cookies (10%)
0.156
0.156
0.156
0.156
0.156
Vanilla cake (10%)
0.093
0.093
0.093
0.093
0.093
Chocolate cake (10%)
0.095
0.095
0.095
0.095
0.095
Ash, %
Control
0.729
0.729
0.731
0.731
0.730
Plain cookies (10%)
0.758
0.759
0.761
0.761
0.762
Chocolate cookies (10%)
0.761
0.761
0.762
0.763
0.764
Vanilla cake (10%)
0.745
0.746
0.747
0.747
0.749
Chocolate cake (10%)
0.751
0.752
0.753
0.753
0.756
ANOVA
Source df
MSS
Total solids
Protein
Fibre
Ash
Treatment (T) 4
55.31**
0.495**
0.048**
0.0026**
Storage (S) 4
3.65**
0.00028
0.000030
0.000027
T X S 16
0.142
0.000045
0.000029
0.0000016
Error 50
0.246
0.00000001
0.000029
0.000035
6. Arashdeep Singh et al Int. Journal of Engineering Research and Applications www.ijera.com
ISSN : 2248-9622, Vol. 4, Issue 8( Version 5), August 2014, pp.80-90
www.ijera.com 85 | P a g e
Control
15.01
14.71
14.44
13.04
12.80
Plain cookies (10%)
21.57
21.25
20.98
19.64
18.03
Chocolate cookies (10%)
26.05
25.69
25.34
24.56
23.81
Vanilla cake (10%)
19.43
19.07
18.56
17.97
17.25
Chocolate cake (10%)
25.83
25.32
24.79
24.32
23.74
Phenol content, mg/100 g GAE
Control
ND
ND
ND
ND
ND
Plain cookies (10%)
0.089
0.088
0.086
0.085
0.084
Chocolate cookies (10%)
1.764
1.762
1.760
1.558
1.758
Vanilla cake (10%)
0.101
0.100
0.097
0.096
0.094
Chocolate cake (10%)
1.674
1.673
1.670
1.669
1.669
ANOVA
Source df
MSS
Acidity
pH
Antioxidant activity
Total phenolic content
Treatment (T) 4
0.00055**
0.0059**
322.53**
12.05**
Storage (S) 4
0.00021**
0.0010**
15.03**
0.0053
T X S 16
0.0000013
0.00037**
0.30**
0.0047
Error 50
0.0000043
0.000049
0.0022
0.0046
**Significant at p<0.01, ND: NonDetectable Table 3: Effect of storage on overrun and specific gravity of bakery flavoured ice cream
Ice cream type
Storage period (days)
0
15
30
45
60
Overrun, %
Control
62.49
61.58
60.81
60.30
59.72
Plain cookies (10%)
54.07
53.23
52.62
51.99
51.27
Chocolate cookies (10%)
53.26
52.45
51.60
50.94
50.51
Vanilla cake (10%)
47.89
47.27
46.59
45.82
45.16
Chocolate cake (10%)
46.45
45.75
44.78
44.32
43.84
Specific gravity
Control
0.555
0.587
0.590
0.612
0.619
Plain cookies (10%)
0.558
0.590
0.593
0.615
0.622
Chocolate cookies (10%)
0.561
0.593
0.597
0.618
0.626
Vanilla cake (10%)
0.563
0.595
0.599
0.602
0.609
Chocolate cake (10%)
0.565
0.598
0.601
0.624
0.630
ANOVA
Source
df
MSS
Overrun
Specific gravity
Treatment (T)
4
591.07**
0.000304**
Storage (S)
4
17.72**
0.0084**
T X S
16
0.0183
0.000065*
Error
50
0.707
0.000029
*Significant at p<0.05 **Significant at p<0.01
7. Arashdeep Singh et al Int. Journal of Engineering Research and Applications www.ijera.com
ISSN : 2248-9622, Vol. 4, Issue 8( Version 5), August 2014, pp.80-90
www.ijera.com 86 | P a g e
Table 4: Effect of storage on colour attributes (L, a and b values) of bakery flavoured ice cream
Ice cream type
Storage period (days)
0
15
30
45
60
L value
Control
68.74
68.65
68.47
68.36
68.11
Plain cookies (10%)
50.11
49.94
49.72
49.58
49.31
Chocolate cookies (10%)
41.87
41.76
41.68
41.49
41.32
Vanilla cake (10%)
49.32
49.21
48.97
48.71
48.64
Chocolate cake (10%)
42.97
42.84
42.69
42.57
42.31
a value
Control
-1.48
-1.41
-1.34
-1.27
-1.21
Plain cookies (10%)
-0.18
-0.14
-0.06
0.01
0.04
Chocolate cookies (10%)
1.12
1.13
1.17
1.21
1.26
Vanilla cake (10%)
0.83
0.87
0.94
0.97
1.03
Chocolate cake (10%)
0.33
0.35
0.38
0.42
0.44
b value
Control
3.74
3.79
3.86
3.91
3.97
Plain cookies (10%)
5.38
5.40
5.41
5.44
5.46
Chocolate cookies (10%)
4.02
3.37
3.40
3.41
3.44
Vanilla cake (10%)
5.73
5.74
5.77
5.79
5.81
Chocolate cake (10%)
3.75
3.72
3.68
3.66
3.61
ANOVA
**Significant at p<0.01
Table 5: Effect of storage on mean sensory scores of bakery flavoured ice cream
Ice cream type
Storage period (days)
0
15
30
45
60
Appearance / colour
Control
8.00
7.75
7.38
7.38
7.00
Plain cookies (10%)
8.50
8.38
8.19
8.13
7.25
Chocolate cookies (10%)
8.88
8.75
7.83
7.61
7.13
Vanilla cake (10%)
8.75
8.25
8.06
7.75
6.88
Chocolate cake (10%)
8.75
8.63
7.88
7.44
7.00
Body and texture
Control
8.13
7.94
7.63
7.50
7.13
Plain cookies (10%)
8.44
8.25
7.88
7.75
7.21
Chocolate cookies (10%)
8.63
8.31
8.00
7.88
7.44
Vanilla cake (10%)
8.50
8.38
7.75
7.63
6.81
Chocolate cake (10%)
8.63
8.38
7.94
7.25
7.06
Mouthfeel
Control
8.00
7.63
7.44
7.31
6.75
Plain cookies (10%)
8.56
8.25
8.06
7.69
7.19
Chocolate cookies (10%)
8.63
8.44
8.13
7.81
7.13
Vanilla cake (10%)
8.38
8.13
7.50
7.38
6.56
Chocolate cake (10%)
8.63
8.25
7.88
7.31
6.25
Flavour
Control
7.50
7.25
7.13
6.94
6.81
Plain cookies (10%)
8.25
8.13
7.88
7.50
7.13
Chocolate cookies (10%)
8.75
8.47
8.22
8.13
7.69
Vanilla cake (10%)
8.38
8.19
7.81
7.94
7.06
Chocolate cake (10%)
8.63
8.50
7.88
7.69
7.38
Overall acceptability
Source
df
MSS
L
a
b
Treatment (T)
4
1727.86**
14.88**
16.73**
Storage (S)
4
0.921**
0.088**
0.031
T X S
16
0.0604
0.0021
0.059
Error
50
0.0561
0.0013
0.053
8. Arashdeep Singh et al Int. Journal of Engineering Research and Applications www.ijera.com
ISSN : 2248-9622, Vol. 4, Issue 8( Version 5), August 2014, pp.80-90
www.ijera.com 87 | P a g e
Control
7.91
7.64
7.39
7.28
6.92
Plain cookies (10%)
8.47
8.22
8.00
7.72
7.21
Chocolate cookies (10%)
8.72
8.49
7.99
7.91
7.54
Vanilla cake (10%)
8.50
8.23
7.78
7.67
6.88
Chocolate cake (10%)
8.66
8.44
7.89
7.42
6.92
ANOVA
MSS
Source
df
Appearance/ colour
Body and texture
Mouthfeel
Flavour
Overall acceptability
Treatment (T)
4
2.16
0.855*
2.53**
7.09**
2.56**
Storage (S)
4
14.13**
10.52**
16.36**
7.15**
14.31**
T X S
16
0.478
0.24
0.313
0.179
0.483
Error
175
0.463
0.277
0.364
0.307
0.431
*Significant at p<0.05, **Significant at p<0.01 Table 6: Effect of storage on microbiological quality of bakery flavoured ice cream
Ice cream type
Storage period (days)
0
15
30
45
60
Standard plate count, log10cfu/ml
Control
5.39
5.29
5.08
4.92
4.78
Plain cookies (10%)
5.40
5.28
5.12
4.97
4.83
Chocolate cookies (10%)
5.41
5.30
5.17
5.00
4.84
Vanilla cake (10%)
5.43
5.34
5.23
5.10
4.95
Chocolate cake (10%)
5.42
5.30
5.19
5.02
4.87
Yeast and mould count, log10cfu/ml
Control
ND
ND
ND
ND
ND
Plain cookies (10%)
ND
ND
ND
ND
ND
Chocolate cookies (10%)
ND
ND
ND
ND
ND
Vanilla cake (10%)
ND
ND
ND
ND
ND
Chocolate cake (10%)
ND
ND
ND
ND
ND
Psychrophillic count, log10cfu/ml
Control
ND
ND
ND
3.97
4.02
Plain cookies (10%)
ND
ND
ND
3.78
3.86
Chocolate cookies (10%)
ND
ND
ND
3.82
3.90
Vanilla cake (10%)
ND
ND
ND
3.90
3.97
Chocolate cake (10%)
ND
ND
ND
3.85
3.92
ANOVA
Source
df
MSS
SPC
Psychrophillic
Treatment (T)
4
0.0297**
0.0099**
Storage (S)
4
0.751**
3.655**
T X S
16
0.00215*
0.0038**
Error
50
0.00199
0.00018
*Significant at p<0.05, **Significant at p<0.01, ND: Non Detectable
9. Arashdeep Singh et al Int. Journal of Engineering Research and Applications www.ijera.com
ISSN : 2248-9622, Vol. 4, Issue 8( Version 5), August 2014, pp.80-90
www.ijera.com 88 | P a g e
Fig. 1:Effect of storage on first dripping time of bakery flavoured ice cream
Fig 2: Effect of storage on the meltdown rate of bakery flavoured ice cream
REFERENCES
[1] Abdullah M, Rehman S, Zubair H, Saeed H M, Kousar S and Shahid M (2003) Effect of skim milk in soymilk blend on the quality of ice cream. Pakistan J Nutr 2:305-311
[2] Akesowan A (2008) Effect of combined stabilizers containing Konjac flour and κ- carrageenan on ice cream. Australian J Technol 12:81-85
2
4
6
8
10
12
14
16
18
0
15
30
45
60
First drip time, min
Storage period, days
Control
Plain cookies (10%)
Chocolate cookies (10%)
Vanilla cake (10%)
Chocolate cake (10%)
40
50
60
70
80
90
100
0
15
30
45
60
Melting rate, W/W%
Storage period, days
Control
Plain cookies (10%)
Chocolate Cookies (10%)
Vanilla cake (10%)
Chocolate cake (10%)
10. Arashdeep Singh et al Int. Journal of Engineering Research and Applications www.ijera.com
ISSN : 2248-9622, Vol. 4, Issue 8( Version 5), August 2014, pp.80-90
www.ijera.com 89 | P a g e
[3] AOAC (2000) Official Methods of Analysis. 17th Edition. Association of Official Analytical Chemists, Gathersberg, Maryland, USA
[4] APHA (1992) Compendium of Methods for the Microbiological Examination of Foods. 3rd Edition, American Public Health Association, Washington, D.C
[5] Arbuckle W S (1977) Ice Cream. AVI Publishing Company, Inc New York
[6] Bajwa UA, Huma N, EhsanB, Jabbar K and Khurrama A (2003) Effect of different concentration of strawberry pulp on the properties of ice cream. Intl J Agric Biol 5:635-637
[7] Bhattacharya M, Hanna MA, Mandigo RW (1988) Effect of frozen storage conditions onyields, shear strength and color of ground beef patties.J Food Sci 53:696-700
[8] Bureau of Indian Standards 1981. ISI Handbook of food analysis. IS : SP : 18 Part XI Dairy products. ManakBhawan, New Dehli
[9] Butt MS, Ahmad I, Mahmood S and Shahzadi N (1999) Effect of different combinations of stabilizers/emulsifiers on the quality of ice cream. Pakistan J Agric Sci 36:70-73
[10] Buyck JR, Baer RJ and Choi J (2010) Effect of storage temperature on quality of light and full fat ice cream. J Dairy Sci 94:2213– 2219
[11] Davidson RH, Duncan SE, Hackney CR, Eigel WN and Boling JW (2000) Probiotic culture survival and implications in fermented frozen yogurt characteristics. J Dairy Sci 83:666- 673
[12] De S (1997) Outlines of Dairy Technology. Oxford University Press, New Delhi, p 182- 183
[13] Dolan KD, Singh RP and Wells JH (1985) Evaluation of time-temperature related quality changes in ice cream during storage. J Food Process Preser 9:253–271
[14] Earl FA and Tracy PH (1960) The importance of temperature in the storage of ice cream. Ice Cream Trade J. 56:36-42
[15] Frost MB, Heymann H, Bredie WLP, Dijksterhuis GB and Martens M (2005) Sensory measurement of dynamic flavour intensity in ice cream with different fat levels and flavourings. Food Quality Preference. 16:305–314
[16] Goff HD, Caldwell KB, Stanley DW and Maurice TJ (1993) The influence of polysaccharides on the glass transition in frozen sucrose solutions and ice cream. J Dairy Sci. 76:1268–1277
[17] Guner A, Ardic M, Keles A and Dogruer Y (2007) Production of yogurt ice cream at different acidity. Intl J Food Sci Technol 42:948–952.
[18] Guzeler N, Kacar A and Say D (2011) Effect of milk powder, maltodextrin and ploydextrose use on physical and sensory properties of low calorie ice cream during storage. Academic Food J 9:6-12
[19] Guzeler N, Kacar A, Keceli1 T and Say D (2012) Effect of different stabilizers, emulsifiers and storage time on someproperties of ice cream. Academic Food J 10:26-30
[20] Hegenbart S (1991) Flavor levels: A logical approach. Food Product Design 1:33–42
[21] Kaur D, Wani AA, Singh DP and Sogi DS (2011) Shelf life enhancement of butter, ice cream, and mayonnaise by addition of lycopene. Intl J Food Prop, 14:1217–1231,
[22] Koxholt MMR, Eisenmann B and Hinrichs J (2001) Effect of the fat globule sizes on the meltdown of ice cream. J Dairy Sci 84:31-37
[23] Larmond E (1970) Methods of sensory evaluation of food. Can Deptt. Agric Pubs 1284
[24] Lee FY and White CH (1991) Effect of ultra filteration retentates and whey protein concentrates on ice cream quality during storage. J Dairy Sci 74:1170-1180
[25] Mahran GA, Alomy EHA, Bagoury EEH and Sayed AF (1987) Effect of storage temperature of milk fat on ice cream quality. Egyptian J Food Sci 15:65-73
[26] Marshall RT and Arbuckle WS (1996) Ice Cream. 5thed. Chapman and Hall, Int. Thompson Publ, New York, p 263–268
[27] Marshall RT, Goff HD and Hartel RW (2003) Ice Cream.Kluwer Academic Press, New York, p 56-59
[28] Murtaza MA, Din MU, Huma GN, Shabbir MA and MahmoodS (2004a) Quality evaluation of ice cream prepared with different stabilizers/emulsifier blends. Intl J Agric Biol 6:65–67
[29] Murtaza MA, Huma GN. Din MU, Shabbir MA and Mahmood SD (2004b) Effect of fat replacement by fig addition on ice cream quality. Intl J Agric Biol 6:68–70
[30] Patthamakanokporn O, Puwastien P, Nitithamyong A and Sirichakwal P P (2008) Changes of antioxidant activity and total phenolic compounds during storage of selected fruits. J Food Composition Analysis 21: 241–248
[31] Potter NN and Hotchkiss JH (1995) Food Science. 5th Edition, CBS Publishers, New Delhi, India, p 292-300
11. Arashdeep Singh et al Int. Journal of Engineering Research and Applications www.ijera.com
ISSN : 2248-9622, Vol. 4, Issue 8( Version 5), August 2014, pp.80-90
www.ijera.com 90 | P a g e
[32] Sakurai KS, Hakamata KK, Tomita M and Yoshida S (1996) Effect of production conditions on ice cream melting resistance and hardness. Milchwissenschaft 51:451- 454
[33] Shimada K, Fujikawa K, Yahara K Nakamura T (1992) Antioxidative properties of xanthin on autooxidation of soybean oil in cyclodextrin emulsion. J Agric Food Chem 40:945-948
[34] Siddiique MI, Mukhtar M, Rwhman S and A wan JA (1988) Use of guar gum as a stabilizer in ice cream. Sci Technol Dev 7:10-14
[35] Singh J, Minhas KS and Bajwa U (2006) Studies on the preparation and shelf life of yoghurt ice cream. J Food Sci Technol 43:656-661 [36] Swain T and Hillis WE (1959) The phenolic constituents of prunusdomestica in the quantitative analysis of phenolic constituents. J Sci Food Agric 10:63-68
[37] Winton A L (1958) Analysis of Foods. John Wiley and Sons Inc, New York, p 78-80