SlideShare a Scribd company logo
International Journal of Computer Science & Information Technology (IJCSIT) Vol 7, No 3, June 2015
DOI:10.5121/ijcsit.2015.7310 115
MULTI-PARAMETER BASED PERFORMANCE
EVALUATION OF CLASSIFICATION ALGORITHMS
Saurabh Kr. Srivastava1
and Sandeep Kr. Singh2
1
Research Scholar, Department of Computer Sc. & Engineering, JIIT University, Noida,
India
2
Assistant Professor, Department of Computer Sc. & Engineering, JIIT University, Noida,
India
ABSTRACT
Diabetes disease is amongst the most common disease in India. It affects patient’s health and also leads to
other chronic diseases. Prediction of diabetes plays a significant role in saving of life and cost. Predicting
diabetes in human body is a challenging task because it depends on several factors. Few studies have
reported the performance of classification algorithms in terms of accuracy. Results in these studies are
difficult and complex to understand by medical practitioner and also lack in terms of visual aids as they are
presented in pure text format. This reported survey uses ROC and PRC graphical measures to improve
understanding of results. A detailed parameter wise discussion of comparison is also presented which lacks
in other reported surveys. Execution time, Accuracy, TP Rate, FP Rate, Precision, Recall, F Measure
parameters are used for comparative analysis and Confusion Matrix is prepared for quick review of each
algorithm. Ten fold cross validation method is used for estimation of prediction model. Different sets of
classification algorithms are analyzed on diabetes dataset acquired from UCI repository.
KEYWORDS
Data mining, Diabetes, UCI repository, Machine Learning.
1. INTRODUCTION AND LITERATURE REVIEW
Diabetes invites other chronic diseases. It is primarily associated with an increase of blood
glucose. Two common categories of diabetes are Type-1 and Type-2. Type-1 diabetes occurs
when pancreas fails to produce sufficient insulin while Type-2 occurs when body cannot
effectively consume the insulin produced. Diabetes confirmation requires a lot of examination
that affects time and cost both. Prior studies show that classification algorithms have been
effectively used in prediction of diabetes.
Several studies and results are reported using data mining techniques in healthcare for
classification in medical databases. In the context of that J.W.Smith et al.[1] have introduced
adaptive learning routine that executes digital analogy of perceptions called ADAP. The algorithm
uses 576 training instances and classification accuracy is 76% on the remaining 192 instances.
K.Srinivas et al.[4] studied the applications of Data mining Techniques in healthcare and have
reported prediction of heart attacks using clinical database. Elmakolce et al.[5] has given the
glimps of different data mining techniques utilization. Asha Rajkumar et al.[2] and A.Khemphlila
et al.[3] discussed various data mining techniques for diagnosis of certain life threatening diseases.
HuyNguyen A.P. et al.[6] proposed a new Homogeneity-Based Algorithm that determines over
fitting and over generalization behavior of classification. Recently K.R. Lakshmi et al.[10] and
Karthikeyini.V. et.al [8,9] discussed data mining algorithms performance based upon their
computing time, and precision value.
International Journal of Computer Science & Information Technology (IJCSIT) Vol 7, No 3, June 2015
116
The data mining techniques aims to extract the hidden information from large dataset and
transform it into knowledge patterns for further use that can be easily understood by human. A
model is an example of structure which is based upon predicted data. The paper uses ROC and
PRC graphical measures to visualize the results that makes data easy to understand by medical
practitioners. Execution time, Accuracy, TP Rate, FP Rate, Precision, Recall, and F Measure
parameters are used for comparative analysis.
We have described the results of experiments in which categorical (Tree, Function, Rule &
Bayesian) algorithms are used for performance evauation. The paper is organized as follows: in
section 2 we described the algorithms which are used for performance evaluation; in section 3 we
discussed the measures on which result is obtained; in section 4 we explained about the
experimental setup, data set and result evaluation process; in section 5 & 6 we described the result
and discussion on evaluated results; finally, in section 7 we presented our conclusion.
2. ALGORITHMS USED FOR RESULT EVALUATION
2.1. Decision Tree Based Classification
Decision Tree maps observation to conclusion in the form of target values. Decision tree separates
input space of a data set into mutually exclusive regions. Each of which is assigned to a label, a value
or an action to characterize its data points.Two variants: J48 and RandomTree are discussed in
subsections.
2.1.1. J48: A decision tree is a graphical representation which consist of internal and external
nodes connected by branches. Internal node is responsible for implementing decision functions,
that determines which node to visit next. The external node, has no child node and it is
associated with a value that characterizes the given data which leads to its being visited.
Decision tree construction algorithms involve a two-step process. First- growing, Second-pruning.
The growing process sets up a very large decision tree and pruning process reduces the large size
and overfiting of the data. The pruned decision tree that is used for classification is called as
classification tree [19]. A J48 decision tree is a predictive machine-learning model that decides
the target value (dependent variable) of a new sample based on various attribute values of the
available data. The nodes of a J48 decision tree denote the different attributes. Branches between
the nodes tell us the possible values that these attributes can have in the observed samples. To
build a decision tree, we need to calculate the entropy and information gain [18].
Entropy: E(S)=∑ -pi log2pi (Where ∑ varies from i=1 to c)
Information Gain: Gain (T, X) = Entropy (T) – Entropy (T,X).
2.1.2. Random Tree: It is the simplest tree algorithm that comes as a result of stochastic process.
Random binary tree refers system model that selects random values over time. Two different
distributions are commonly used for Random Tree formation: 1) Inserting nodes one at a time
according to a random permutation. 2) Chosing from a uniform discrete distribution. Repeated
splitting is another distribution to form the random tree. Adding and removing nodes directly in a
random binary tree will generaly disrupt its random structure. In order to balance the nodes of
Random Trees, random permutation are used for dynamic insertion and deletion of nodes.
2.2. Function Based Classification
It’s a mathematical classification (or statistical procedure) to classify an instance in a particular class.
International Journal of Computer Science & Information Technology (IJCSIT) Vol 7, No 3, June 2015
117
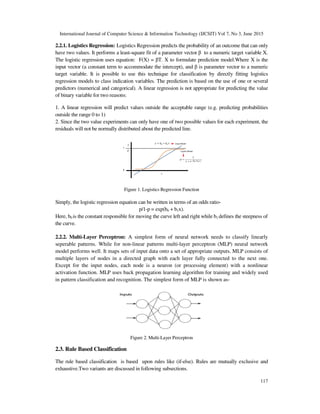
2.2.1. Logistics Regression: Logistics Regression predicts the probability of an outcome that can only
have two values. It performs a least-square fit of a parameter vector β to a numeric target variable X.
The logistic regression uses equation: F(X) = βT. X to formulate prediction model.Where X is the
input vector (a constant term to accommodate the intercept), and β is parameter vector to a numeric
target variable. It is possible to use this technique for classification by directly fitting logistics
regression models to class indication variables. The prediction is based on the use of one or several
predictors (numerical and categorical). A linear regression is not appropriate for predicting the value
of binary variable for two reasons:
1. A linear regression will predict values outside the acceptable range (e.g. predicting probabilities
outside the range 0 to 1)
2. Since the two value experiments can only have one of two possible values for each experiment, the
residuals will not be normally distributed about the predicted line.
Figure 1. Logistics Regression Function
Simply, the logistic regression equation can be written in terms of an odds ratio-
p/1-p = exp(b0 + b1x).
Here, b0 is the constant responsible for moving the curve left and right while b1 defines the steepness of
the curve.
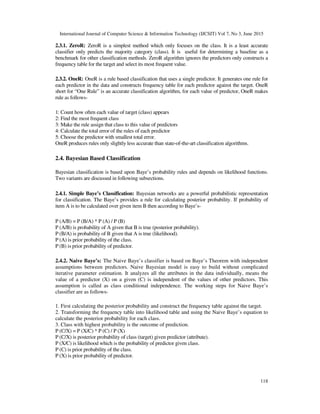
2.2.2. Multi-Layer Perceptron: A simplest form of neural network needs to classify linearly
seperable patterns. While for non-linear patterns multi-layer perceptron (MLP) neural network
model performs well. It maps sets of input data onto a set of appropriate outputs. MLP consists of
multiple layers of nodes in a directed graph with each layer fully connected to the next one.
Except for the input nodes, each node is a neuron (or processing element) with a nonlinear
activation function. MLP uses back propagation learning algorithm for training and widely used
in pattern classification and recognition. The simplest form of MLP is shown as-
Figure 2. Multi-Layer Perceptron
2.3. Rule Based Classification
The rule based classification is based upon rules like (if-else). Rules are mutually exclusive and
exhaustive.Two variants are discussed in following subsections.
International Journal of Computer Science & Information Technology (IJCSIT) Vol 7, No 3, June 2015
118
2.3.1. ZeroR: ZeroR is a simplest method which only focuses on the class. It is a least accurate
classifier only predicts the majority category (class). It is useful for determining a baseline as a
benchmark for other classification methods. ZeroR algorithm ignores the predictors only constructs a
frequency table for the target and select its most frequent value.
2.3.2. OneR: OneR is a rule based classification that uses a single predictor. It generates one rule for
each predictor in the data and constructs frequency table for each predictor against the target. OneR
short for “One Rule” is an accurate classification algorithm, for each value of predictor, OneR makes
rule as follows-
1: Count how often each value of target (class) appears
2: Find the most frequent class
3: Make the rule assign that class to this value of predictors
4: Calculate the total error of the rules of each predictor
5: Choose the predictor with smallest total error.
OneR produces rules only slightly less accurate than state-of-the-art classification algorithms.
2.4. Bayesian Based Classification
Bayesian classification is based upon Baye’s probability rules and depends on likelihood functions.
Two variants are discussed in following subsections.
2.4.1. Simple Baye’s Classification: Bayesian networks are a powerful probabilistic representation
for classification. The Baye’s provides a rule for calculating posterior probability. If probability of
item A is to be calculated over given item B then according to Baye’s-
P (A/B) = P (B/A) * P (A) / P (B)
P (A/B) is probability of A given that B is true (posterior probability).
P (B/A) is probability of B given that A is true (likelihood).
P (A) is prior probability of the class.
P (B) is prior probability of predictor.
2.4.2. Naive Baye’s: The Naive Baye’s classifier is based on Baye’s Theorem with independent
assumptions between predictors. Naive Bayesian model is easy to build without complicated
iterative parameter estimation. It analyzes all the attributes in the data individually, means the
value of a predictor (X) on a given (C) is independent of the values of other predictors. This
assumption is called as class conditional independence. The working steps for Naive Baye’s
classifier are as follows-
1. First calculating the posterior probability and construct the frequency table against the target.
2. Transforming the frequency table into likelihood table and using the Naive Baye’s equation to
calculate the posterior probability for each class.
3. Class with highest probability is the outcome of prediction.
P (C/X) = P (X/C) * P (C) / P (X)
P (C/X) is posterior probability of class (target) given predictor (attribute).
P (X/C) is likelihood which is the probability of predictor given class.
P (C) is prior probability of the class.
P (X) is prior probability of predictor.
International Journal of Computer Science & Information Technology (IJCSIT) Vol 7, No 3, June 2015
119
3. MEASURES ON WHICH RESULT IS OBTAINED
3.1. Execution Time: The time taken by the tool to execute and evaluate an algorithm.
3.2. Accuracy: Accuracy defines percentage of correctly classified instances from the test set by the
classifier.
3.3. TP Rate: True Positive rate is proportion of examples which were classified as a class X among
all examples which truly have the X class. This shows how much the part of the class is truly captured.
3.4. FP Rate: False Positive is the proportion of the examples which were incorrectly identified and
belong to another class.
3.5. Precision: Precision is the proportion of examples which truly have class X among all those
which were classified as X. It is a measure of exactness. Positive predictive value is called as
precision.
PPV= TP/TP+FP
3.6. Recall: Recall is the proportion of examples which were classified as class X among all examples
which truely have class X. It is a measure of completeness. Negative predictive value is called as
recall.
NPV= TP/TP+FN
3.7. F Measure: F measure is aggregate of precision and recall, The formula is defined as: 2 *
Precision * Recall / Precision + Recall.
3.8. ROC Area: ROC is comparison of two operating characteristics TPR and FPR. It is also
known as a receivers operating characteristic curve. A receiver operating characteristic curve is
a graphical measure which interprets the performance of a classifier as its discrimination
threshold is varied. It is an outcome of plotting the true positive rate vs. false positive rate at
various threshold settings. True positive rate is fraction of true positives out of the total actual
positives while the fraction of false positives out of the total actual negatives indcates false
positive rate. The point in threshold curve record various statistics such as true positive, false
positive etc. The curves are generated by sorting the prediction produced by the classifier in
descending order of probability it assigns to the positive class. The formula is defind as:
ROC Area: TP Rate= TP/TP+FN*100, FP Rate= FP/FP+TN*100.
3.9. PRC Area: The PRC is known as precision recall characteristics curve. It is a comparison
of two operating characteristics (PPV and sensitivity) as the criterion changes. A precision
recall curve or PRC curve is a graphical plot which illustrates the performance of binary
classifiers as its discrimination threshold is varied. PPV is fraction of true positives out of test
outcomes positive. While sensitivity is fraction of true positive out of conditions positive.
3.10. Confusion Matrix: It is also called as contingency table. In our case the result is in two classes
so it is 2 X 2 confusion matrix. Number of correctly classified instances are diagonal in the matrix and
others are incorrectly classified.
4. EXPERIMENTAL SETUP
[20] Weka environment is a popular suit of machine learning written in java developed at the
university of Waikato, New Zealand. It provides GUI to its user. Weka provides a wide range of
uni and multivariate parametric and non parametric tests. It is having list of feature selection
International Journal of Computer Science & Information Technology (IJCSIT) Vol 7, No 3, June 2015
120
techniques. Weka supports data preprocessing, clustering, classifications, regression,
visualization, and feature selection.
4.1 Data Source
To evaluate and analyze data mining classification algorithms UCI Diabetes data set is used this
data set have nine attributes and 768 instances.
Table 1. Data Descriptiion
S.No. Name Description
1. Pregnancy Number of times pregnant
2. Plasma Plasma glucose concentration a 2 hours in an oral glucose tolerance test.
3. Pres Diastolic blood pressure (mm Hg)
4. Skin Triceps skin fold thickness (mm)
5. Insulin 2-Hour serum insulin (mu U/ml)
6. Mass Body mass index (weight in kg/(height in m2)
7. Pedi Diabetes pedigree function
8. Age Age(in years)
9. Class Class variable (False or True)
4.2. Result Evaluation
Sets of algorithms (Tree, Function, Rule & Bayesian) used for performance evaluation in terms of
their Execution time, Accuracy, Precision, Recall, ROC and PRC. Followings are the steps taken up
for their evaluation.
Step 1
4.2.1. Pre-processing
During the pre-processing the dataset which is used for evaluation is processed using filters.
Basically, data pre-processing helps in removing out of range values, missing values, impossible
data combinations etc. The quality of data is first and foremost requirement before analysis. The
result of data preprocessing is the final training set. Preprocessing of data is done using
supervised filter discrete method [12].
Step 2
4.2.2. Training
During the training algorithms are applied to the data so that it learns well. A training set is used
along with a supervised learning method to train a knowledge dataset which can be further used
International Journal of Computer Science & Information Technology (IJCSIT) Vol 7, No 3, June 2015
121
by an artificial intelligence machine. Cross validation aims to test the model in training phase in
order to limiting the problems of data overfitting and gives an insight on how the model will
generalize to an independent data set.The 10 fold cross validation is used for classification of the
dataset.
Step 3
4.2.3. Testing
The purpose of testing is to validate whether the trained data correctly classifies the given dataset
or not. 10-fold cross validation signifies that the data is divided into 10 chunks and train 10 times,
treating treating a different chunk as the holdout set each time. Testing can be done on new data
as well as on the part of the dataset that has not been used for training. The aim in cross-validation
is to ensure that every example from the original dataset has the same chance of appearing in the
training and testing set [11].
5. RESULT
Execution Time, TP Rate, FP Rate, Precision, Recall, F Measure, Accuracy, ROC Area, PRC Area,
and Confusion Matrix are the measures used for performance evaluation.All algorithms discussed
for comparison are filtered to identify the effectiveness of their higher precision and higher
accuracy of classification. The overall performance evaluation table are given below.
Table 2. Performance Evaluation of classifiers
Acc. TP FP Pre. Recall F Mea. ROC PRC Confusion Matrix
TREE BASED CLASSIFICATION A B
J48 78.26 0.73 0.40 0.73 0.73 0.71 0.75 0.73
115 113 A True
52 448 B False
Random Tree 74.61 0.66 0.39 0.67 0.66 0.66 0.66 0.65
147 121 A True
140 360 B False
FUNCTION BASED CLASSIFICATION A B
Logistics 78.65 0.75 0.33 0.75 0.75 0.75 0.81 0.80
155 113 A True
77 423 B False
MLP 75.91 0.71 0.34 0.71 0.71 0.71 0.77 0.78
158 110 A True
110 390 B False
RULE BASED CLASSIFICATON A B
One R 74.74 0.73 0.39 0.72 0.73 0.72 0.67 0.66
125 143 A True
62 438 B False
Zero R 65.10 0.65 0.65 0.42 0.65 0.51 0.50 0.54
0 268 A True
0 500 B False
BAYES CLASSIFICATION A B
Baye’s 77.87 0.75 0.30 0.75 0.75 0.75 0.83 0.82
175 93 A True
99 401 B False
Naive Baye’s 77.87 0.75 0.30 0.75 0.75 0.75 0.83 0.82
172 96 A True
93 407 B False
International Journal of Computer Science & Information Technology (IJCSIT) Vol 7, No 3, June 2015
122
6. RESULT DISCUSSION
6.1. Computation Time
This measure depicts time taken by algorithm for result evaluation. In this ZeroR and Naive
Baye’s classifiers performs best among all.
Table 3. Computation time of classifiers
J48
Random
Tree
Logistics MLP OneR ZeroR Baye’s
Naive
Baye’s
Com.Time 130ms 50 ms 200 ms
3950
ms
20 ms
Less
than
10 ms
50 ms
Less
than
10 ms
6.2. Accuracy, Precision, Recall, TP & FP
Precision and accuracy are related terms. In statistics measuring the degree of closeness is
accuracy while precision is reproducibility (the degree to which repeated measurements under
unchanged conditions shows the same result). When a system contains systematic error increase
in sample size, increase in precision does not increase the accuracy. Eliminating the systematic
error improves accuracy but does not change precision. The evaluated results are as follows-
Table 4. Accuracy, Precision, Recall, TP & FP values
J48
Random
Tree
Logistics MLP OneR ZeroR Baye’s
Naive
Baye’s
Accuracy 78.26 74.61 78.65 75.91 74.74 65.10 77.87 77.87
Precision 0.726 0.666 0.747 0.714 0.724 0.424 0.751 0.753
Recall 0.733 0.66 0.753 0.714 0.733 0.651 0.75 0.754
TP 0.733 0.66 0.753 0.714 0.733 0.651 0.75 0.754
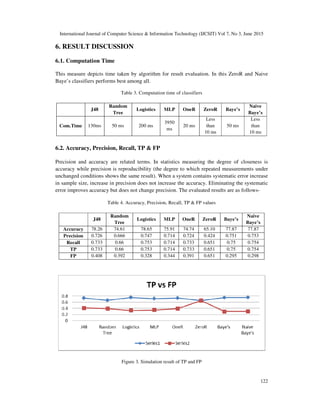
FP 0.408 0.392 0.328 0.344 0.391 0.651 0.295 0.298
Figure 3. Simulation result of TP and FP
International Journal of Computer Science & Information Technology (IJCSIT) Vol 7, No 3, June 2015
123
In the plotted diagram (Figure 3) Series 1 represents true positive value while Series 2 represents
false positive value, with the observation of the plotted data it is clearly visible that ZeroR
classifier having no impact on TP and FP for this dataset.
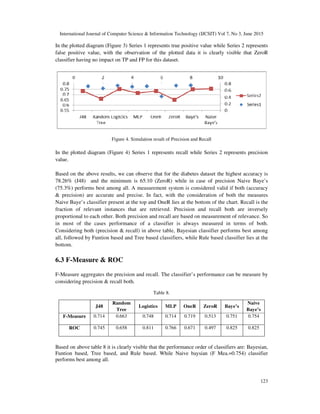
Figure 4. Simulation result of Precision and Recall
In the plotted diagram (Figure 4) Series 1 represents recall while Series 2 represents precision
value.
Based on the above results, we can observe that for the diabetes dataset the highest accuracy is
78.26% (J48) and the minimum is 65.10 (ZeroR) while in case of precision Naive Baye’s
(75.3%) performs best among all. A measurement system is considered valid if both (accuracy
& precision) are accurate and precise. In fact, with the consideration of both the measures
Naive Baye’s classifier present at the top and OneR lies at the bottom of the chart. Recall is the
fraction of relevant instances that are retrieved. Precision and recall both are inversely
proportional to each other. Both precision and recall are based on measurement of relevance. So
in most of the cases performance of a classifier is always measured in terms of both.
Considering both (precision & recall) in above table, Bayesian classifier performs best among
all, followed by Funtion based and Tree based classifiers, while Rule based classifier lies at the
bottom.
6.3 F-Measure & ROC
F-Measure aggregates the precision and recall. The classifier’s performance can be measure by
considering precision & recall both.
Table 8.
J48
Random
Tree
Logistics MLP OneR ZeroR Baye’s
Naive
Baye’s
F-Measure 0.714 0.663 0.748 0.714 0.719 0.513 0.751 0.754
ROC 0.745 0.658 0.811 0.766 0.671 0.497 0.825 0.825
Based on above table 8 it is clearly visible that the performance order of classifiers are: Bayesian,
Funtion based, Tree based, and Rule based. While Naive baysian (F Mea.=0.754) classifier
performs best among all.
International Journal of Computer Science & Information Technology (IJCSIT) Vol 7, No 3, June 2015
124
7. CONCLUSION
The aim of data mining algorithm is to get best among available. In this paper different sets (Tree,
Function, Rule & Bayesian) of classification algorithms are used for performance evaluation.
These algorithms are compared on the basis of execution time, TP Rate, FP Rate, Precision,
Recall, Accuracy, ROC and PRC. ROC and PRC are graphical representation used for ease of
understanding. Weka tool is used to evaluate and investigate the performance of four different
categories of classifiers. The raw numbers are shown in the confusion matrix (Table 2), with A
and B representing the class labels. Here in the experiment we are using 768 instances, so the
percentages and raw numbers add up comes out AA+BB, AB+BA.The percentage of correctly
classified instances is often called accuracy. We compare all the parameters and found that Naive
bayes classifier performs best among all while ZeroR classifier only provides benchmark for
classification. ROC and PRC graphical measures are used for quick review of all classifiers.
According to the result the performance order (highest to lowest) of the algorithms are:
Bayesian, Function, Tree and Rule.
8. FUTURE WORK
Validataion of results using other datasets is required before generalizing result findings.
REFERENCES
[1] Smith, J., W., Everthart, J.,E., Dickson, W.,C., Knowler, W.,C. and Johannes, R.,S.,Using the ADAP
learning algorithm to forecast the onset of diabetes mellitus, in Proceedings of the Symposium on
Computer Applications and Medical Care, IEEE Computer Society Press, 1988, pp. 261-265
[2] Asha Rajkumar,Sophia Reena.G., “Diagnosis of Heart Disease Using Data Mining Algorithm”,
Global Journal of Computer Sci- ence and Technology, Vol-10, 2010, pp. 38-46.
[3] A.Khemphila,V.Boojing, “Comparing Performance of logistic regression,decision tree and neural
network for classifying heart disease patients”, Proceeding of International conference on Com- puter
Information System and Industrial Management Application, 2010, pp.193-198.
[4] K.Srinivas, B.Kavitha Rani,A.Govrdhan, Applications of Data Mining Techniques in +health care and
Prediction Heart Attacks, International Journal on Computer Science and Engineering (IJCSE), vol.II,
2010, pp.250-255.
[5] Elma kolce (cela), Neki Frasheri, “A Literature Review of Data Mining Techniques used in
Healthcare Databases”, ICT Innova- tions 2012 Web Proceedings-Poster Session.
[6] Huy Nguyen Anh Pham and Evangelos Triantaphyllou “Prediction of Diabetes by Employing a New
Data Mining Approach Which Balances Fitting and Generalization” Department of Computer
Science, 298 Coates Hall, Louisiana State University, Baton Rouge, LA 70803.
[7] Ms.S.Sapna, Dr.A.Tamilarasi “Data mining – Fuzzy Neural Ge- netic Algorithm in predicting
diabetes” Department Of Com- puter Applications (MCA), K.S.R College of Engineering “BOOM
2K8”, Research Journal on Computer Engineering, March 2008.
[8] Karthikeyini.V., Pervin begum.I., “Comparison a performance of data mining algorithms (CPDMA)
in prediction of Diabetes Disease”, International journal of Computer Science and Engineer- ing,
Vol.5, No. 03, March 2013, pp. 205-210.
[9] Karthikeyini.V., Pervin begum.I., Tajuddin.K., Shahina Begum, “Comparative of data mining
classification algorithm (CDMCA) Diabetes Disease Prediction”, International journal of Computer
Applications, Vol.60, No. 12, Dec. 2012, pp. 26-31
[10] K.R. Lakshmi and S. Prem Kumar, Utilization of Data Mining Techniques for Prediction of Diabetes
Disease Survivability. IJSER, Vol. 4, Issue 6, June 2013.
[11] http://www.sussex.ac.uk/Users/christ/crs/ml/lec03a.html
[12] http:// weka.sourceforge.net/doc.dev/weka/filters/supervised/
[13] http://chem-eng.utoronto.ca/~datamining/dmc/zeror.htm
[14] http://chem-eng.utoronto.ca/~datamining/dmc/oner.htm
International Journal of Computer Science & Information Technology (IJCSIT) Vol 7, No 3, June 2015
125
[15] http://chem-eng.utoronto.ca/~datamining/dmc/naive_bayesian.htm
[16] http://chem-eng.utoronto.ca/~datamining/dmc/logistic_regression.htm
[17] http://neuroph.sourceforge.net/tutorials/MultiLayerPerceptron.html
[18] Jiwei Han and Micheline Kamber: Data Mining Concepts and Techniques, Elsevier Inc., Edition 2,
2006, ISBN no. 978-81-312-0535-8.
[19] Decision Tree at http://chemeng.utoronto.ca/~datamining/dmc/decision_tree.htm
[20] WEKA Tool at http://www.cs.waikato.ac.nz/ml/weka/
Authors
Mr. Saurabh Kumar Srivastava is a research scholar in the department of Computer Science &
Engineering at JIIT Noida, India. He obtained his M-Tech (Computer Engineering) from Shobhit
University and B-Tech(C.S.) from Uttar Pradesh Technical University, Lucknow (U.P.). He has been in
teaching since 7 years. During his teaching he has coordinated several Technical fests and
International/National Conferences at Institute level. He has attended several seminars, workshops and
conferences at various levels. His area of research includes Datamining, Machine Learning, Artificial
Intelligence, and Web Technology.
Dr. Sandeep Kumar Singh is an Assistant Professor (Senior Grade) at JIIT in Noida, India. He has
completed his Ph.D in (Computer Science and Engineering). He has around 13+ years’ experience, which
includes corporate training and teaching. His areas of interests are Software Engineering, Requirements
Engineering, Software Testing, Web Application Testing,Internet and Web Technology, Object Oriented
Technology, Programming Languages, Information Retrieval and Data Mining, Model based Testing and
Applications of Soft computing in Software Testing and Databases. He is currently supervising 4 Ph.D's in
Computer Science. He has around 28 published papers to his credit in different international journals and
conferences.

More Related Content

What's hot

Comparative study of various supervisedclassification methodsforanalysing def...
Comparative study of various supervisedclassification methodsforanalysing def...Comparative study of various supervisedclassification methodsforanalysing def...
Comparative study of various supervisedclassification methodsforanalysing def...
eSAT Publishing House
 
A02610104
A02610104A02610104
A02610104theijes
 
Privacy preserving data mining in four group randomized response technique us...
Privacy preserving data mining in four group randomized response technique us...Privacy preserving data mining in four group randomized response technique us...
Privacy preserving data mining in four group randomized response technique us...
eSAT Journals
 
The pertinent single-attribute-based classifier for small datasets classific...
The pertinent single-attribute-based classifier  for small datasets classific...The pertinent single-attribute-based classifier  for small datasets classific...
The pertinent single-attribute-based classifier for small datasets classific...
IJECEIAES
 
Analysis On Classification Techniques In Mammographic Mass Data Set
Analysis On Classification Techniques In Mammographic Mass Data SetAnalysis On Classification Techniques In Mammographic Mass Data Set
Analysis On Classification Techniques In Mammographic Mass Data Set
IJERA Editor
 
G046024851
G046024851G046024851
G046024851
IJERA Editor
 
IRJET- Missing Data Imputation by Evidence Chain
IRJET- Missing Data Imputation by Evidence ChainIRJET- Missing Data Imputation by Evidence Chain
IRJET- Missing Data Imputation by Evidence Chain
IRJET Journal
 
IRJET - Comparative Analysis of GUI based Prediction of Parkinson Disease usi...
IRJET - Comparative Analysis of GUI based Prediction of Parkinson Disease usi...IRJET - Comparative Analysis of GUI based Prediction of Parkinson Disease usi...
IRJET - Comparative Analysis of GUI based Prediction of Parkinson Disease usi...
IRJET Journal
 
Automatic Unsupervised Data Classification Using Jaya Evolutionary Algorithm
Automatic Unsupervised Data Classification Using Jaya Evolutionary AlgorithmAutomatic Unsupervised Data Classification Using Jaya Evolutionary Algorithm
Automatic Unsupervised Data Classification Using Jaya Evolutionary Algorithm
aciijournal
 
Control chart pattern recognition using k mica clustering and neural networks
Control chart pattern recognition using k mica clustering and neural networksControl chart pattern recognition using k mica clustering and neural networks
Control chart pattern recognition using k mica clustering and neural networks
ISA Interchange
 
Comparative Analysis of Machine Learning Algorithms for their Effectiveness i...
Comparative Analysis of Machine Learning Algorithms for their Effectiveness i...Comparative Analysis of Machine Learning Algorithms for their Effectiveness i...
Comparative Analysis of Machine Learning Algorithms for their Effectiveness i...
IRJET Journal
 
Multi-Dimensional Features Reduction of Consistency Subset Evaluator on Unsup...
Multi-Dimensional Features Reduction of Consistency Subset Evaluator on Unsup...Multi-Dimensional Features Reduction of Consistency Subset Evaluator on Unsup...
Multi-Dimensional Features Reduction of Consistency Subset Evaluator on Unsup...
CSCJournals
 
A novel hybrid feature selection approach
A novel hybrid feature selection approachA novel hybrid feature selection approach
A novel hybrid feature selection approach
ijaia
 
IRJET- A Detailed Study on Classification Techniques for Data Mining
IRJET- A Detailed Study on Classification Techniques for Data MiningIRJET- A Detailed Study on Classification Techniques for Data Mining
IRJET- A Detailed Study on Classification Techniques for Data Mining
IRJET Journal
 
final report (ppt)
final report (ppt)final report (ppt)
final report (ppt)butest
 
ROLE OF CERTAINTY FACTOR IN GENERATING ROUGH-FUZZY RULE
ROLE OF CERTAINTY FACTOR IN GENERATING ROUGH-FUZZY RULEROLE OF CERTAINTY FACTOR IN GENERATING ROUGH-FUZZY RULE
ROLE OF CERTAINTY FACTOR IN GENERATING ROUGH-FUZZY RULE
IJCSEA Journal
 
IRJET-Comparison between Supervised Learning and Unsupervised Learning
IRJET-Comparison between Supervised Learning and Unsupervised LearningIRJET-Comparison between Supervised Learning and Unsupervised Learning
IRJET-Comparison between Supervised Learning and Unsupervised Learning
IRJET Journal
 
Automatic Unsupervised Data Classification Using Jaya Evolutionary Algorithm
Automatic Unsupervised Data Classification Using Jaya Evolutionary AlgorithmAutomatic Unsupervised Data Classification Using Jaya Evolutionary Algorithm
Automatic Unsupervised Data Classification Using Jaya Evolutionary Algorithm
aciijournal
 
KNOWLEDGE BASED ANALYSIS OF VARIOUS STATISTICAL TOOLS IN DETECTING BREAST CANCER
KNOWLEDGE BASED ANALYSIS OF VARIOUS STATISTICAL TOOLS IN DETECTING BREAST CANCERKNOWLEDGE BASED ANALYSIS OF VARIOUS STATISTICAL TOOLS IN DETECTING BREAST CANCER
KNOWLEDGE BASED ANALYSIS OF VARIOUS STATISTICAL TOOLS IN DETECTING BREAST CANCER
cscpconf
 

What's hot (19)

Comparative study of various supervisedclassification methodsforanalysing def...
Comparative study of various supervisedclassification methodsforanalysing def...Comparative study of various supervisedclassification methodsforanalysing def...
Comparative study of various supervisedclassification methodsforanalysing def...
 
A02610104
A02610104A02610104
A02610104
 
Privacy preserving data mining in four group randomized response technique us...
Privacy preserving data mining in four group randomized response technique us...Privacy preserving data mining in four group randomized response technique us...
Privacy preserving data mining in four group randomized response technique us...
 
The pertinent single-attribute-based classifier for small datasets classific...
The pertinent single-attribute-based classifier  for small datasets classific...The pertinent single-attribute-based classifier  for small datasets classific...
The pertinent single-attribute-based classifier for small datasets classific...
 
Analysis On Classification Techniques In Mammographic Mass Data Set
Analysis On Classification Techniques In Mammographic Mass Data SetAnalysis On Classification Techniques In Mammographic Mass Data Set
Analysis On Classification Techniques In Mammographic Mass Data Set
 
G046024851
G046024851G046024851
G046024851
 
IRJET- Missing Data Imputation by Evidence Chain
IRJET- Missing Data Imputation by Evidence ChainIRJET- Missing Data Imputation by Evidence Chain
IRJET- Missing Data Imputation by Evidence Chain
 
IRJET - Comparative Analysis of GUI based Prediction of Parkinson Disease usi...
IRJET - Comparative Analysis of GUI based Prediction of Parkinson Disease usi...IRJET - Comparative Analysis of GUI based Prediction of Parkinson Disease usi...
IRJET - Comparative Analysis of GUI based Prediction of Parkinson Disease usi...
 
Automatic Unsupervised Data Classification Using Jaya Evolutionary Algorithm
Automatic Unsupervised Data Classification Using Jaya Evolutionary AlgorithmAutomatic Unsupervised Data Classification Using Jaya Evolutionary Algorithm
Automatic Unsupervised Data Classification Using Jaya Evolutionary Algorithm
 
Control chart pattern recognition using k mica clustering and neural networks
Control chart pattern recognition using k mica clustering and neural networksControl chart pattern recognition using k mica clustering and neural networks
Control chart pattern recognition using k mica clustering and neural networks
 
Comparative Analysis of Machine Learning Algorithms for their Effectiveness i...
Comparative Analysis of Machine Learning Algorithms for their Effectiveness i...Comparative Analysis of Machine Learning Algorithms for their Effectiveness i...
Comparative Analysis of Machine Learning Algorithms for their Effectiveness i...
 
Multi-Dimensional Features Reduction of Consistency Subset Evaluator on Unsup...
Multi-Dimensional Features Reduction of Consistency Subset Evaluator on Unsup...Multi-Dimensional Features Reduction of Consistency Subset Evaluator on Unsup...
Multi-Dimensional Features Reduction of Consistency Subset Evaluator on Unsup...
 
A novel hybrid feature selection approach
A novel hybrid feature selection approachA novel hybrid feature selection approach
A novel hybrid feature selection approach
 
IRJET- A Detailed Study on Classification Techniques for Data Mining
IRJET- A Detailed Study on Classification Techniques for Data MiningIRJET- A Detailed Study on Classification Techniques for Data Mining
IRJET- A Detailed Study on Classification Techniques for Data Mining
 
final report (ppt)
final report (ppt)final report (ppt)
final report (ppt)
 
ROLE OF CERTAINTY FACTOR IN GENERATING ROUGH-FUZZY RULE
ROLE OF CERTAINTY FACTOR IN GENERATING ROUGH-FUZZY RULEROLE OF CERTAINTY FACTOR IN GENERATING ROUGH-FUZZY RULE
ROLE OF CERTAINTY FACTOR IN GENERATING ROUGH-FUZZY RULE
 
IRJET-Comparison between Supervised Learning and Unsupervised Learning
IRJET-Comparison between Supervised Learning and Unsupervised LearningIRJET-Comparison between Supervised Learning and Unsupervised Learning
IRJET-Comparison between Supervised Learning and Unsupervised Learning
 
Automatic Unsupervised Data Classification Using Jaya Evolutionary Algorithm
Automatic Unsupervised Data Classification Using Jaya Evolutionary AlgorithmAutomatic Unsupervised Data Classification Using Jaya Evolutionary Algorithm
Automatic Unsupervised Data Classification Using Jaya Evolutionary Algorithm
 
KNOWLEDGE BASED ANALYSIS OF VARIOUS STATISTICAL TOOLS IN DETECTING BREAST CANCER
KNOWLEDGE BASED ANALYSIS OF VARIOUS STATISTICAL TOOLS IN DETECTING BREAST CANCERKNOWLEDGE BASED ANALYSIS OF VARIOUS STATISTICAL TOOLS IN DETECTING BREAST CANCER
KNOWLEDGE BASED ANALYSIS OF VARIOUS STATISTICAL TOOLS IN DETECTING BREAST CANCER
 

Similar to MULTI-PARAMETER BASED PERFORMANCE EVALUATION OF CLASSIFICATION ALGORITHMS

Accuracy, Sensitivity and Specificity Measurement of Various Classification T...
Accuracy, Sensitivity and Specificity Measurement of Various Classification T...Accuracy, Sensitivity and Specificity Measurement of Various Classification T...
Accuracy, Sensitivity and Specificity Measurement of Various Classification T...
IOSR Journals
 
On Feature Selection Algorithms and Feature Selection Stability Measures : A ...
On Feature Selection Algorithms and Feature Selection Stability Measures : A ...On Feature Selection Algorithms and Feature Selection Stability Measures : A ...
On Feature Selection Algorithms and Feature Selection Stability Measures : A ...
AIRCC Publishing Corporation
 
On Feature Selection Algorithms and Feature Selection Stability Measures : A...
 On Feature Selection Algorithms and Feature Selection Stability Measures : A... On Feature Selection Algorithms and Feature Selection Stability Measures : A...
On Feature Selection Algorithms and Feature Selection Stability Measures : A...
AIRCC Publishing Corporation
 
Data mining techniques
Data mining techniquesData mining techniques
Data mining techniques
eSAT Journals
 
Classification of medical datasets using back propagation neural network powe...
Classification of medical datasets using back propagation neural network powe...Classification of medical datasets using back propagation neural network powe...
Classification of medical datasets using back propagation neural network powe...
IJECEIAES
 
Analysis on Data Mining Techniques for Heart Disease Dataset
Analysis on Data Mining Techniques for Heart Disease DatasetAnalysis on Data Mining Techniques for Heart Disease Dataset
Analysis on Data Mining Techniques for Heart Disease Dataset
IRJET Journal
 
Data mining techniques a survey paper
Data mining techniques a survey paperData mining techniques a survey paper
Data mining techniques a survey paper
eSAT Publishing House
 
ICU Mortality Rate Estimation Using Machine Learning and Artificial Neural Ne...
ICU Mortality Rate Estimation Using Machine Learning and Artificial Neural Ne...ICU Mortality Rate Estimation Using Machine Learning and Artificial Neural Ne...
ICU Mortality Rate Estimation Using Machine Learning and Artificial Neural Ne...
IRJET Journal
 
Hybrid Method HVS-MRMR for Variable Selection in Multilayer Artificial Neural...
Hybrid Method HVS-MRMR for Variable Selection in Multilayer Artificial Neural...Hybrid Method HVS-MRMR for Variable Selection in Multilayer Artificial Neural...
Hybrid Method HVS-MRMR for Variable Selection in Multilayer Artificial Neural...
IJECEIAES
 
K-MEANS AND D-STREAM ALGORITHM IN HEALTHCARE
K-MEANS AND D-STREAM ALGORITHM IN HEALTHCAREK-MEANS AND D-STREAM ALGORITHM IN HEALTHCARE
K-MEANS AND D-STREAM ALGORITHM IN HEALTHCARE
International Journal of Technical Research & Application
 
CLASSIFIER SELECTION MODELS FOR INTRUSION DETECTION SYSTEM (IDS)
CLASSIFIER SELECTION MODELS FOR INTRUSION DETECTION SYSTEM (IDS)CLASSIFIER SELECTION MODELS FOR INTRUSION DETECTION SYSTEM (IDS)
CLASSIFIER SELECTION MODELS FOR INTRUSION DETECTION SYSTEM (IDS)
ieijjournal1
 
PREDICTION OF MALIGNANCY IN SUSPECTED THYROID TUMOUR PATIENTS BY THREE DIFFER...
PREDICTION OF MALIGNANCY IN SUSPECTED THYROID TUMOUR PATIENTS BY THREE DIFFER...PREDICTION OF MALIGNANCY IN SUSPECTED THYROID TUMOUR PATIENTS BY THREE DIFFER...
PREDICTION OF MALIGNANCY IN SUSPECTED THYROID TUMOUR PATIENTS BY THREE DIFFER...
cscpconf
 
Advanced Computational Intelligence: An International Journal (ACII)
Advanced Computational Intelligence: An International Journal (ACII)Advanced Computational Intelligence: An International Journal (ACII)
Advanced Computational Intelligence: An International Journal (ACII)
aciijournal
 
[IJET-V2I3P22] Authors: Harsha Pakhale,Deepak Kumar Xaxa
[IJET-V2I3P22] Authors: Harsha Pakhale,Deepak Kumar Xaxa[IJET-V2I3P22] Authors: Harsha Pakhale,Deepak Kumar Xaxa
[IJET-V2I3P22] Authors: Harsha Pakhale,Deepak Kumar Xaxa
IJET - International Journal of Engineering and Techniques
 
Comparative Study of Data Mining Classification Algorithms in Heart Disease P...
Comparative Study of Data Mining Classification Algorithms in Heart Disease P...Comparative Study of Data Mining Classification Algorithms in Heart Disease P...
Comparative Study of Data Mining Classification Algorithms in Heart Disease P...
paperpublications3
 
Hypothesis on Different Data Mining Algorithms
Hypothesis on Different Data Mining AlgorithmsHypothesis on Different Data Mining Algorithms
Hypothesis on Different Data Mining Algorithms
IJERA Editor
 
Prognosticating Autism Spectrum Disorder Using Artificial Neural Network: Lev...
Prognosticating Autism Spectrum Disorder Using Artificial Neural Network: Lev...Prognosticating Autism Spectrum Disorder Using Artificial Neural Network: Lev...
Prognosticating Autism Spectrum Disorder Using Artificial Neural Network: Lev...
Avishek Choudhury
 
Disease prediction in big data healthcare using extended convolutional neural...
Disease prediction in big data healthcare using extended convolutional neural...Disease prediction in big data healthcare using extended convolutional neural...
Disease prediction in big data healthcare using extended convolutional neural...
IJAAS Team
 
Utilizing Machine Learning, Detect Chronic Kidney Disease and Suggest A Healt...
Utilizing Machine Learning, Detect Chronic Kidney Disease and Suggest A Healt...Utilizing Machine Learning, Detect Chronic Kidney Disease and Suggest A Healt...
Utilizing Machine Learning, Detect Chronic Kidney Disease and Suggest A Healt...
IRJET Journal
 
CLUSTERING DICHOTOMOUS DATA FOR HEALTH CARE
CLUSTERING DICHOTOMOUS DATA FOR HEALTH CARECLUSTERING DICHOTOMOUS DATA FOR HEALTH CARE
CLUSTERING DICHOTOMOUS DATA FOR HEALTH CARE
ijistjournal
 

Similar to MULTI-PARAMETER BASED PERFORMANCE EVALUATION OF CLASSIFICATION ALGORITHMS (20)

Accuracy, Sensitivity and Specificity Measurement of Various Classification T...
Accuracy, Sensitivity and Specificity Measurement of Various Classification T...Accuracy, Sensitivity and Specificity Measurement of Various Classification T...
Accuracy, Sensitivity and Specificity Measurement of Various Classification T...
 
On Feature Selection Algorithms and Feature Selection Stability Measures : A ...
On Feature Selection Algorithms and Feature Selection Stability Measures : A ...On Feature Selection Algorithms and Feature Selection Stability Measures : A ...
On Feature Selection Algorithms and Feature Selection Stability Measures : A ...
 
On Feature Selection Algorithms and Feature Selection Stability Measures : A...
 On Feature Selection Algorithms and Feature Selection Stability Measures : A... On Feature Selection Algorithms and Feature Selection Stability Measures : A...
On Feature Selection Algorithms and Feature Selection Stability Measures : A...
 
Data mining techniques
Data mining techniquesData mining techniques
Data mining techniques
 
Classification of medical datasets using back propagation neural network powe...
Classification of medical datasets using back propagation neural network powe...Classification of medical datasets using back propagation neural network powe...
Classification of medical datasets using back propagation neural network powe...
 
Analysis on Data Mining Techniques for Heart Disease Dataset
Analysis on Data Mining Techniques for Heart Disease DatasetAnalysis on Data Mining Techniques for Heart Disease Dataset
Analysis on Data Mining Techniques for Heart Disease Dataset
 
Data mining techniques a survey paper
Data mining techniques a survey paperData mining techniques a survey paper
Data mining techniques a survey paper
 
ICU Mortality Rate Estimation Using Machine Learning and Artificial Neural Ne...
ICU Mortality Rate Estimation Using Machine Learning and Artificial Neural Ne...ICU Mortality Rate Estimation Using Machine Learning and Artificial Neural Ne...
ICU Mortality Rate Estimation Using Machine Learning and Artificial Neural Ne...
 
Hybrid Method HVS-MRMR for Variable Selection in Multilayer Artificial Neural...
Hybrid Method HVS-MRMR for Variable Selection in Multilayer Artificial Neural...Hybrid Method HVS-MRMR for Variable Selection in Multilayer Artificial Neural...
Hybrid Method HVS-MRMR for Variable Selection in Multilayer Artificial Neural...
 
K-MEANS AND D-STREAM ALGORITHM IN HEALTHCARE
K-MEANS AND D-STREAM ALGORITHM IN HEALTHCAREK-MEANS AND D-STREAM ALGORITHM IN HEALTHCARE
K-MEANS AND D-STREAM ALGORITHM IN HEALTHCARE
 
CLASSIFIER SELECTION MODELS FOR INTRUSION DETECTION SYSTEM (IDS)
CLASSIFIER SELECTION MODELS FOR INTRUSION DETECTION SYSTEM (IDS)CLASSIFIER SELECTION MODELS FOR INTRUSION DETECTION SYSTEM (IDS)
CLASSIFIER SELECTION MODELS FOR INTRUSION DETECTION SYSTEM (IDS)
 
PREDICTION OF MALIGNANCY IN SUSPECTED THYROID TUMOUR PATIENTS BY THREE DIFFER...
PREDICTION OF MALIGNANCY IN SUSPECTED THYROID TUMOUR PATIENTS BY THREE DIFFER...PREDICTION OF MALIGNANCY IN SUSPECTED THYROID TUMOUR PATIENTS BY THREE DIFFER...
PREDICTION OF MALIGNANCY IN SUSPECTED THYROID TUMOUR PATIENTS BY THREE DIFFER...
 
Advanced Computational Intelligence: An International Journal (ACII)
Advanced Computational Intelligence: An International Journal (ACII)Advanced Computational Intelligence: An International Journal (ACII)
Advanced Computational Intelligence: An International Journal (ACII)
 
[IJET-V2I3P22] Authors: Harsha Pakhale,Deepak Kumar Xaxa
[IJET-V2I3P22] Authors: Harsha Pakhale,Deepak Kumar Xaxa[IJET-V2I3P22] Authors: Harsha Pakhale,Deepak Kumar Xaxa
[IJET-V2I3P22] Authors: Harsha Pakhale,Deepak Kumar Xaxa
 
Comparative Study of Data Mining Classification Algorithms in Heart Disease P...
Comparative Study of Data Mining Classification Algorithms in Heart Disease P...Comparative Study of Data Mining Classification Algorithms in Heart Disease P...
Comparative Study of Data Mining Classification Algorithms in Heart Disease P...
 
Hypothesis on Different Data Mining Algorithms
Hypothesis on Different Data Mining AlgorithmsHypothesis on Different Data Mining Algorithms
Hypothesis on Different Data Mining Algorithms
 
Prognosticating Autism Spectrum Disorder Using Artificial Neural Network: Lev...
Prognosticating Autism Spectrum Disorder Using Artificial Neural Network: Lev...Prognosticating Autism Spectrum Disorder Using Artificial Neural Network: Lev...
Prognosticating Autism Spectrum Disorder Using Artificial Neural Network: Lev...
 
Disease prediction in big data healthcare using extended convolutional neural...
Disease prediction in big data healthcare using extended convolutional neural...Disease prediction in big data healthcare using extended convolutional neural...
Disease prediction in big data healthcare using extended convolutional neural...
 
Utilizing Machine Learning, Detect Chronic Kidney Disease and Suggest A Healt...
Utilizing Machine Learning, Detect Chronic Kidney Disease and Suggest A Healt...Utilizing Machine Learning, Detect Chronic Kidney Disease and Suggest A Healt...
Utilizing Machine Learning, Detect Chronic Kidney Disease and Suggest A Healt...
 
CLUSTERING DICHOTOMOUS DATA FOR HEALTH CARE
CLUSTERING DICHOTOMOUS DATA FOR HEALTH CARECLUSTERING DICHOTOMOUS DATA FOR HEALTH CARE
CLUSTERING DICHOTOMOUS DATA FOR HEALTH CARE
 

Recently uploaded

Student information management system project report ii.pdf
Student information management system project report ii.pdfStudent information management system project report ii.pdf
Student information management system project report ii.pdf
Kamal Acharya
 
在线办理(ANU毕业证书)澳洲国立大学毕业证录取通知书一模一样
在线办理(ANU毕业证书)澳洲国立大学毕业证录取通知书一模一样在线办理(ANU毕业证书)澳洲国立大学毕业证录取通知书一模一样
在线办理(ANU毕业证书)澳洲国立大学毕业证录取通知书一模一样
obonagu
 
RAT: Retrieval Augmented Thoughts Elicit Context-Aware Reasoning in Long-Hori...
RAT: Retrieval Augmented Thoughts Elicit Context-Aware Reasoning in Long-Hori...RAT: Retrieval Augmented Thoughts Elicit Context-Aware Reasoning in Long-Hori...
RAT: Retrieval Augmented Thoughts Elicit Context-Aware Reasoning in Long-Hori...
thanhdowork
 
The Benefits and Techniques of Trenchless Pipe Repair.pdf
The Benefits and Techniques of Trenchless Pipe Repair.pdfThe Benefits and Techniques of Trenchless Pipe Repair.pdf
The Benefits and Techniques of Trenchless Pipe Repair.pdf
Pipe Restoration Solutions
 
Architectural Portfolio Sean Lockwood
Architectural Portfolio Sean LockwoodArchitectural Portfolio Sean Lockwood
Architectural Portfolio Sean Lockwood
seandesed
 
Fundamentals of Electric Drives and its applications.pptx
Fundamentals of Electric Drives and its applications.pptxFundamentals of Electric Drives and its applications.pptx
Fundamentals of Electric Drives and its applications.pptx
manasideore6
 
weather web application report.pdf
weather web application report.pdfweather web application report.pdf
weather web application report.pdf
Pratik Pawar
 
一比一原版(UofT毕业证)多伦多大学毕业证成绩单如何办理
一比一原版(UofT毕业证)多伦多大学毕业证成绩单如何办理一比一原版(UofT毕业证)多伦多大学毕业证成绩单如何办理
一比一原版(UofT毕业证)多伦多大学毕业证成绩单如何办理
ydteq
 
ML for identifying fraud using open blockchain data.pptx
ML for identifying fraud using open blockchain data.pptxML for identifying fraud using open blockchain data.pptx
ML for identifying fraud using open blockchain data.pptx
Vijay Dialani, PhD
 
road safety engineering r s e unit 3.pdf
road safety engineering  r s e unit 3.pdfroad safety engineering  r s e unit 3.pdf
road safety engineering r s e unit 3.pdf
VENKATESHvenky89705
 
English lab ppt no titlespecENG PPTt.pdf
English lab ppt no titlespecENG PPTt.pdfEnglish lab ppt no titlespecENG PPTt.pdf
English lab ppt no titlespecENG PPTt.pdf
BrazilAccount1
 
CME397 Surface Engineering- Professional Elective
CME397 Surface Engineering- Professional ElectiveCME397 Surface Engineering- Professional Elective
CME397 Surface Engineering- Professional Elective
karthi keyan
 
Railway Signalling Principles Edition 3.pdf
Railway Signalling Principles Edition 3.pdfRailway Signalling Principles Edition 3.pdf
Railway Signalling Principles Edition 3.pdf
TeeVichai
 
Sachpazis:Terzaghi Bearing Capacity Estimation in simple terms with Calculati...
Sachpazis:Terzaghi Bearing Capacity Estimation in simple terms with Calculati...Sachpazis:Terzaghi Bearing Capacity Estimation in simple terms with Calculati...
Sachpazis:Terzaghi Bearing Capacity Estimation in simple terms with Calculati...
Dr.Costas Sachpazis
 
The role of big data in decision making.
The role of big data in decision making.The role of big data in decision making.
The role of big data in decision making.
ankuprajapati0525
 
Governing Equations for Fundamental Aerodynamics_Anderson2010.pdf
Governing Equations for Fundamental Aerodynamics_Anderson2010.pdfGoverning Equations for Fundamental Aerodynamics_Anderson2010.pdf
Governing Equations for Fundamental Aerodynamics_Anderson2010.pdf
WENKENLI1
 
Runway Orientation Based on the Wind Rose Diagram.pptx
Runway Orientation Based on the Wind Rose Diagram.pptxRunway Orientation Based on the Wind Rose Diagram.pptx
Runway Orientation Based on the Wind Rose Diagram.pptx
SupreethSP4
 
AP LAB PPT.pdf ap lab ppt no title specific
AP LAB PPT.pdf ap lab ppt no title specificAP LAB PPT.pdf ap lab ppt no title specific
AP LAB PPT.pdf ap lab ppt no title specific
BrazilAccount1
 
ethical hacking-mobile hacking methods.ppt
ethical hacking-mobile hacking methods.pptethical hacking-mobile hacking methods.ppt
ethical hacking-mobile hacking methods.ppt
Jayaprasanna4
 
Top 10 Oil and Gas Projects in Saudi Arabia 2024.pdf
Top 10 Oil and Gas Projects in Saudi Arabia 2024.pdfTop 10 Oil and Gas Projects in Saudi Arabia 2024.pdf
Top 10 Oil and Gas Projects in Saudi Arabia 2024.pdf
Teleport Manpower Consultant
 

Recently uploaded (20)

Student information management system project report ii.pdf
Student information management system project report ii.pdfStudent information management system project report ii.pdf
Student information management system project report ii.pdf
 
在线办理(ANU毕业证书)澳洲国立大学毕业证录取通知书一模一样
在线办理(ANU毕业证书)澳洲国立大学毕业证录取通知书一模一样在线办理(ANU毕业证书)澳洲国立大学毕业证录取通知书一模一样
在线办理(ANU毕业证书)澳洲国立大学毕业证录取通知书一模一样
 
RAT: Retrieval Augmented Thoughts Elicit Context-Aware Reasoning in Long-Hori...
RAT: Retrieval Augmented Thoughts Elicit Context-Aware Reasoning in Long-Hori...RAT: Retrieval Augmented Thoughts Elicit Context-Aware Reasoning in Long-Hori...
RAT: Retrieval Augmented Thoughts Elicit Context-Aware Reasoning in Long-Hori...
 
The Benefits and Techniques of Trenchless Pipe Repair.pdf
The Benefits and Techniques of Trenchless Pipe Repair.pdfThe Benefits and Techniques of Trenchless Pipe Repair.pdf
The Benefits and Techniques of Trenchless Pipe Repair.pdf
 
Architectural Portfolio Sean Lockwood
Architectural Portfolio Sean LockwoodArchitectural Portfolio Sean Lockwood
Architectural Portfolio Sean Lockwood
 
Fundamentals of Electric Drives and its applications.pptx
Fundamentals of Electric Drives and its applications.pptxFundamentals of Electric Drives and its applications.pptx
Fundamentals of Electric Drives and its applications.pptx
 
weather web application report.pdf
weather web application report.pdfweather web application report.pdf
weather web application report.pdf
 
一比一原版(UofT毕业证)多伦多大学毕业证成绩单如何办理
一比一原版(UofT毕业证)多伦多大学毕业证成绩单如何办理一比一原版(UofT毕业证)多伦多大学毕业证成绩单如何办理
一比一原版(UofT毕业证)多伦多大学毕业证成绩单如何办理
 
ML for identifying fraud using open blockchain data.pptx
ML for identifying fraud using open blockchain data.pptxML for identifying fraud using open blockchain data.pptx
ML for identifying fraud using open blockchain data.pptx
 
road safety engineering r s e unit 3.pdf
road safety engineering  r s e unit 3.pdfroad safety engineering  r s e unit 3.pdf
road safety engineering r s e unit 3.pdf
 
English lab ppt no titlespecENG PPTt.pdf
English lab ppt no titlespecENG PPTt.pdfEnglish lab ppt no titlespecENG PPTt.pdf
English lab ppt no titlespecENG PPTt.pdf
 
CME397 Surface Engineering- Professional Elective
CME397 Surface Engineering- Professional ElectiveCME397 Surface Engineering- Professional Elective
CME397 Surface Engineering- Professional Elective
 
Railway Signalling Principles Edition 3.pdf
Railway Signalling Principles Edition 3.pdfRailway Signalling Principles Edition 3.pdf
Railway Signalling Principles Edition 3.pdf
 
Sachpazis:Terzaghi Bearing Capacity Estimation in simple terms with Calculati...
Sachpazis:Terzaghi Bearing Capacity Estimation in simple terms with Calculati...Sachpazis:Terzaghi Bearing Capacity Estimation in simple terms with Calculati...
Sachpazis:Terzaghi Bearing Capacity Estimation in simple terms with Calculati...
 
The role of big data in decision making.
The role of big data in decision making.The role of big data in decision making.
The role of big data in decision making.
 
Governing Equations for Fundamental Aerodynamics_Anderson2010.pdf
Governing Equations for Fundamental Aerodynamics_Anderson2010.pdfGoverning Equations for Fundamental Aerodynamics_Anderson2010.pdf
Governing Equations for Fundamental Aerodynamics_Anderson2010.pdf
 
Runway Orientation Based on the Wind Rose Diagram.pptx
Runway Orientation Based on the Wind Rose Diagram.pptxRunway Orientation Based on the Wind Rose Diagram.pptx
Runway Orientation Based on the Wind Rose Diagram.pptx
 
AP LAB PPT.pdf ap lab ppt no title specific
AP LAB PPT.pdf ap lab ppt no title specificAP LAB PPT.pdf ap lab ppt no title specific
AP LAB PPT.pdf ap lab ppt no title specific
 
ethical hacking-mobile hacking methods.ppt
ethical hacking-mobile hacking methods.pptethical hacking-mobile hacking methods.ppt
ethical hacking-mobile hacking methods.ppt
 
Top 10 Oil and Gas Projects in Saudi Arabia 2024.pdf
Top 10 Oil and Gas Projects in Saudi Arabia 2024.pdfTop 10 Oil and Gas Projects in Saudi Arabia 2024.pdf
Top 10 Oil and Gas Projects in Saudi Arabia 2024.pdf
 

MULTI-PARAMETER BASED PERFORMANCE EVALUATION OF CLASSIFICATION ALGORITHMS

  • 1. International Journal of Computer Science & Information Technology (IJCSIT) Vol 7, No 3, June 2015 DOI:10.5121/ijcsit.2015.7310 115 MULTI-PARAMETER BASED PERFORMANCE EVALUATION OF CLASSIFICATION ALGORITHMS Saurabh Kr. Srivastava1 and Sandeep Kr. Singh2 1 Research Scholar, Department of Computer Sc. & Engineering, JIIT University, Noida, India 2 Assistant Professor, Department of Computer Sc. & Engineering, JIIT University, Noida, India ABSTRACT Diabetes disease is amongst the most common disease in India. It affects patient’s health and also leads to other chronic diseases. Prediction of diabetes plays a significant role in saving of life and cost. Predicting diabetes in human body is a challenging task because it depends on several factors. Few studies have reported the performance of classification algorithms in terms of accuracy. Results in these studies are difficult and complex to understand by medical practitioner and also lack in terms of visual aids as they are presented in pure text format. This reported survey uses ROC and PRC graphical measures to improve understanding of results. A detailed parameter wise discussion of comparison is also presented which lacks in other reported surveys. Execution time, Accuracy, TP Rate, FP Rate, Precision, Recall, F Measure parameters are used for comparative analysis and Confusion Matrix is prepared for quick review of each algorithm. Ten fold cross validation method is used for estimation of prediction model. Different sets of classification algorithms are analyzed on diabetes dataset acquired from UCI repository. KEYWORDS Data mining, Diabetes, UCI repository, Machine Learning. 1. INTRODUCTION AND LITERATURE REVIEW Diabetes invites other chronic diseases. It is primarily associated with an increase of blood glucose. Two common categories of diabetes are Type-1 and Type-2. Type-1 diabetes occurs when pancreas fails to produce sufficient insulin while Type-2 occurs when body cannot effectively consume the insulin produced. Diabetes confirmation requires a lot of examination that affects time and cost both. Prior studies show that classification algorithms have been effectively used in prediction of diabetes. Several studies and results are reported using data mining techniques in healthcare for classification in medical databases. In the context of that J.W.Smith et al.[1] have introduced adaptive learning routine that executes digital analogy of perceptions called ADAP. The algorithm uses 576 training instances and classification accuracy is 76% on the remaining 192 instances. K.Srinivas et al.[4] studied the applications of Data mining Techniques in healthcare and have reported prediction of heart attacks using clinical database. Elmakolce et al.[5] has given the glimps of different data mining techniques utilization. Asha Rajkumar et al.[2] and A.Khemphlila et al.[3] discussed various data mining techniques for diagnosis of certain life threatening diseases. HuyNguyen A.P. et al.[6] proposed a new Homogeneity-Based Algorithm that determines over fitting and over generalization behavior of classification. Recently K.R. Lakshmi et al.[10] and Karthikeyini.V. et.al [8,9] discussed data mining algorithms performance based upon their computing time, and precision value.
  • 2. International Journal of Computer Science & Information Technology (IJCSIT) Vol 7, No 3, June 2015 116 The data mining techniques aims to extract the hidden information from large dataset and transform it into knowledge patterns for further use that can be easily understood by human. A model is an example of structure which is based upon predicted data. The paper uses ROC and PRC graphical measures to visualize the results that makes data easy to understand by medical practitioners. Execution time, Accuracy, TP Rate, FP Rate, Precision, Recall, and F Measure parameters are used for comparative analysis. We have described the results of experiments in which categorical (Tree, Function, Rule & Bayesian) algorithms are used for performance evauation. The paper is organized as follows: in section 2 we described the algorithms which are used for performance evaluation; in section 3 we discussed the measures on which result is obtained; in section 4 we explained about the experimental setup, data set and result evaluation process; in section 5 & 6 we described the result and discussion on evaluated results; finally, in section 7 we presented our conclusion. 2. ALGORITHMS USED FOR RESULT EVALUATION 2.1. Decision Tree Based Classification Decision Tree maps observation to conclusion in the form of target values. Decision tree separates input space of a data set into mutually exclusive regions. Each of which is assigned to a label, a value or an action to characterize its data points.Two variants: J48 and RandomTree are discussed in subsections. 2.1.1. J48: A decision tree is a graphical representation which consist of internal and external nodes connected by branches. Internal node is responsible for implementing decision functions, that determines which node to visit next. The external node, has no child node and it is associated with a value that characterizes the given data which leads to its being visited. Decision tree construction algorithms involve a two-step process. First- growing, Second-pruning. The growing process sets up a very large decision tree and pruning process reduces the large size and overfiting of the data. The pruned decision tree that is used for classification is called as classification tree [19]. A J48 decision tree is a predictive machine-learning model that decides the target value (dependent variable) of a new sample based on various attribute values of the available data. The nodes of a J48 decision tree denote the different attributes. Branches between the nodes tell us the possible values that these attributes can have in the observed samples. To build a decision tree, we need to calculate the entropy and information gain [18]. Entropy: E(S)=∑ -pi log2pi (Where ∑ varies from i=1 to c) Information Gain: Gain (T, X) = Entropy (T) – Entropy (T,X). 2.1.2. Random Tree: It is the simplest tree algorithm that comes as a result of stochastic process. Random binary tree refers system model that selects random values over time. Two different distributions are commonly used for Random Tree formation: 1) Inserting nodes one at a time according to a random permutation. 2) Chosing from a uniform discrete distribution. Repeated splitting is another distribution to form the random tree. Adding and removing nodes directly in a random binary tree will generaly disrupt its random structure. In order to balance the nodes of Random Trees, random permutation are used for dynamic insertion and deletion of nodes. 2.2. Function Based Classification It’s a mathematical classification (or statistical procedure) to classify an instance in a particular class.
  • 3. International Journal of Computer Science & Information Technology (IJCSIT) Vol 7, No 3, June 2015 117 2.2.1. Logistics Regression: Logistics Regression predicts the probability of an outcome that can only have two values. It performs a least-square fit of a parameter vector β to a numeric target variable X. The logistic regression uses equation: F(X) = βT. X to formulate prediction model.Where X is the input vector (a constant term to accommodate the intercept), and β is parameter vector to a numeric target variable. It is possible to use this technique for classification by directly fitting logistics regression models to class indication variables. The prediction is based on the use of one or several predictors (numerical and categorical). A linear regression is not appropriate for predicting the value of binary variable for two reasons: 1. A linear regression will predict values outside the acceptable range (e.g. predicting probabilities outside the range 0 to 1) 2. Since the two value experiments can only have one of two possible values for each experiment, the residuals will not be normally distributed about the predicted line. Figure 1. Logistics Regression Function Simply, the logistic regression equation can be written in terms of an odds ratio- p/1-p = exp(b0 + b1x). Here, b0 is the constant responsible for moving the curve left and right while b1 defines the steepness of the curve. 2.2.2. Multi-Layer Perceptron: A simplest form of neural network needs to classify linearly seperable patterns. While for non-linear patterns multi-layer perceptron (MLP) neural network model performs well. It maps sets of input data onto a set of appropriate outputs. MLP consists of multiple layers of nodes in a directed graph with each layer fully connected to the next one. Except for the input nodes, each node is a neuron (or processing element) with a nonlinear activation function. MLP uses back propagation learning algorithm for training and widely used in pattern classification and recognition. The simplest form of MLP is shown as- Figure 2. Multi-Layer Perceptron 2.3. Rule Based Classification The rule based classification is based upon rules like (if-else). Rules are mutually exclusive and exhaustive.Two variants are discussed in following subsections.
  • 4. International Journal of Computer Science & Information Technology (IJCSIT) Vol 7, No 3, June 2015 118 2.3.1. ZeroR: ZeroR is a simplest method which only focuses on the class. It is a least accurate classifier only predicts the majority category (class). It is useful for determining a baseline as a benchmark for other classification methods. ZeroR algorithm ignores the predictors only constructs a frequency table for the target and select its most frequent value. 2.3.2. OneR: OneR is a rule based classification that uses a single predictor. It generates one rule for each predictor in the data and constructs frequency table for each predictor against the target. OneR short for “One Rule” is an accurate classification algorithm, for each value of predictor, OneR makes rule as follows- 1: Count how often each value of target (class) appears 2: Find the most frequent class 3: Make the rule assign that class to this value of predictors 4: Calculate the total error of the rules of each predictor 5: Choose the predictor with smallest total error. OneR produces rules only slightly less accurate than state-of-the-art classification algorithms. 2.4. Bayesian Based Classification Bayesian classification is based upon Baye’s probability rules and depends on likelihood functions. Two variants are discussed in following subsections. 2.4.1. Simple Baye’s Classification: Bayesian networks are a powerful probabilistic representation for classification. The Baye’s provides a rule for calculating posterior probability. If probability of item A is to be calculated over given item B then according to Baye’s- P (A/B) = P (B/A) * P (A) / P (B) P (A/B) is probability of A given that B is true (posterior probability). P (B/A) is probability of B given that A is true (likelihood). P (A) is prior probability of the class. P (B) is prior probability of predictor. 2.4.2. Naive Baye’s: The Naive Baye’s classifier is based on Baye’s Theorem with independent assumptions between predictors. Naive Bayesian model is easy to build without complicated iterative parameter estimation. It analyzes all the attributes in the data individually, means the value of a predictor (X) on a given (C) is independent of the values of other predictors. This assumption is called as class conditional independence. The working steps for Naive Baye’s classifier are as follows- 1. First calculating the posterior probability and construct the frequency table against the target. 2. Transforming the frequency table into likelihood table and using the Naive Baye’s equation to calculate the posterior probability for each class. 3. Class with highest probability is the outcome of prediction. P (C/X) = P (X/C) * P (C) / P (X) P (C/X) is posterior probability of class (target) given predictor (attribute). P (X/C) is likelihood which is the probability of predictor given class. P (C) is prior probability of the class. P (X) is prior probability of predictor.
  • 5. International Journal of Computer Science & Information Technology (IJCSIT) Vol 7, No 3, June 2015 119 3. MEASURES ON WHICH RESULT IS OBTAINED 3.1. Execution Time: The time taken by the tool to execute and evaluate an algorithm. 3.2. Accuracy: Accuracy defines percentage of correctly classified instances from the test set by the classifier. 3.3. TP Rate: True Positive rate is proportion of examples which were classified as a class X among all examples which truly have the X class. This shows how much the part of the class is truly captured. 3.4. FP Rate: False Positive is the proportion of the examples which were incorrectly identified and belong to another class. 3.5. Precision: Precision is the proportion of examples which truly have class X among all those which were classified as X. It is a measure of exactness. Positive predictive value is called as precision. PPV= TP/TP+FP 3.6. Recall: Recall is the proportion of examples which were classified as class X among all examples which truely have class X. It is a measure of completeness. Negative predictive value is called as recall. NPV= TP/TP+FN 3.7. F Measure: F measure is aggregate of precision and recall, The formula is defined as: 2 * Precision * Recall / Precision + Recall. 3.8. ROC Area: ROC is comparison of two operating characteristics TPR and FPR. It is also known as a receivers operating characteristic curve. A receiver operating characteristic curve is a graphical measure which interprets the performance of a classifier as its discrimination threshold is varied. It is an outcome of plotting the true positive rate vs. false positive rate at various threshold settings. True positive rate is fraction of true positives out of the total actual positives while the fraction of false positives out of the total actual negatives indcates false positive rate. The point in threshold curve record various statistics such as true positive, false positive etc. The curves are generated by sorting the prediction produced by the classifier in descending order of probability it assigns to the positive class. The formula is defind as: ROC Area: TP Rate= TP/TP+FN*100, FP Rate= FP/FP+TN*100. 3.9. PRC Area: The PRC is known as precision recall characteristics curve. It is a comparison of two operating characteristics (PPV and sensitivity) as the criterion changes. A precision recall curve or PRC curve is a graphical plot which illustrates the performance of binary classifiers as its discrimination threshold is varied. PPV is fraction of true positives out of test outcomes positive. While sensitivity is fraction of true positive out of conditions positive. 3.10. Confusion Matrix: It is also called as contingency table. In our case the result is in two classes so it is 2 X 2 confusion matrix. Number of correctly classified instances are diagonal in the matrix and others are incorrectly classified. 4. EXPERIMENTAL SETUP [20] Weka environment is a popular suit of machine learning written in java developed at the university of Waikato, New Zealand. It provides GUI to its user. Weka provides a wide range of uni and multivariate parametric and non parametric tests. It is having list of feature selection
  • 6. International Journal of Computer Science & Information Technology (IJCSIT) Vol 7, No 3, June 2015 120 techniques. Weka supports data preprocessing, clustering, classifications, regression, visualization, and feature selection. 4.1 Data Source To evaluate and analyze data mining classification algorithms UCI Diabetes data set is used this data set have nine attributes and 768 instances. Table 1. Data Descriptiion S.No. Name Description 1. Pregnancy Number of times pregnant 2. Plasma Plasma glucose concentration a 2 hours in an oral glucose tolerance test. 3. Pres Diastolic blood pressure (mm Hg) 4. Skin Triceps skin fold thickness (mm) 5. Insulin 2-Hour serum insulin (mu U/ml) 6. Mass Body mass index (weight in kg/(height in m2) 7. Pedi Diabetes pedigree function 8. Age Age(in years) 9. Class Class variable (False or True) 4.2. Result Evaluation Sets of algorithms (Tree, Function, Rule & Bayesian) used for performance evaluation in terms of their Execution time, Accuracy, Precision, Recall, ROC and PRC. Followings are the steps taken up for their evaluation. Step 1 4.2.1. Pre-processing During the pre-processing the dataset which is used for evaluation is processed using filters. Basically, data pre-processing helps in removing out of range values, missing values, impossible data combinations etc. The quality of data is first and foremost requirement before analysis. The result of data preprocessing is the final training set. Preprocessing of data is done using supervised filter discrete method [12]. Step 2 4.2.2. Training During the training algorithms are applied to the data so that it learns well. A training set is used along with a supervised learning method to train a knowledge dataset which can be further used
  • 7. International Journal of Computer Science & Information Technology (IJCSIT) Vol 7, No 3, June 2015 121 by an artificial intelligence machine. Cross validation aims to test the model in training phase in order to limiting the problems of data overfitting and gives an insight on how the model will generalize to an independent data set.The 10 fold cross validation is used for classification of the dataset. Step 3 4.2.3. Testing The purpose of testing is to validate whether the trained data correctly classifies the given dataset or not. 10-fold cross validation signifies that the data is divided into 10 chunks and train 10 times, treating treating a different chunk as the holdout set each time. Testing can be done on new data as well as on the part of the dataset that has not been used for training. The aim in cross-validation is to ensure that every example from the original dataset has the same chance of appearing in the training and testing set [11]. 5. RESULT Execution Time, TP Rate, FP Rate, Precision, Recall, F Measure, Accuracy, ROC Area, PRC Area, and Confusion Matrix are the measures used for performance evaluation.All algorithms discussed for comparison are filtered to identify the effectiveness of their higher precision and higher accuracy of classification. The overall performance evaluation table are given below. Table 2. Performance Evaluation of classifiers Acc. TP FP Pre. Recall F Mea. ROC PRC Confusion Matrix TREE BASED CLASSIFICATION A B J48 78.26 0.73 0.40 0.73 0.73 0.71 0.75 0.73 115 113 A True 52 448 B False Random Tree 74.61 0.66 0.39 0.67 0.66 0.66 0.66 0.65 147 121 A True 140 360 B False FUNCTION BASED CLASSIFICATION A B Logistics 78.65 0.75 0.33 0.75 0.75 0.75 0.81 0.80 155 113 A True 77 423 B False MLP 75.91 0.71 0.34 0.71 0.71 0.71 0.77 0.78 158 110 A True 110 390 B False RULE BASED CLASSIFICATON A B One R 74.74 0.73 0.39 0.72 0.73 0.72 0.67 0.66 125 143 A True 62 438 B False Zero R 65.10 0.65 0.65 0.42 0.65 0.51 0.50 0.54 0 268 A True 0 500 B False BAYES CLASSIFICATION A B Baye’s 77.87 0.75 0.30 0.75 0.75 0.75 0.83 0.82 175 93 A True 99 401 B False Naive Baye’s 77.87 0.75 0.30 0.75 0.75 0.75 0.83 0.82 172 96 A True 93 407 B False
  • 8. International Journal of Computer Science & Information Technology (IJCSIT) Vol 7, No 3, June 2015 122 6. RESULT DISCUSSION 6.1. Computation Time This measure depicts time taken by algorithm for result evaluation. In this ZeroR and Naive Baye’s classifiers performs best among all. Table 3. Computation time of classifiers J48 Random Tree Logistics MLP OneR ZeroR Baye’s Naive Baye’s Com.Time 130ms 50 ms 200 ms 3950 ms 20 ms Less than 10 ms 50 ms Less than 10 ms 6.2. Accuracy, Precision, Recall, TP & FP Precision and accuracy are related terms. In statistics measuring the degree of closeness is accuracy while precision is reproducibility (the degree to which repeated measurements under unchanged conditions shows the same result). When a system contains systematic error increase in sample size, increase in precision does not increase the accuracy. Eliminating the systematic error improves accuracy but does not change precision. The evaluated results are as follows- Table 4. Accuracy, Precision, Recall, TP & FP values J48 Random Tree Logistics MLP OneR ZeroR Baye’s Naive Baye’s Accuracy 78.26 74.61 78.65 75.91 74.74 65.10 77.87 77.87 Precision 0.726 0.666 0.747 0.714 0.724 0.424 0.751 0.753 Recall 0.733 0.66 0.753 0.714 0.733 0.651 0.75 0.754 TP 0.733 0.66 0.753 0.714 0.733 0.651 0.75 0.754 FP 0.408 0.392 0.328 0.344 0.391 0.651 0.295 0.298 Figure 3. Simulation result of TP and FP
  • 9. International Journal of Computer Science & Information Technology (IJCSIT) Vol 7, No 3, June 2015 123 In the plotted diagram (Figure 3) Series 1 represents true positive value while Series 2 represents false positive value, with the observation of the plotted data it is clearly visible that ZeroR classifier having no impact on TP and FP for this dataset. Figure 4. Simulation result of Precision and Recall In the plotted diagram (Figure 4) Series 1 represents recall while Series 2 represents precision value. Based on the above results, we can observe that for the diabetes dataset the highest accuracy is 78.26% (J48) and the minimum is 65.10 (ZeroR) while in case of precision Naive Baye’s (75.3%) performs best among all. A measurement system is considered valid if both (accuracy & precision) are accurate and precise. In fact, with the consideration of both the measures Naive Baye’s classifier present at the top and OneR lies at the bottom of the chart. Recall is the fraction of relevant instances that are retrieved. Precision and recall both are inversely proportional to each other. Both precision and recall are based on measurement of relevance. So in most of the cases performance of a classifier is always measured in terms of both. Considering both (precision & recall) in above table, Bayesian classifier performs best among all, followed by Funtion based and Tree based classifiers, while Rule based classifier lies at the bottom. 6.3 F-Measure & ROC F-Measure aggregates the precision and recall. The classifier’s performance can be measure by considering precision & recall both. Table 8. J48 Random Tree Logistics MLP OneR ZeroR Baye’s Naive Baye’s F-Measure 0.714 0.663 0.748 0.714 0.719 0.513 0.751 0.754 ROC 0.745 0.658 0.811 0.766 0.671 0.497 0.825 0.825 Based on above table 8 it is clearly visible that the performance order of classifiers are: Bayesian, Funtion based, Tree based, and Rule based. While Naive baysian (F Mea.=0.754) classifier performs best among all.
  • 10. International Journal of Computer Science & Information Technology (IJCSIT) Vol 7, No 3, June 2015 124 7. CONCLUSION The aim of data mining algorithm is to get best among available. In this paper different sets (Tree, Function, Rule & Bayesian) of classification algorithms are used for performance evaluation. These algorithms are compared on the basis of execution time, TP Rate, FP Rate, Precision, Recall, Accuracy, ROC and PRC. ROC and PRC are graphical representation used for ease of understanding. Weka tool is used to evaluate and investigate the performance of four different categories of classifiers. The raw numbers are shown in the confusion matrix (Table 2), with A and B representing the class labels. Here in the experiment we are using 768 instances, so the percentages and raw numbers add up comes out AA+BB, AB+BA.The percentage of correctly classified instances is often called accuracy. We compare all the parameters and found that Naive bayes classifier performs best among all while ZeroR classifier only provides benchmark for classification. ROC and PRC graphical measures are used for quick review of all classifiers. According to the result the performance order (highest to lowest) of the algorithms are: Bayesian, Function, Tree and Rule. 8. FUTURE WORK Validataion of results using other datasets is required before generalizing result findings. REFERENCES [1] Smith, J., W., Everthart, J.,E., Dickson, W.,C., Knowler, W.,C. and Johannes, R.,S.,Using the ADAP learning algorithm to forecast the onset of diabetes mellitus, in Proceedings of the Symposium on Computer Applications and Medical Care, IEEE Computer Society Press, 1988, pp. 261-265 [2] Asha Rajkumar,Sophia Reena.G., “Diagnosis of Heart Disease Using Data Mining Algorithm”, Global Journal of Computer Sci- ence and Technology, Vol-10, 2010, pp. 38-46. [3] A.Khemphila,V.Boojing, “Comparing Performance of logistic regression,decision tree and neural network for classifying heart disease patients”, Proceeding of International conference on Com- puter Information System and Industrial Management Application, 2010, pp.193-198. [4] K.Srinivas, B.Kavitha Rani,A.Govrdhan, Applications of Data Mining Techniques in +health care and Prediction Heart Attacks, International Journal on Computer Science and Engineering (IJCSE), vol.II, 2010, pp.250-255. [5] Elma kolce (cela), Neki Frasheri, “A Literature Review of Data Mining Techniques used in Healthcare Databases”, ICT Innova- tions 2012 Web Proceedings-Poster Session. [6] Huy Nguyen Anh Pham and Evangelos Triantaphyllou “Prediction of Diabetes by Employing a New Data Mining Approach Which Balances Fitting and Generalization” Department of Computer Science, 298 Coates Hall, Louisiana State University, Baton Rouge, LA 70803. [7] Ms.S.Sapna, Dr.A.Tamilarasi “Data mining – Fuzzy Neural Ge- netic Algorithm in predicting diabetes” Department Of Com- puter Applications (MCA), K.S.R College of Engineering “BOOM 2K8”, Research Journal on Computer Engineering, March 2008. [8] Karthikeyini.V., Pervin begum.I., “Comparison a performance of data mining algorithms (CPDMA) in prediction of Diabetes Disease”, International journal of Computer Science and Engineer- ing, Vol.5, No. 03, March 2013, pp. 205-210. [9] Karthikeyini.V., Pervin begum.I., Tajuddin.K., Shahina Begum, “Comparative of data mining classification algorithm (CDMCA) Diabetes Disease Prediction”, International journal of Computer Applications, Vol.60, No. 12, Dec. 2012, pp. 26-31 [10] K.R. Lakshmi and S. Prem Kumar, Utilization of Data Mining Techniques for Prediction of Diabetes Disease Survivability. IJSER, Vol. 4, Issue 6, June 2013. [11] http://www.sussex.ac.uk/Users/christ/crs/ml/lec03a.html [12] http:// weka.sourceforge.net/doc.dev/weka/filters/supervised/ [13] http://chem-eng.utoronto.ca/~datamining/dmc/zeror.htm [14] http://chem-eng.utoronto.ca/~datamining/dmc/oner.htm
  • 11. International Journal of Computer Science & Information Technology (IJCSIT) Vol 7, No 3, June 2015 125 [15] http://chem-eng.utoronto.ca/~datamining/dmc/naive_bayesian.htm [16] http://chem-eng.utoronto.ca/~datamining/dmc/logistic_regression.htm [17] http://neuroph.sourceforge.net/tutorials/MultiLayerPerceptron.html [18] Jiwei Han and Micheline Kamber: Data Mining Concepts and Techniques, Elsevier Inc., Edition 2, 2006, ISBN no. 978-81-312-0535-8. [19] Decision Tree at http://chemeng.utoronto.ca/~datamining/dmc/decision_tree.htm [20] WEKA Tool at http://www.cs.waikato.ac.nz/ml/weka/ Authors Mr. Saurabh Kumar Srivastava is a research scholar in the department of Computer Science & Engineering at JIIT Noida, India. He obtained his M-Tech (Computer Engineering) from Shobhit University and B-Tech(C.S.) from Uttar Pradesh Technical University, Lucknow (U.P.). He has been in teaching since 7 years. During his teaching he has coordinated several Technical fests and International/National Conferences at Institute level. He has attended several seminars, workshops and conferences at various levels. His area of research includes Datamining, Machine Learning, Artificial Intelligence, and Web Technology. Dr. Sandeep Kumar Singh is an Assistant Professor (Senior Grade) at JIIT in Noida, India. He has completed his Ph.D in (Computer Science and Engineering). He has around 13+ years’ experience, which includes corporate training and teaching. His areas of interests are Software Engineering, Requirements Engineering, Software Testing, Web Application Testing,Internet and Web Technology, Object Oriented Technology, Programming Languages, Information Retrieval and Data Mining, Model based Testing and Applications of Soft computing in Software Testing and Databases. He is currently supervising 4 Ph.D's in Computer Science. He has around 28 published papers to his credit in different international journals and conferences.