Downloaded 568 times

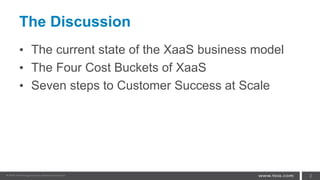

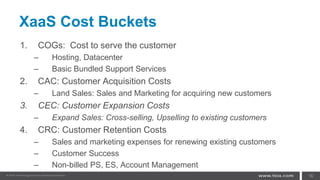
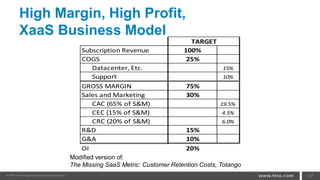
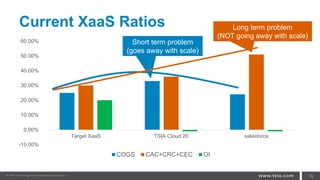
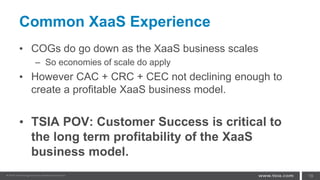
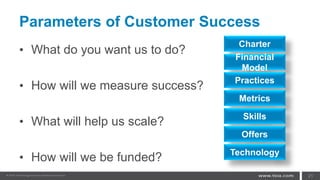
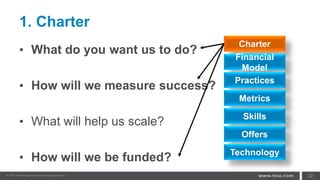
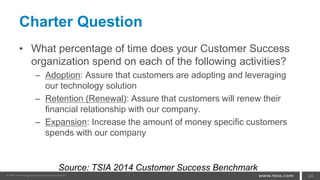
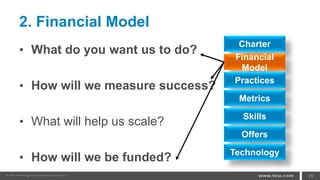
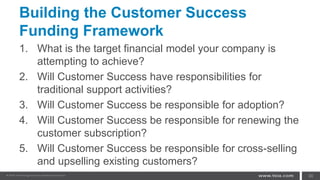
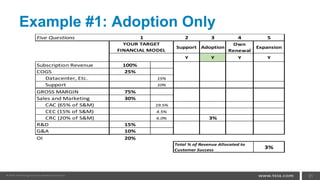
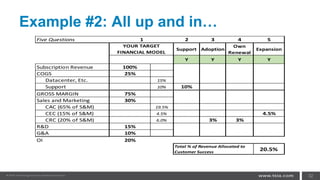
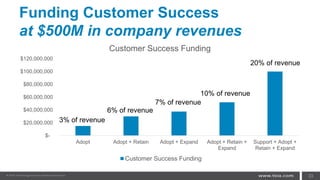
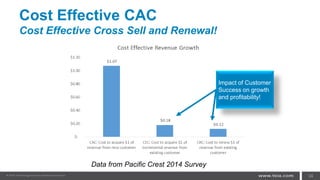
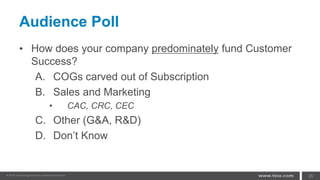
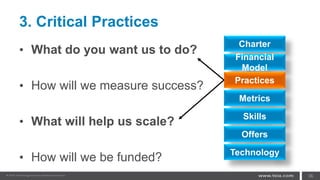
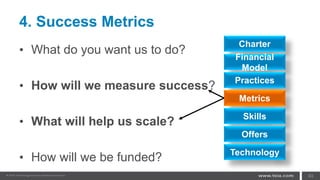
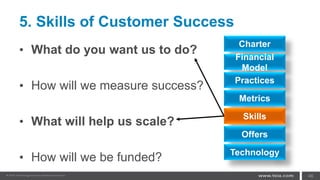
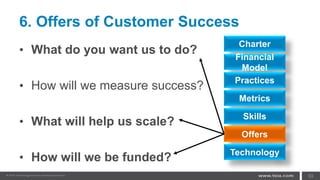

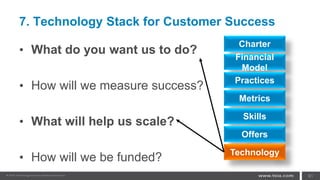
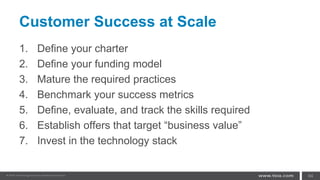

This document discusses seven steps for achieving customer success at scale for software as a service (SaaS) companies. It begins by reviewing the current state of the SaaS business model and profitability challenges. It then outlines four cost buckets that impact profitability: cost of goods sold, customer acquisition costs, customer expansion costs, and customer retention costs. The document proposes that customer success is critical to long-term profitability. It provides seven steps for customer success at scale, including establishing a charter, financial model, critical practices, success metrics, skills, offers, and technology to support the customer lifecycle from adoption to renewal to expansion.