Download to read offline


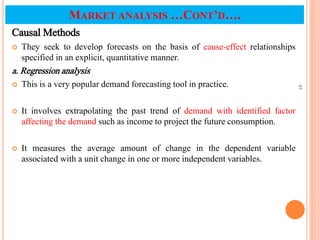


![CONSIDERATIONS IN PROJECTAPPRAISAL
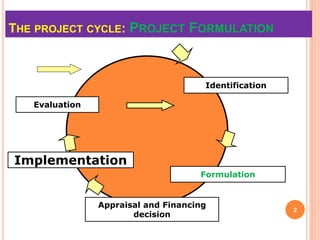
1. Only manageable number of project proposals has to be received.
2. Precise, up to date, specific, flexible, objective, and measurable appraisal
benchmarks should be used.
3. Proposed projects should be appraised for their feasibility from all aspects and
dimensions.
4. Responsible consultants with professional integrity should be invited to help in
the appraisal studies.
5. As much as experience on previously appraised projects could be an excellent
input, it should not cloud the objectivity on stakeholders on their decisions.
6. Data inputs and outputs provide by project promoters in their proposals should
be checked for factuality and timeliness by the appraising experts/analysis.
7. For the project to move to the next phases, appraising stakeholders should
present their feedbacks as quickly as possible.
8. An individual stakeholder [sponsor, banks, government agency, supplier, etc]
should consider the potential of the proposed project to satisfy the demand of
the other stakeholders.
167
167](https://image.slidesharecdn.com/525412627-2-project-management-2018-bais-3-4-230103004805-a357172f/85/525412627-2-Project-Management-2018-BAIS-3-4-ppt-167-320.jpg)

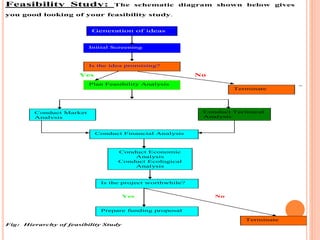
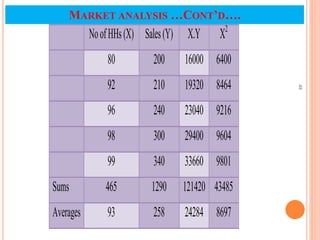
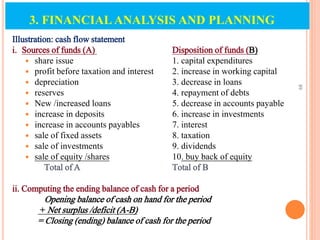
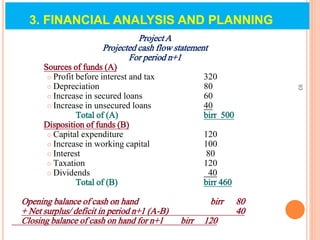
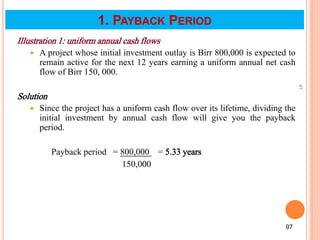
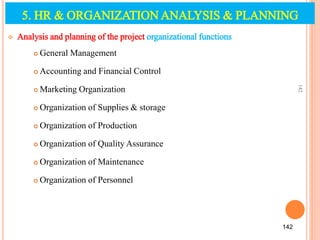
![4. Economic Appraisal
Create fair employment opportunities
Transform the site it uses for the project
Deliver its outputs on time to the target users
Pay taxes
Transfer technology to the economic system
Create capital [foreign or domestic] for investment
The Balance between the requirements vs returns from a project is the
basis of project’s economic appraisal.
170
170
PROJECT APPRAISAL FACTORS](https://image.slidesharecdn.com/525412627-2-project-management-2018-bais-3-4-230103004805-a357172f/85/525412627-2-Project-Management-2018-BAIS-3-4-ppt-170-320.jpg)
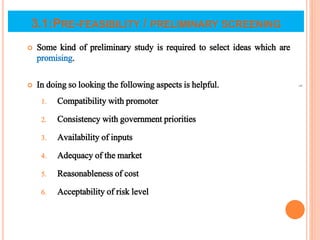
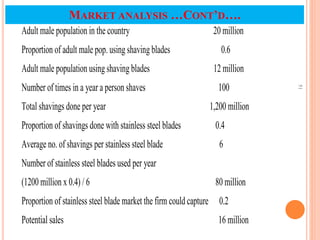
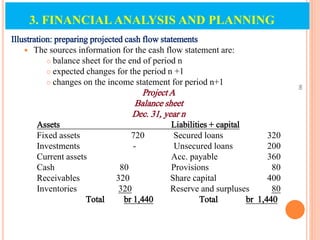
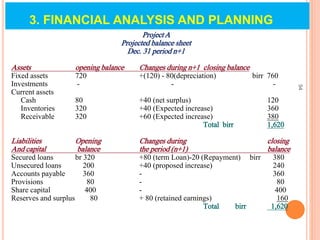
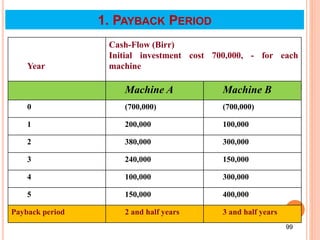
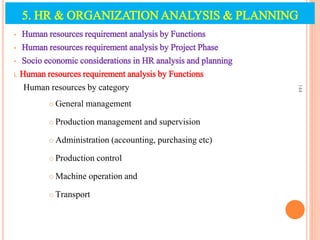
![4. Economic Appraisal
Create fair employment opportunities
Transform the site it uses for the project
Deliver its outputs on time to the target users
Pay taxes
Transfer technology to the economic system
Create capital [foreign or domestic] for investment
The Balance between the requirements vs returns from a project is the
basis of project’s economic appraisal.
171
171
PROJECT APPRAISAL FACTORS](https://image.slidesharecdn.com/525412627-2-project-management-2018-bais-3-4-230103004805-a357172f/85/525412627-2-Project-Management-2018-BAIS-3-4-ppt-171-320.jpg)


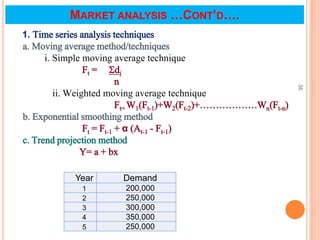
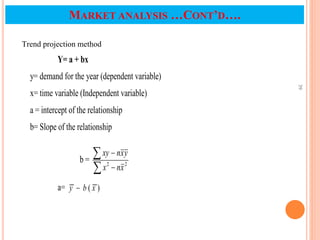
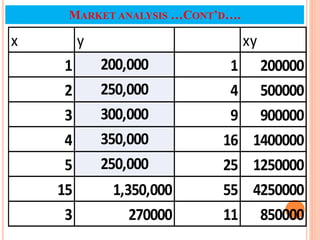
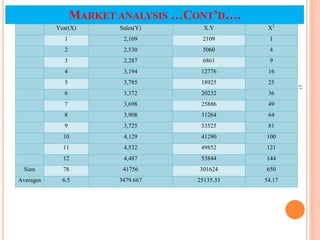
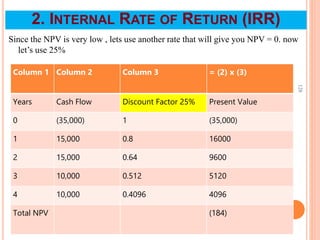
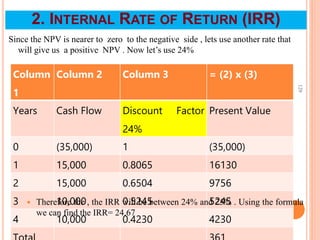
The document discusses project feasibility studies and their importance in project management. It outlines the key components of a feasibility study, including market analysis, technical analysis, financial analysis, economic analysis, environmental analysis, and organizational analysis. It focuses on the steps for conducting a market analysis, which is considered one of the most important components. The major steps discussed are situational analysis, collecting secondary data, conducting a market survey, characterizing the market, demand forecasting, and developing a market plan. Various quantitative and qualitative techniques for demand forecasting are also presented.


