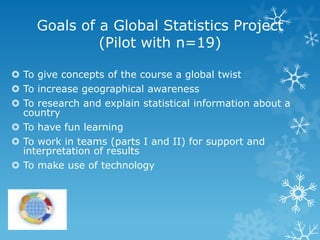
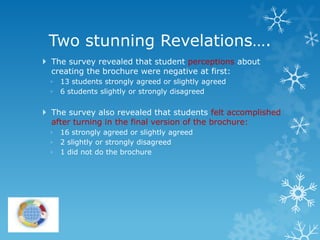
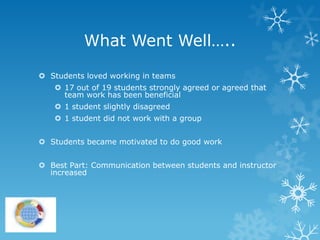
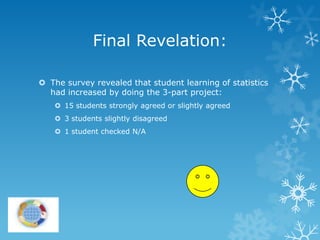
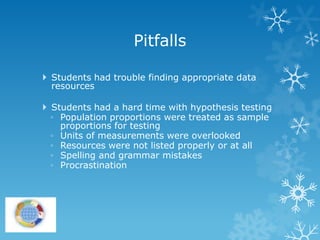
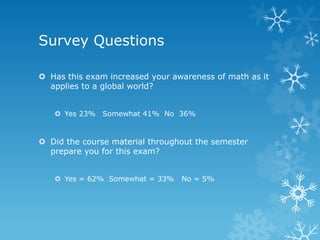
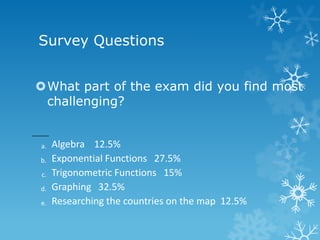
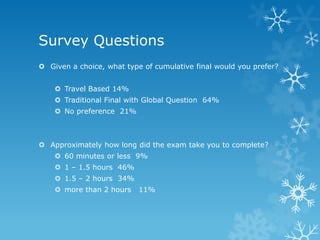
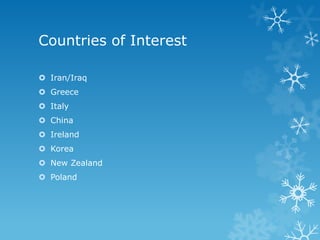
Taking Math Global

AFACCT 2012
Montgomery College – Rockville
Session 5.11 January 6, 2012


 Barbara Leitherer, Donna Tupper
 CCBC - Essex
Session 5.11
Friday, January 5, 2012
Room SW114-B


 Donna Tupper – dtupper@ccbcmd.edu
 Barbara Leitherer – bleitherer@ccbcmd.edu
Goals of a Global Statistics Project
              (Pilot with n=19)

 To give concepts of the course a global twist
 To increase geographical awareness
 To research and explain statistical information about a
  country
 To have fun learning
 To work in teams (parts I and II) for support and
  interpretation of results
 To make use of technology
Project Planning
 Happened over several semesters

 Semester-long project with three parts spanning major concepts

 Individual parts were used to practice, review and create synergy
  of concepts

 Global connection: 2010 Vancouver Olympic Games
Student Work


 Brochures: several drafts possible for improvement


 Samples of Part I


 Survey responses
Student Survey Responses

 Best liked parts:
    Analysis of ski-racing data
    Visualization of data and computation of probability


 Why?:
    Familiarity with formulas and quantitative data
    Easiness of assignment
    Students “felt safe”
Student Survey Responses
 Least liked part:
    Brochure
 Why?:
    Difficulty finding data
    Struggle to set up the brochure outline
    Selection of content
    There was no model what the brochure could look like
    Instructions were not precise for some
    There was no classroom time for the brochure
Two stunning Revelations….
 The survey revealed that student perceptions about
  creating the brochure were negative at first:
 ◦   13 students strongly agreed or slightly agreed
 ◦   6 students slightly or strongly disagreed

 The survey also revealed that students felt accomplished
  after turning in the final version of the brochure:
 ◦   16 strongly agreed or slightly agreed
 ◦   2 slightly or strongly disagreed
 ◦   1 did not do the brochure
What Went Well…..

 Students loved working in teams
    17 out of 19 students strongly agreed or agreed that
     team work has been beneficial
    1 student slightly disagreed
    1 student did not work with a group


 Students became motivated to do good work


 Best Part: Communication between students and instructor
  increased
Final Revelation:

 The survey revealed that student learning of statistics
  had increased by doing the 3-part project:
    15 students strongly agreed or slightly agreed
    3 students slightly disagreed
    1 student checked N/A
Pitfalls

 Students had trouble finding appropriate data
  resources

 Students had a hard time with hypothesis testing
  ◦ Population proportions were treated as sample
    proportions for testing
  ◦ Units of measurements were overlooked
  ◦ Resources were not listed properly or at all
  ◦ Spelling and grammar mistakes
  ◦ Procrastination
Sample Brochures


 Switzerland


 Kazakhstan


 Australia
Discussion and Future Plans


What are your thoughts and
ideas to improve this project?
Around the world in eighty days!

 Final exam for Math 135 – Applied Algebra
  and Trigonometry.
    Terminal math class for NON-College
     Algebra students.
 Given by all full-time faculty during the
  fall 2011 semester.
 Themed based exam designed to take
  students on a trip around the world.
From day trip to world tour!

 Global initiative now required of all general education
  math classes
 As course chair
     Needed examples for adjuncts to use
     Examples needed to be from various parts of the course
 Led to examples from most of the CCO
 Led to it being my cumulative final exam
 Led to my colleagues also using it as their final
Donna Tupper’s Requirement

 Exam had to offer flexibility to other
  instructors.
 It should apply to various disciplines.
 It had to have practical applications.


It had to be something
 new, different and fun!!
Introduction
 We have worked very hard this
  semester, so I think we deserve a
  vacation. In this assignment, you will
  start in Baltimore and travel to such exotic
  locations as Brussels, Cairo, Dubai, Cape
  Town, Mumbai, Moscow, Tokyo and Rio de
  Janeiro. Along the way, you will be
  applying concepts you have learned
  throughout the semester to complete your
  journey. Grab your passport and let’s take
  a trip!
Survey Questions

 Has this exam increased your awareness of math as it
  applies to a global world?


    Yes 23% Somewhat 41% No 36%


 Did the course material throughout the semester
  prepare you for this exam?


    Yes = 62% Somewhat = 33%    No = 5%
Survey Questions


What part of the exam did you find most
 challenging?


a.   Algebra 12.5%
b.   Exponential Functions 27.5%
c.   Trigonometric Functions 15%
d.   Graphing 32.5%
e.   Researching the countries on the map 12.5%
Survey Questions
 Given a choice, what type of cumulative final would you prefer?


     Travel Based 14%
     Traditional Final with Global Question 64%
     No preference 21%


 Approximately how long did the exam take you to complete?
     60 minutes or less 9%
     1 – 1.5 hours 46%
     1.5 – 2 hours 34%
     more than 2 hours    11%
Countries of Interest

 Iran/Iraq
 Greece
 Italy
 China
 Ireland
 Korea
 New Zealand
 Poland
Other Countries???


 Antartica
 Madrid
 The Bermuda Triangle, well
It IS a Triangle


 The distance between Miami and San Juan
  is 1036 miles…
Global Themed Final Exam


         Global
          Final
         Exam
Culture and Math 135
 Math 135 is designed to teach students to apply math to
  various disciplines.


 The exam does not discuss other cultures.
    Not sure the course is designed to do that.


 Exam covers topics applicable in the Physical
  Sciences, Environmental Sciences, Allied
  Health, Women’s Studies, Finance, Geography, Travel
  and Economics.
    These disciplines may be in a better position to discuss the
     cultural ramifications of …
THANK YOU

5.11.tupper,leitherer

  • 1.
    Taking Math Global AFACCT2012 Montgomery College – Rockville Session 5.11 January 6, 2012 Barbara Leitherer, Donna Tupper CCBC - Essex
  • 2.
    Session 5.11 Friday, January5, 2012 Room SW114-B Donna Tupper – dtupper@ccbcmd.edu Barbara Leitherer – bleitherer@ccbcmd.edu
  • 3.
    Goals of aGlobal Statistics Project (Pilot with n=19)  To give concepts of the course a global twist  To increase geographical awareness  To research and explain statistical information about a country  To have fun learning  To work in teams (parts I and II) for support and interpretation of results  To make use of technology
  • 4.
    Project Planning  Happenedover several semesters  Semester-long project with three parts spanning major concepts  Individual parts were used to practice, review and create synergy of concepts  Global connection: 2010 Vancouver Olympic Games
  • 5.
    Student Work  Brochures:several drafts possible for improvement  Samples of Part I  Survey responses
  • 6.
    Student Survey Responses Best liked parts:  Analysis of ski-racing data  Visualization of data and computation of probability  Why?:  Familiarity with formulas and quantitative data  Easiness of assignment  Students “felt safe”
  • 7.
    Student Survey Responses Least liked part:  Brochure  Why?:  Difficulty finding data  Struggle to set up the brochure outline  Selection of content  There was no model what the brochure could look like  Instructions were not precise for some  There was no classroom time for the brochure
  • 8.
    Two stunning Revelations…. The survey revealed that student perceptions about creating the brochure were negative at first: ◦ 13 students strongly agreed or slightly agreed ◦ 6 students slightly or strongly disagreed  The survey also revealed that students felt accomplished after turning in the final version of the brochure: ◦ 16 strongly agreed or slightly agreed ◦ 2 slightly or strongly disagreed ◦ 1 did not do the brochure
  • 9.
    What Went Well….. Students loved working in teams  17 out of 19 students strongly agreed or agreed that team work has been beneficial  1 student slightly disagreed  1 student did not work with a group  Students became motivated to do good work  Best Part: Communication between students and instructor increased
  • 10.
    Final Revelation:  Thesurvey revealed that student learning of statistics had increased by doing the 3-part project:  15 students strongly agreed or slightly agreed  3 students slightly disagreed  1 student checked N/A
  • 11.
    Pitfalls  Students hadtrouble finding appropriate data resources  Students had a hard time with hypothesis testing ◦ Population proportions were treated as sample proportions for testing ◦ Units of measurements were overlooked ◦ Resources were not listed properly or at all ◦ Spelling and grammar mistakes ◦ Procrastination
  • 12.
    Sample Brochures  Switzerland Kazakhstan  Australia
  • 13.
    Discussion and FuturePlans What are your thoughts and ideas to improve this project?
  • 14.
    Around the worldin eighty days!  Final exam for Math 135 – Applied Algebra and Trigonometry.  Terminal math class for NON-College Algebra students.  Given by all full-time faculty during the fall 2011 semester.  Themed based exam designed to take students on a trip around the world.
  • 15.
    From day tripto world tour!  Global initiative now required of all general education math classes  As course chair  Needed examples for adjuncts to use  Examples needed to be from various parts of the course  Led to examples from most of the CCO  Led to it being my cumulative final exam  Led to my colleagues also using it as their final
  • 16.
    Donna Tupper’s Requirement Exam had to offer flexibility to other instructors.  It should apply to various disciplines.  It had to have practical applications. It had to be something new, different and fun!!
  • 17.
    Introduction  We haveworked very hard this semester, so I think we deserve a vacation. In this assignment, you will start in Baltimore and travel to such exotic locations as Brussels, Cairo, Dubai, Cape Town, Mumbai, Moscow, Tokyo and Rio de Janeiro. Along the way, you will be applying concepts you have learned throughout the semester to complete your journey. Grab your passport and let’s take a trip!
  • 18.
    Survey Questions  Hasthis exam increased your awareness of math as it applies to a global world?  Yes 23% Somewhat 41% No 36%  Did the course material throughout the semester prepare you for this exam?  Yes = 62% Somewhat = 33% No = 5%
  • 19.
    Survey Questions What partof the exam did you find most challenging? a. Algebra 12.5% b. Exponential Functions 27.5% c. Trigonometric Functions 15% d. Graphing 32.5% e. Researching the countries on the map 12.5%
  • 20.
    Survey Questions  Givena choice, what type of cumulative final would you prefer?  Travel Based 14%  Traditional Final with Global Question 64%  No preference 21%  Approximately how long did the exam take you to complete?  60 minutes or less 9%  1 – 1.5 hours 46%  1.5 – 2 hours 34%  more than 2 hours 11%
  • 21.
    Countries of Interest Iran/Iraq  Greece  Italy  China  Ireland  Korea  New Zealand  Poland
  • 22.
    Other Countries???  Antartica Madrid  The Bermuda Triangle, well
  • 23.
    It IS aTriangle The distance between Miami and San Juan is 1036 miles…
  • 24.
    Global Themed FinalExam Global Final Exam
  • 26.
    Culture and Math135  Math 135 is designed to teach students to apply math to various disciplines.  The exam does not discuss other cultures.  Not sure the course is designed to do that.  Exam covers topics applicable in the Physical Sciences, Environmental Sciences, Allied Health, Women’s Studies, Finance, Geography, Travel and Economics.  These disciplines may be in a better position to discuss the cultural ramifications of …
  • 27.

Editor's Notes

  • #15 I’d never created a theme based exam before, so a lot of input was requested.
  • #16 We have agreed that the final is worth 20% of the total grade.
  • #17 I didn’t want to force the global perspective on students or faculty. Other faculty may want to go to other locations.
  • #19 Only have a total of 44 responses as of 1/3/12. For my students, students who responded negatively to one question tended to respond negatively to all.
  • #20 Graphing is a Math 082/083 topic! The Algebra is Math 082. 45% of the students found the material in developmental math most challenging.
  • #22 Many of these countries are in the news now.
  • #23 Who wouldn’t want to see the penguins?
  • #24 The distance between Miami and San Juan is 1036 miles. The distance between San Juan and Bermuda is 962 miles. The distance between Bermuda and Miami is 1037 miles. Find the angle formed by the flight paths from Miami to Bermuda and the flight path between Bermuda and San Juan.
  • #26 I’d make a terrible travel agent!
  • #27 I haven’t figured out a way to make culture a seamless transition in the course. Anything now would be forced.