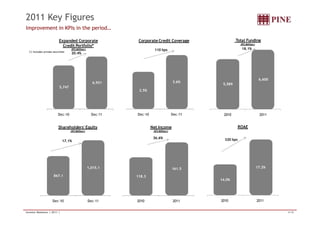
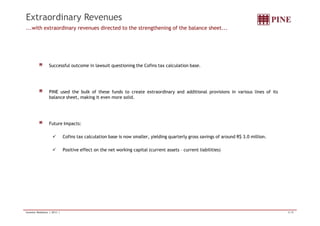
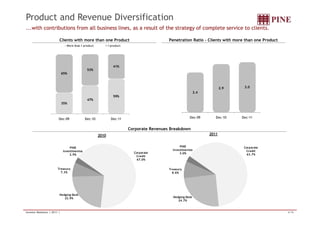
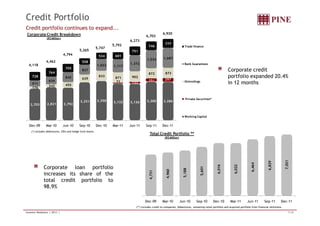
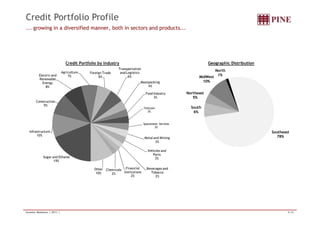
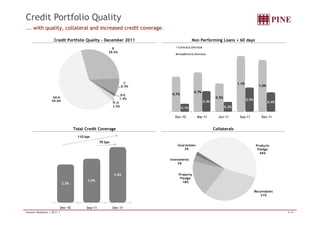
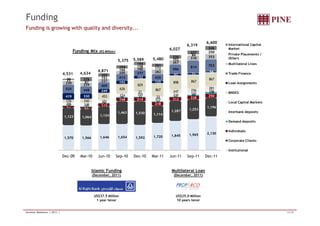
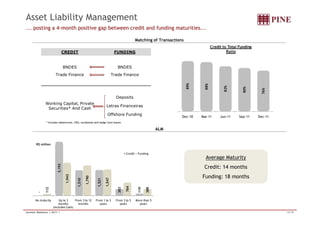
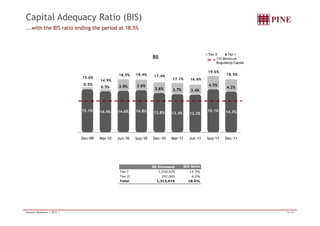
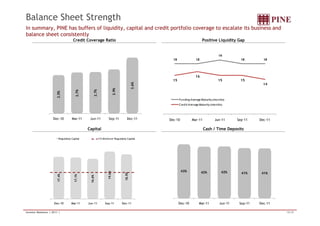
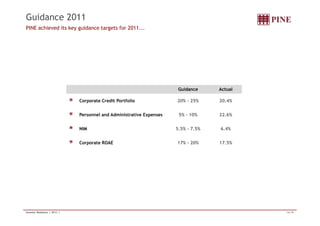
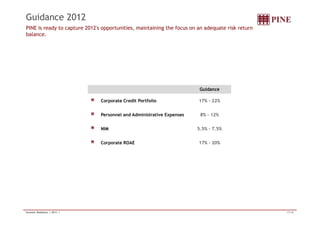
Earnings Conference Call 
4Q11 and 2011
Content 
2011 Events and Highlights Page 3 
2011 Key Figures Page 4 
Extraordinary Revenues Page 5 
Product and Revenue Diversification Page 6 
Credit Portfolio Page 7 
Credit Portfolio Profile Page 8 
Credit Portfolio Quality Page 9 
Hedging Desk Page 10 
PINE Investimentos Page 11 
Funding Page 12 
Funding and Credit Portfolio Maturities Page 13 
Capital Adequacy Ratio (BIS) Page 14 
Solid Balance Sheet Page 15 
2011 Guidance Page 16 
2012 Guidance Page 17 
Investor Relations | 2011 | 2/18
2011 Events and Highlights 
Market Recognition. 
Two-notch upgrade on global scale by S&P to BB+. 
Four-notch upgrade on national scale by S&P to brAA. 
Capital increase: German bank DEG buys a 2.9% stake in PINE’s capital. 
US$ 25-million, 10-year funding transaction with Proparco in December 2011. 
First financial institution controlled by Brazilian shareholders to raise funding in Islamic format, in the 
amount of US$ 37.5 million from Saudi Arabia-based Al Rajhi Bank, booked in 1Q12. 
Syndicated A/B Loan, globally coordinated by IIC, in January, 2011, amounting to US$106 million. 
High credit coverage, liquidity and capital ratios, as well as a positive liquidity gap. 
Ranked 2nd largest commodities NDF provider for clients and 13th largest derivatives provider in Cetip’s 
ranking. 
13th largest credit provider to companies and 12th largest credit provider to large companies based on 
Exame magazine’s “Maiores e Melhores” guide. 
“Most green bank” in Latin America and Caribbean according to International Finance Corporation 
(IFC). 
Investor Relations | 2011 | 3/18
2011 Key Figures 
Improvement in KPIs in the period… 
Expanded Corporate 
Credit Portfolio* 
(*) Includes private securities 
5,747 
6,921 
(R$ Million) 
20.4% 
Dec-10 Dec-11 
5,589 
Total Funding 
6,600 
(R$ Million) 
18.1% 
2010 2011 
Corporate Credit Coverage 
2.5% 
3.6% 
110 bps 
Dec-10 Dec-11 
Shareholders' Equity 
17.1% 
867.1 
1,015.1 
(R$ Million) 
Dec-10 Dec-11 
320 bps 
14.0% 
17.2% 
ROAE 
2010 2011 
118.3 
161.5 
Net Income 
(R$ Million) 
36.6% 
2010 2011 
Investor Relations | 2011 | 4/18
Extraordinary Revenues 
...with extraordinary revenues directed to the strengthening of the balance sheet... 
Successful outcome in lawsuit questioning the Cofins tax calculation base. 
PINE used the bulk of these funds to create extraordinary and additional provisions in various lines of its 
balance sheet, making it even more solid. 
Future Impacts: 
 Cofins tax calculation base is now smaller, yielding quarterly gross savings of around R$ 3.0 million. 
 Positive effect on the net working capital (current assets – current liabilities) 
Investor Relations | 2011 | 5/18
Product and Revenue Diversification 
...with contributions from all business lines, as a result of the strategy of complete service to clients. 
Clients with more than one Product Penetration Ratio – Clients with more than one Product 
More than 1 product 1 product 
35% 
47% 
59% 
65% 
53% 
41% 
2.4 
2.9 3.0 
Dec-09 Dec-10 Dec-11 Dec-09 Dec-10 Dec-11 
Corporate Revenues Breakdown 
Corporate 
Credit 
67.0% 
PINE 
Investimentos 
2.9% 
Treasury 
7.3% 
Hedging Desk 
22.9% 
2010 
Corporate 
Credit 
63.7% 
PINE 
Investimentos 
3.0% 
Treasury 
8.6% 
Hedging Desk 
24.7% 
2011 
Investor Relations | 2011 | 6/18
Credit Portfolio 
Corporate credit 
portfolio expanded 20.4% 
in 12 months 
Credit portfolio continues to expand... 
2,703 2,821 2,792 
3,251 3,358 3,132 3,126 3,300 3,286 
- - - 
- - 
71 122 
251 297 
176 
242 455 
629 
833 871 902 
872 873 
511 
634 
842 
827 
1,022 1,117 
1,372 
1,534 1,687 
728 
764 
705 
558 
534 601 
751 
746 
777 
Corporate Credit Breakdown 
(R$ Million) 
Trade finance 
Bank Guarantees 
Onlendings 
Private Securities* 
4,118 
4,462 
4,794 
5,265 
5,747 
5,792 
6,273 
6,703 
6,920 
Dec-09 Mar-10 Jun-10 Sep-10 Dec-10 Mar-11 Jun-11 Sep-11 Dec-11 
(*) Includes debentures, CRIs and hedge fund shares 
Corporate loan portfolio 
increases its share of the 
total credit portfolio to 
98.9% 
Working Capital 
Total Credit Portfolio ** 
4,731 
(R$ Million) 
4,960 
5,188 
5,601 
6,016 
6,022 
6,464 
6,829 
Dec-09 Mar-10 Jun-10 Sep-10 Dec-10 Mar-11 Jun-11 Sep-11 Dec-11 
(**) Includes credit to companies, Debentures, remaining retail portfolio and acquired portfolio from financial istitutions 
7,021 
Investor Relations | 2011 | 7/18
Credit Portfolio Profile 
... growing in a diversified manner, both in sectors and products... 
Credit Portfolio by Industry Geographic Distribution 
Electric and 
Renewable 
Energy 
8% 
Construction 
9% 
Agriculture 
7% 
Foreign Trade 
6% 
Transportation 
and Logistics 
6% 
Meatpacking 
4% 
Food Industry 
3% 
Telecom 
3% 
MidWest 
10% 
Northeast 
5% 
South 
6% 
North 
1% 
Infrastructure 
Sugar and Ethanol 
19% 
10% 
Specialized Services 
3% 
Metal and Mining 
3% 
Vehicles and 
Parts 
3% 
Beverages and 
Tobacco 
2% 
Financial 
Institutions 
2% 
Chemicals 
2% 
Other 
10% 
Southeast 
78% 
Investor Relations | 2011 | 8/18
Credit Portfolio Quality 
... with quality, collateral and increased credit coverage. 
Credit Portfolio Quality – December 2011 Non Performing Loans  60 days 
AA-A 
59.0% 
B 
28.6% 
C 
8.5% 
D-E 
1.4% 
F-H 
2.5% 
0.7% 
0.7% 
0.5% 
1.1% 
1.0% 
0.1% 
0.4% 
0.2% 
0.5% 
0.4% 
Contracts Overdue 
Installments Overdue 
Dec-10 Mar-11 Jun-11 Sep-11 Dec-11 
Total Credit Coverage Collaterals 
2.5% 
110 bps 
2.9% 
3.6% 
70 bps 
Dec-10 Sep-11 Dec-11 
Products 
Pledge 
46% 
Receivables 
31% 
Guarantees 
2% 
Investments 
3% 
Property 
Pledge 
18% 
Investor Relations | 2011 | 9/18
Hedging Desk 
PINE is the 2nd largest provider of commodities NDFs for clients*. 
Client Notional Derivatives Portfolio by Market Client Notional Derivatives Portfolio by Industry 
December 31st, 2011 
Fixed 
Income 
31% 
Commodities 
8% 
Currencies 
61% 
Foreign Trade 
12% 
Sugar and 
Ethanol 
19% 
Transportation 
and Logistics 
10% 
Beverages and 
Tobacco 
9% 
Metal and Mining 
8% 
Textile and 
Apparel 
5% 
Electric and 
Renewable 
Energy 
5% 
Construction 
2% 
Meatpacking 
2% 
Infrastructure 
1% 
Other 
6% 
Notional: R$3.7 billion 
Agriculture 
21% 
Market Segments Portfolio Profile 
Scenario on December, 31st : 
Duration: 273 days 
Mark-To-Market : R$157 million 
Stress Scenario (Dollar: +20% and Commodities Prices: -30%): 
Stressed MTM: R$333 million 
Fixed Income: Fixed, Floating, Inflation, Libor 
Currencies: Dollar, Euro, Yen, Pound, Canadian Dollar, 
Australian Dollar, Spot 
Commodities: Sugar, Soybean (Grain, Meal and Oil), Corn, 
Cotton, Metals, Energy 
*Source: Cetip Report of December. 
Investor Relations | 2011 | 10/18
PINE Investimentos 
Creating value to clients and optimizing the Bank's use of capital 
Market Segments Revenues (R$ Million) 
Capital Markets: Structuring, securities placements, 
structured operations 
Advisory 
Investment Management: Fixed Income, Credit Hedge 
Funds, Exclusive Mandates, Portfolio Management 12,771 
14,927 
16.9% 
2010 2011 
Selected Transactions in 2011 
Debentures and 
Subscription Bonus 
R$25,000,000.00 
Coordinator 
June 
Debentures and 
ICVM 476 
Issuer 
R$242,400,000.00 
Leader Coordinator 
June 
US$ 75,000,000 
11.50% Senior Secured Notes due 2016 
US$300,000,000.00 
Global Medium Term Note Program 
Co-Manager 
May 
Debentures 
Issuer 
R$80,000,000.00 
Leader Coordinator 
June 
Debentures and 
ICVM 476 
Issuer 
R$ 30,000,000.00 
December 
Investor Relations | 2011 | 11/18
Funding 
Funding is growing with quality and diversity... 
91 85 1,196 
1,463 1,530 1,114 
1,287 
1,253 
175 
198 214 
218 
212 228 
250 
39 50 
36 
46 42 
41 
53 66 
112 
206 248 
201 
224 320 
272 
210 165 
106 
- - 
- 
- 
21 
33 
247 256 
281 
176 242 
453 
626 
829 
867 
898 867 
867 
419 330 
249 
192 
152 
125 
92 71 
56 
525 448 
405 
413 
377 
435 
596 
814 753 
230 
239 
227 
200 
160 
282 
267 
310 353 
77 87 
151 
166 
158 
172 
102 
86 
250 
75 276 
203 
194 
194 
201 
220 
237 
246 
Funding Mix (R$ Million) 
International Capital 
Market 
Private Placements / 
Others 
Multilateral Lines 
Trade Finance 
Loan Assignments 
BNDES 
Local Capital Markets 
Interbank deposits 
5,375 5,589 
4,871 
4,531 4,634 
5,480 
6,027 
6,319 
6,600 
1,123 1,064 1,124 
1,570 1,566 1,646 1,654 1,592 1,720 1,845 1,965 2,130 
Dec-09 Mar-10 Jun-10 Sep-10 Dec-10 Mar-11 Jun-11 Sep-11 Dec-11 
Islamic Funding 
(December, 2011) 
US$37.5 Million 
1 year tenor 
Multilateral Loan 
(December, 2011) 
US$25.0 Million 
10 years tenor 
Demand deposits 
Individuals 
Corporate Clients 
Institutional 
Investor Relations | 2011 | 12/18
Asset Liability Management 
... posting a 4-month positive gap between credit and funding maturities... 
Matching of Transactions 
CREDIT FUNDING 
BNDES BNDES 
Trade Finance Trade Finance 
Deposits 
Working Capital, Private 
Securities* And Cash 
Letras Financeiras 
Offshore Funding 
89% 
88% 
82% 
80% 
76% 
Credit to Total Funding 
Ratio 
ALM 
Dec-10 Mar-11 Jun-11 Sep-11 Dec-11 
Average Maturity 
Credit: 14 months 
Funding: 18 months 
* Includes debentures, CRIs, eurobonds and hedge fund shares 
R$ million 
- 
3,193 
1,510 
1,521 
383 
Credit Funding 
119 
112 
1,943 
1,790 
1,547 
764 
388 
No maturity Up to 3 
months 
(includes Cash) 
From 3 to 12 
months 
From 1 to 3 
years 
From 3 to 5 
years 
More than 5 
years 
Investor Relations | 2011 | 13/18
Capital Adequacy Ratio (BIS) 
15.1% 14.4% 14.6% 14.8% 13.8% 13.4% 13.2% 
15.1% 14.3% 
0.5% 
0.5% 3.9% 3.6% 
3.6% 3.7% 3.4% 
4.5% 
4.2% 
BIS 
Tier II Tier I 
15.6% 
14.9% 
18.5% 18.4% 17.4% 
17.1% 16.6% 
11% Minimum 
Regulatoty Capital 
19.6% 
18.5% 
...with the BIS ratio ending the period at 18.5% 
Dec-09 Mar-10 Jun-10 Sep-10 Dec-10 Mar-11 Jun-11 Sep-11 Dec-11 
R$ thousand BIS Ratio 
Tier I 1,016,629 14(.%3%) 
Tier II 297,045 4.2% 
Total 1,313,674 18.5% 
Investor Relations | 2011 | 14/18
Balance Sheet Strength 
In summary, PINE has buffers of liquidity, capital and credit portfolio coverage to escalate its business and 
balance sheet consistently 
Positive Credit Coverage Ratio Liquidity Gap 
18 18 
19 
18 18 
15 
16 
15 15 
14 
Funding Average Maturity (months) 
Credit Average Maturity (months) 
2.5% 
2.7% 
2.7% 
2.9% 
3.6% 
Dec-10 Mar-11 Jun-11 Sep-11 Dec-11 
Capital Cash / Time Deposits 
Regulatoty Capital 11% Minimum Regulatoty Capital 
17.4% 
17.1% 
16.6% 
19.6% 
18.5% 
Dec-10 Mar-11 Jun-11 Sep-11 Dec-11 
43% 42% 42% 41% 41% 
Dec-10 Mar-11 Jun-11 Sep-11 Dec-11 
Investor Relations | 2011 | 15/18
Guidance 2011 
Guidance Actual 
PINE achieved its key guidance targets for 2011... 
Corporate Credit Portfolio 20% - 25% 20.4% 
Personnel and Administrative Expenses 5% - 10% 22.6% 
NIM 5.5% - 7.5% 6.4% 
Corporate ROAE 17% - 20% 17.5% 
Investor Relations | 2011 | 16/18
Guidance 2012 
PINE is ready to capture 2012's opportunities, maintaining the focus on an adequate risk return 
balance. 
Guidance 
Corporate Credit Portfolio 17% - 22% 
Personnel and Administrative Expenses 8% - 12% 
NIM 5.5% - 7.5% 
Corporate ROAE 17% - 20% 
Investor Relations | 2011 | 17/18
Investor Relations 
Norberto Zaiet Junior 
CFO 
Nira Bessler 
Head of Investor Relations 
Alejandra Hidalgo 
Investor Relations Manager 
Alexandre Cavalcanti 
Investor Relations Manager 
Phone: +55-11-3372-5553 
www.bancopine.com.br/ir 
ir@bancopine.com.br 
This presentation contains forward-looking statements relating to the prospects of the business, estimates for operating and financial results, and those related to growth prospects of PINE. These are 
merely projections and, as such, are based exclusively on the expectations of PINE’s management concerning the future of the business and its continued access to capital to fund the Company’s business 
plan. Such forward-looking statements depend, substantially, on changes in market conditions, government regulations, competitive pressures, the performance of the Brazilian economy and the industry, 
among other factors and risks disclosed in PINE’s filed disclosure documents and are, therefore, subject to change without prior notice. 
Investor Relations | 2011 | 18/18

4Q11 Results Conference Call

  • 1.
  • 2.
    Content 2011 Eventsand Highlights Page 3 2011 Key Figures Page 4 Extraordinary Revenues Page 5 Product and Revenue Diversification Page 6 Credit Portfolio Page 7 Credit Portfolio Profile Page 8 Credit Portfolio Quality Page 9 Hedging Desk Page 10 PINE Investimentos Page 11 Funding Page 12 Funding and Credit Portfolio Maturities Page 13 Capital Adequacy Ratio (BIS) Page 14 Solid Balance Sheet Page 15 2011 Guidance Page 16 2012 Guidance Page 17 Investor Relations | 2011 | 2/18
  • 3.
    2011 Events andHighlights Market Recognition. Two-notch upgrade on global scale by S&P to BB+. Four-notch upgrade on national scale by S&P to brAA. Capital increase: German bank DEG buys a 2.9% stake in PINE’s capital. US$ 25-million, 10-year funding transaction with Proparco in December 2011. First financial institution controlled by Brazilian shareholders to raise funding in Islamic format, in the amount of US$ 37.5 million from Saudi Arabia-based Al Rajhi Bank, booked in 1Q12. Syndicated A/B Loan, globally coordinated by IIC, in January, 2011, amounting to US$106 million. High credit coverage, liquidity and capital ratios, as well as a positive liquidity gap. Ranked 2nd largest commodities NDF provider for clients and 13th largest derivatives provider in Cetip’s ranking. 13th largest credit provider to companies and 12th largest credit provider to large companies based on Exame magazine’s “Maiores e Melhores” guide. “Most green bank” in Latin America and Caribbean according to International Finance Corporation (IFC). Investor Relations | 2011 | 3/18
  • 4.
    2011 Key Figures Improvement in KPIs in the period… Expanded Corporate Credit Portfolio* (*) Includes private securities 5,747 6,921 (R$ Million) 20.4% Dec-10 Dec-11 5,589 Total Funding 6,600 (R$ Million) 18.1% 2010 2011 Corporate Credit Coverage 2.5% 3.6% 110 bps Dec-10 Dec-11 Shareholders' Equity 17.1% 867.1 1,015.1 (R$ Million) Dec-10 Dec-11 320 bps 14.0% 17.2% ROAE 2010 2011 118.3 161.5 Net Income (R$ Million) 36.6% 2010 2011 Investor Relations | 2011 | 4/18
  • 5.
    Extraordinary Revenues ...withextraordinary revenues directed to the strengthening of the balance sheet... Successful outcome in lawsuit questioning the Cofins tax calculation base. PINE used the bulk of these funds to create extraordinary and additional provisions in various lines of its balance sheet, making it even more solid. Future Impacts: Cofins tax calculation base is now smaller, yielding quarterly gross savings of around R$ 3.0 million. Positive effect on the net working capital (current assets – current liabilities) Investor Relations | 2011 | 5/18
  • 6.
    Product and RevenueDiversification ...with contributions from all business lines, as a result of the strategy of complete service to clients. Clients with more than one Product Penetration Ratio – Clients with more than one Product More than 1 product 1 product 35% 47% 59% 65% 53% 41% 2.4 2.9 3.0 Dec-09 Dec-10 Dec-11 Dec-09 Dec-10 Dec-11 Corporate Revenues Breakdown Corporate Credit 67.0% PINE Investimentos 2.9% Treasury 7.3% Hedging Desk 22.9% 2010 Corporate Credit 63.7% PINE Investimentos 3.0% Treasury 8.6% Hedging Desk 24.7% 2011 Investor Relations | 2011 | 6/18
  • 7.
    Credit Portfolio Corporatecredit portfolio expanded 20.4% in 12 months Credit portfolio continues to expand... 2,703 2,821 2,792 3,251 3,358 3,132 3,126 3,300 3,286 - - - - - 71 122 251 297 176 242 455 629 833 871 902 872 873 511 634 842 827 1,022 1,117 1,372 1,534 1,687 728 764 705 558 534 601 751 746 777 Corporate Credit Breakdown (R$ Million) Trade finance Bank Guarantees Onlendings Private Securities* 4,118 4,462 4,794 5,265 5,747 5,792 6,273 6,703 6,920 Dec-09 Mar-10 Jun-10 Sep-10 Dec-10 Mar-11 Jun-11 Sep-11 Dec-11 (*) Includes debentures, CRIs and hedge fund shares Corporate loan portfolio increases its share of the total credit portfolio to 98.9% Working Capital Total Credit Portfolio ** 4,731 (R$ Million) 4,960 5,188 5,601 6,016 6,022 6,464 6,829 Dec-09 Mar-10 Jun-10 Sep-10 Dec-10 Mar-11 Jun-11 Sep-11 Dec-11 (**) Includes credit to companies, Debentures, remaining retail portfolio and acquired portfolio from financial istitutions 7,021 Investor Relations | 2011 | 7/18
  • 8.
    Credit Portfolio Profile ... growing in a diversified manner, both in sectors and products... Credit Portfolio by Industry Geographic Distribution Electric and Renewable Energy 8% Construction 9% Agriculture 7% Foreign Trade 6% Transportation and Logistics 6% Meatpacking 4% Food Industry 3% Telecom 3% MidWest 10% Northeast 5% South 6% North 1% Infrastructure Sugar and Ethanol 19% 10% Specialized Services 3% Metal and Mining 3% Vehicles and Parts 3% Beverages and Tobacco 2% Financial Institutions 2% Chemicals 2% Other 10% Southeast 78% Investor Relations | 2011 | 8/18
  • 9.
    Credit Portfolio Quality ... with quality, collateral and increased credit coverage. Credit Portfolio Quality – December 2011 Non Performing Loans 60 days AA-A 59.0% B 28.6% C 8.5% D-E 1.4% F-H 2.5% 0.7% 0.7% 0.5% 1.1% 1.0% 0.1% 0.4% 0.2% 0.5% 0.4% Contracts Overdue Installments Overdue Dec-10 Mar-11 Jun-11 Sep-11 Dec-11 Total Credit Coverage Collaterals 2.5% 110 bps 2.9% 3.6% 70 bps Dec-10 Sep-11 Dec-11 Products Pledge 46% Receivables 31% Guarantees 2% Investments 3% Property Pledge 18% Investor Relations | 2011 | 9/18
  • 10.
    Hedging Desk PINEis the 2nd largest provider of commodities NDFs for clients*. Client Notional Derivatives Portfolio by Market Client Notional Derivatives Portfolio by Industry December 31st, 2011 Fixed Income 31% Commodities 8% Currencies 61% Foreign Trade 12% Sugar and Ethanol 19% Transportation and Logistics 10% Beverages and Tobacco 9% Metal and Mining 8% Textile and Apparel 5% Electric and Renewable Energy 5% Construction 2% Meatpacking 2% Infrastructure 1% Other 6% Notional: R$3.7 billion Agriculture 21% Market Segments Portfolio Profile Scenario on December, 31st : Duration: 273 days Mark-To-Market : R$157 million Stress Scenario (Dollar: +20% and Commodities Prices: -30%): Stressed MTM: R$333 million Fixed Income: Fixed, Floating, Inflation, Libor Currencies: Dollar, Euro, Yen, Pound, Canadian Dollar, Australian Dollar, Spot Commodities: Sugar, Soybean (Grain, Meal and Oil), Corn, Cotton, Metals, Energy *Source: Cetip Report of December. Investor Relations | 2011 | 10/18
  • 11.
    PINE Investimentos Creatingvalue to clients and optimizing the Bank's use of capital Market Segments Revenues (R$ Million) Capital Markets: Structuring, securities placements, structured operations Advisory Investment Management: Fixed Income, Credit Hedge Funds, Exclusive Mandates, Portfolio Management 12,771 14,927 16.9% 2010 2011 Selected Transactions in 2011 Debentures and Subscription Bonus R$25,000,000.00 Coordinator June Debentures and ICVM 476 Issuer R$242,400,000.00 Leader Coordinator June US$ 75,000,000 11.50% Senior Secured Notes due 2016 US$300,000,000.00 Global Medium Term Note Program Co-Manager May Debentures Issuer R$80,000,000.00 Leader Coordinator June Debentures and ICVM 476 Issuer R$ 30,000,000.00 December Investor Relations | 2011 | 11/18
  • 12.
    Funding Funding isgrowing with quality and diversity... 91 85 1,196 1,463 1,530 1,114 1,287 1,253 175 198 214 218 212 228 250 39 50 36 46 42 41 53 66 112 206 248 201 224 320 272 210 165 106 - - - - 21 33 247 256 281 176 242 453 626 829 867 898 867 867 419 330 249 192 152 125 92 71 56 525 448 405 413 377 435 596 814 753 230 239 227 200 160 282 267 310 353 77 87 151 166 158 172 102 86 250 75 276 203 194 194 201 220 237 246 Funding Mix (R$ Million) International Capital Market Private Placements / Others Multilateral Lines Trade Finance Loan Assignments BNDES Local Capital Markets Interbank deposits 5,375 5,589 4,871 4,531 4,634 5,480 6,027 6,319 6,600 1,123 1,064 1,124 1,570 1,566 1,646 1,654 1,592 1,720 1,845 1,965 2,130 Dec-09 Mar-10 Jun-10 Sep-10 Dec-10 Mar-11 Jun-11 Sep-11 Dec-11 Islamic Funding (December, 2011) US$37.5 Million 1 year tenor Multilateral Loan (December, 2011) US$25.0 Million 10 years tenor Demand deposits Individuals Corporate Clients Institutional Investor Relations | 2011 | 12/18
  • 13.
    Asset Liability Management ... posting a 4-month positive gap between credit and funding maturities... Matching of Transactions CREDIT FUNDING BNDES BNDES Trade Finance Trade Finance Deposits Working Capital, Private Securities* And Cash Letras Financeiras Offshore Funding 89% 88% 82% 80% 76% Credit to Total Funding Ratio ALM Dec-10 Mar-11 Jun-11 Sep-11 Dec-11 Average Maturity Credit: 14 months Funding: 18 months * Includes debentures, CRIs, eurobonds and hedge fund shares R$ million - 3,193 1,510 1,521 383 Credit Funding 119 112 1,943 1,790 1,547 764 388 No maturity Up to 3 months (includes Cash) From 3 to 12 months From 1 to 3 years From 3 to 5 years More than 5 years Investor Relations | 2011 | 13/18
  • 14.
    Capital Adequacy Ratio(BIS) 15.1% 14.4% 14.6% 14.8% 13.8% 13.4% 13.2% 15.1% 14.3% 0.5% 0.5% 3.9% 3.6% 3.6% 3.7% 3.4% 4.5% 4.2% BIS Tier II Tier I 15.6% 14.9% 18.5% 18.4% 17.4% 17.1% 16.6% 11% Minimum Regulatoty Capital 19.6% 18.5% ...with the BIS ratio ending the period at 18.5% Dec-09 Mar-10 Jun-10 Sep-10 Dec-10 Mar-11 Jun-11 Sep-11 Dec-11 R$ thousand BIS Ratio Tier I 1,016,629 14(.%3%) Tier II 297,045 4.2% Total 1,313,674 18.5% Investor Relations | 2011 | 14/18
  • 15.
    Balance Sheet Strength In summary, PINE has buffers of liquidity, capital and credit portfolio coverage to escalate its business and balance sheet consistently Positive Credit Coverage Ratio Liquidity Gap 18 18 19 18 18 15 16 15 15 14 Funding Average Maturity (months) Credit Average Maturity (months) 2.5% 2.7% 2.7% 2.9% 3.6% Dec-10 Mar-11 Jun-11 Sep-11 Dec-11 Dec-10 Mar-11 Jun-11 Sep-11 Dec-11 Capital Cash / Time Deposits Regulatoty Capital 11% Minimum Regulatoty Capital 17.4% 17.1% 16.6% 19.6% 18.5% Dec-10 Mar-11 Jun-11 Sep-11 Dec-11 43% 42% 42% 41% 41% Dec-10 Mar-11 Jun-11 Sep-11 Dec-11 Investor Relations | 2011 | 15/18
  • 16.
    Guidance 2011 GuidanceActual PINE achieved its key guidance targets for 2011... Corporate Credit Portfolio 20% - 25% 20.4% Personnel and Administrative Expenses 5% - 10% 22.6% NIM 5.5% - 7.5% 6.4% Corporate ROAE 17% - 20% 17.5% Investor Relations | 2011 | 16/18
  • 17.
    Guidance 2012 PINEis ready to capture 2012's opportunities, maintaining the focus on an adequate risk return balance. Guidance Corporate Credit Portfolio 17% - 22% Personnel and Administrative Expenses 8% - 12% NIM 5.5% - 7.5% Corporate ROAE 17% - 20% Investor Relations | 2011 | 17/18
  • 18.
    Investor Relations NorbertoZaiet Junior CFO Nira Bessler Head of Investor Relations Alejandra Hidalgo Investor Relations Manager Alexandre Cavalcanti Investor Relations Manager Phone: +55-11-3372-5553 www.bancopine.com.br/ir ir@bancopine.com.br This presentation contains forward-looking statements relating to the prospects of the business, estimates for operating and financial results, and those related to growth prospects of PINE. These are merely projections and, as such, are based exclusively on the expectations of PINE’s management concerning the future of the business and its continued access to capital to fund the Company’s business plan. Such forward-looking statements depend, substantially, on changes in market conditions, government regulations, competitive pressures, the performance of the Brazilian economy and the industry, among other factors and risks disclosed in PINE’s filed disclosure documents and are, therefore, subject to change without prior notice. Investor Relations | 2011 | 18/18