The document provides an overview of Pine's business for 4Q15, including:
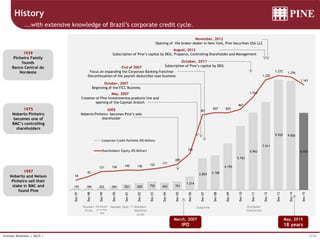
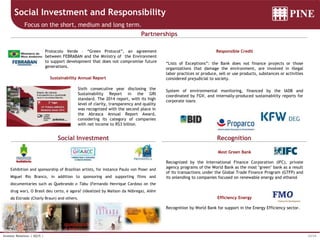
- A history of Pine since 1997 and profile of its focus on corporate clients.
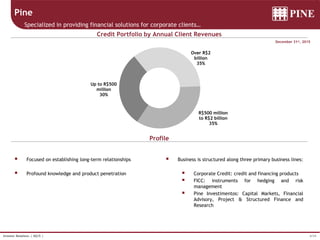
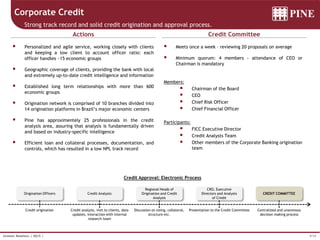
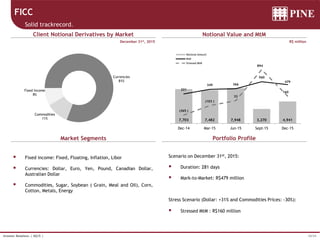
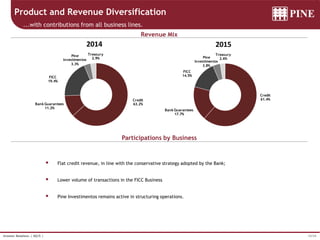
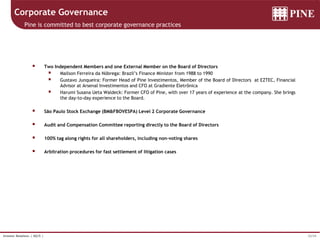
- An overview of its three primary business lines: corporate credit, FICC (financial instruments), and Pine Investimentos (capital markets).
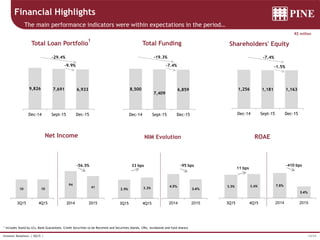
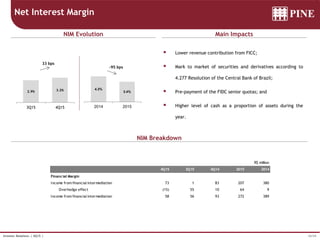
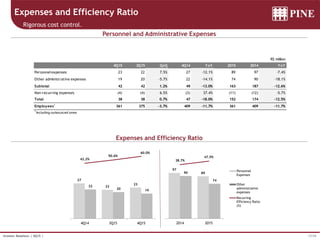
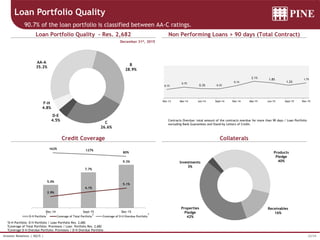
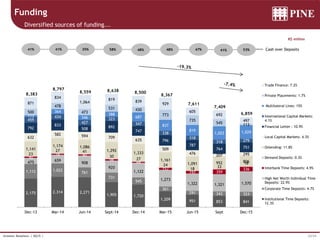
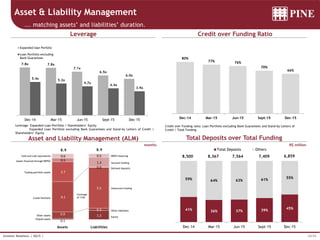
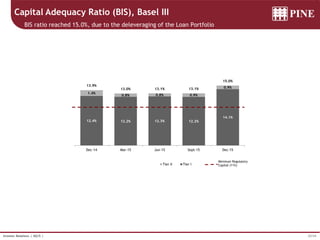
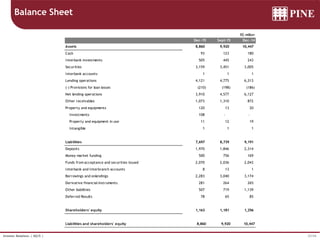
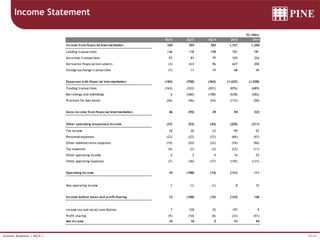
- Highlights of its financial results for 4Q15, including a 7.4% decrease in total funding and a 1.5% decrease in shareholders' equity from the prior quarter. Revenue contributions came from all business lines, and expenses declined 12.6% year-over-year through cost controls.