The document provides an overview of Pine bank including:
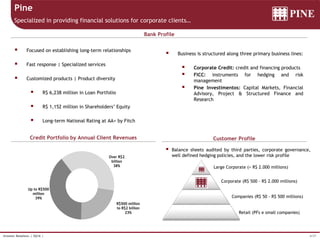
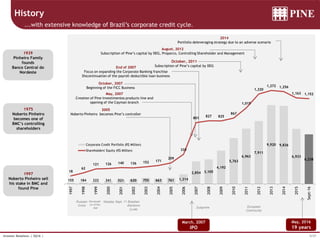
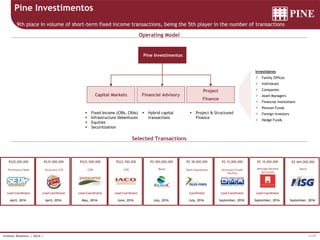
- Its history and focus on corporate clients since 1997
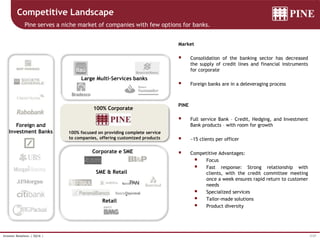
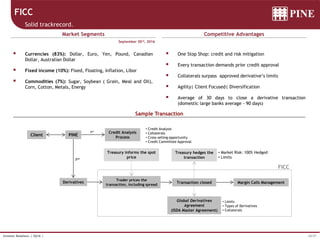
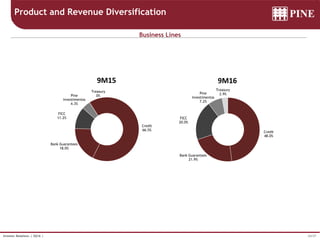
- Business lines in corporate credit, FICC (hedging instruments), and investment banking
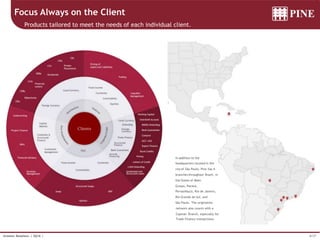
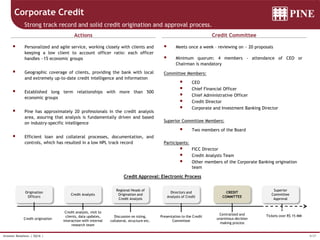
- Strong credit approval process and long-term client relationships
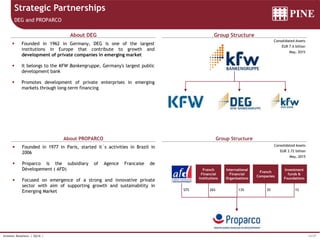
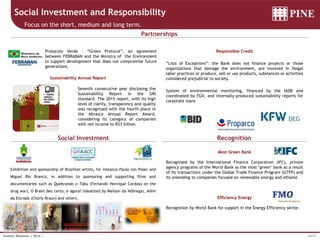
- Strategic partnerships with DEG and PROPARCO which provide long-term financing
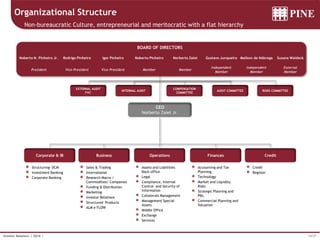
- Corporate governance structure with an entrepreneurial culture