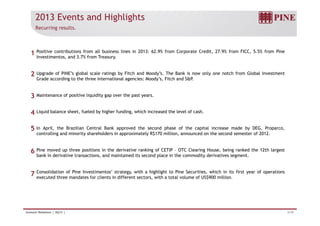
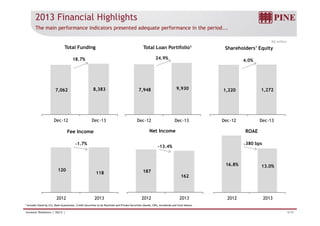
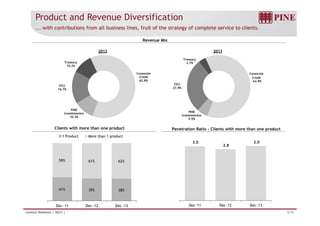
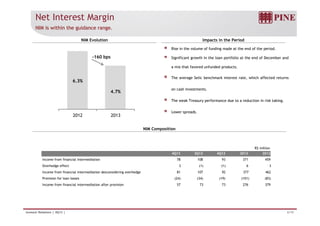
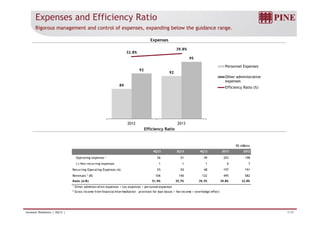
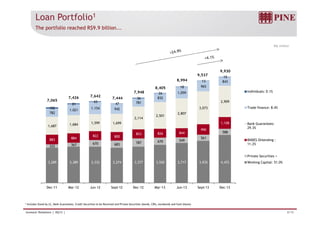
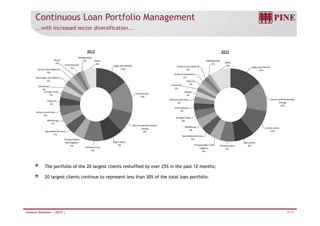
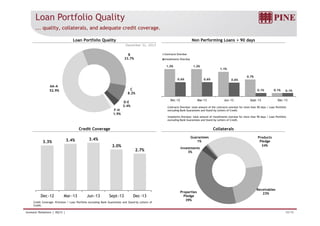
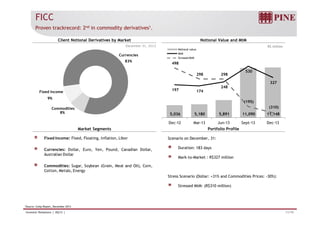
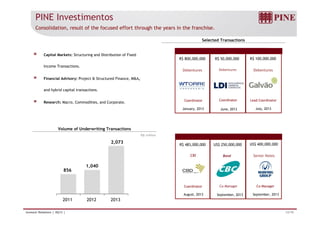
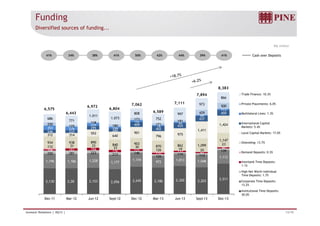
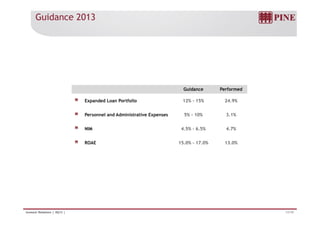
2013 Earnings Release Conference Call 
February 18, 2014
Agenda 
2013 Events and Highlights 3 
2013 Financial Highlights 4 
Product and Revenue Diversification 5 
Net Interest Margin 6 
Expenses and Efficiency Ratio 7 
Loan Portfolio 8 
Continuous Loan Portfolio Management 9 
Loan Portfolio Quality 10 
FICC 11 
PINE Investimentos 12 
Funding 13 
Asset & Liability Management 14 
Capital Adequacy Ratio (BIS), Basel III 15 
PINE4 16 
Guidance 2013 17 
G id 2014 
Guidance 18 
Investor Relations | 4Q13 | 2/19
2013 Events and Highlights 
Recurring results. 
Positive contributions from all business lines in 2013: 62.9% from Corporate Credit, 27.9% from FICC, 5.5% from Pine 
Investimentos, and 3.7% from Treasury. 1 
Upgrade of PINE’s global scale ratings by Fitch and Moody’s. The Bank is now only one notch from Global Investment 
Grade according to the three international agencies: Moody’s, Fitch and S&P. 
2 
Maintenance of positive liquidity gap over the past years. 
Liquid balance sheet, fueled by higher funding, which increased the level of cash. 
3 
4 
In April, the Brazilian Central Bank approved the second phase of the capital increase made by DEG, Proparco, 
controlling and minority shareholders in approximately R$170 million, announced on the second semester of 2012. 
5 
Pine moved up three positions in the derivative ranking of CETIP – OTC Clearing House, being ranked the 12th largest 
bank in derivative transactions, and maintained its second place in the commodity derivatives segment. 
6 
Consolidation of Pine Investimentos’ strategy, with a highlight to Pine Securities, which in its first year of operations 
executed three mandates for clients in different sectors, with a total volume of US$900 million. 7 
Investor Relations | 4Q13 | 3/19
2013 Financial Highlights 
The main performance indicators presented adequate performance in the period... 
R$ million 
Total Funding 
18.7% 
Total Loan Portifolio1 
24.9% 
Shareholders’ Equity 
4.0% 
7,062 8,383 7,948 9 9,930 930 
1,220 1,272 
Dec-12 Dec-13 Dec-12 Dec-13 Dec-12 Dec-13 
Fee Income Net Income ROAE 
-1.7% -13.4% 
16 8% 
-380 bps 
120 
118 187 
162 
16.8% 13.0% 
2012 2013 2012 2013 2012 2013 
1 Includes Stand by LCs, Bank Guarantees, Credit Securities to be Received and Private Securities (bonds, CRIs, eurobonds and fund shares) 
Investor Relations | 4Q13 | 4/19
Product and Revenue Diversification 
... with contributions from all business lines, fruit of the strategy of complete service to clients. 
Revenue Mix 
T 
2012 
Treasury 
2013 
Corporate 
Credit 
62.8% 
Treasury 
10.2% 
FICC 
Corporate 
Credit 
62.9% 
FICC 
27 9% 
3.7% 
PINE 
16.7% 
Investimentos 
PINE 
27.9% 
10.3% Investimentos 
5.5% 
Clients with more than one product Penetration Ratio – Clients with more than one product 
1 Product More than 1 product 
3.0 
2.8 
3.0 
59% 61% 62% 
41% 39% 38% 
Dec-11 Dec-12 Dec-13 
Dec -11 Dec -12 Dec -13 
Investor Relations | 4Q13 | 5/19
Net Interest Margin 
NIM is within the guidance range. 
NIM Evolution Impacts in the Period 
Rise in the volume of funding made at the end of the period. 
Significant growth in the loan portfolio at the end of December and 
-160 bps 
a mix that favored unfunded products. 
The average Selic benchmark interest rate, which affected returns 
6.3% 
on cash investments. 
The weak Treasury performance due to a reduction in risk taking. 
Lower spreads. 
4.7% 
NIM Composition 
2012 2013 
R$ million 
4Q13 3Q13 4Q12 2013 2012 
Income from financial intermediation 78 108 93 371 459 
Overhedge effect 3 (1) (1) 6 3 
Income from financial intermediation desconsidering overhedge 81 107 92 377 462 
Provision for loan losses (24) (34) (19) (101) (83) 
Income from financial intermediation after provision 57 73 73 276 379 
Investor Relations | 4Q13 | 6/19
Expenses and Efficiency Ratio 
Rigorous management and control of expenses, expanding below the guidance range. 
Expenses 
95 
32.8% 
39.8% 
60,0% 
40,0% 
100 
98 
96 
94 Personnel Expenses 
89 
92 
92 
20,0% 
0,0% 
- 20,0% 
92 
90 
Other administrative 
expenses 
Efficiency Ratio (%) 
- 40,0% 
- 60,0% 
- 80,0% 
88 
86 
84 
82 - 100,0% 
2012 2013 
Efficiency Ratio 
R$ millions 
4Q13 3Q13 4Q12 2013 2012 
Operating expenses 1 56 51 49 203 198 
(-) Non-recurring expenses 1 1 1 6 7 
Recurring Operating Expenses (A) 55 50 48 197 191 
Revenues 2 (B) 106 140 122 495 582 
Ratio (A/B) 51.9% 35.7% 39.3% 39.8% 32.8% 
1 Other administrative expenses + tax expenses + personnel expenses 
2 Gross Income from financial intermediation - provision for loan losses + fee income + overhedge effect 
Investor Relations | 4Q13 | 7/19
Loan Portfolio1 
The portfolio reached R$9.9 billion... 
R$ million 
965 
843 
18 
13 
10 
8 405 
8,994 
9,537 
9,930 
2 807 
3,073 
2,909 
782 
1.021 1.154 942 
781 
832 
1,059 
102 
81 
65 47 
36 
26 
7,065 
7,426 7,642 7,444 
7,948 
8,405 
Individuals: 0.1% 
Trade finance: 8.4% 
561 
588 
883 884 
822 800 
853 826 844 
990 
1,108 
1,687 1,684 1,599 1,699 
2,114 
2,501 
2,807 
Bank Guarantees: 
29.3% 
BNDES O l di 
322 367 670 683 787 670 549 
3,289 3,389 3,332 3,274 3,377 3,550 3,717 3,935 4,472 
Onlending : 
11.2% 
Private Securities + 
Working Capital: 51.0% 
Dec-11 Mar-12 Jun-12 Sept-12 Dec-12 Mar-13 Jun-13 Sept-13 Dec-13 
1 Includes Stand by LC, Bank Guarantees, Credit Securities to be Received and Private Securities (bonds, CRIs, eurobonds and fund shares) 
Investor Relations | 4Q13 | 8/19
Continuous Loan Portfolio Management 
...with increased sector diversification... 
Retail 
2013 
Meatpacking 
2% Other 
Meatpacking 
2012 
h 
Sugar and Ethanol 
14% 
Construction Material 
2% 
Beverages and Tobacco 
2% 
Chemicals 
2% 
Food Industry 
2% 
6% 
Sugar and Ethanol 
15% 
Construction Material 
Financial Institutions 
Chemicals 
Telecom 
2% 
2% 
2% 
p g 
2% Other 
9% 
Construction 
14% 
3% 
Foreign Trade 
3% 
Telecom 
4% 
Vehicles Parts 
Electric and Renewable 
Energy 
13% 
Vehicles and Parts 
3% 
Food Industry 
3% 
Metals 
2% 
2% 
Electric and Renewable 
Energy 
Metallurgy 
5% 
Specialized Services 9% 
5% 
and 4% 
Construction 
12% 
Metallurgy 
4% 
Specialized Services 
4% 
Foreign Trade 
4% 
Agriculture 
9% 
Infrastructure 
9% 
Transportation 
and Logistics 
5% 
Agriculture 
Infrastructure 9% 
7% 
Transportation and 
Logistics 
5% 
The portfolio of the 20 largest clients reshuffled by over 25% in the past 12 months; 
20 largest clients continue to represent less than 30% of the total loan portfolio. 
Investor Relations | 4Q13 | 9/19
Loan Portfolio Quality 
... quality, collaterals, and adequate credit coverage. 
Loan Portfolio Quality Non Performing Loans > 90 days 
December 31, 2013 
B 
33.7% 
2,0% 
Contracts Overdue 
Installments Overdue 
AA-1.2% 1.2% 
1.1% 
0.7% 
0.6% 0.6% 0.6% 
1,5% 
1,0% 
0,5% 
Contracts Overdue: total amount of the contracts overdue for more than 90 days / Loan Portfolio 
excluding Bank Guarantees and Stand-by Letters of Credit. 
AA A 
52.9% C 
8.2% 
D-E 
3.4% 
F-H 
1 9% 
0.1% 0.1% 0.1% 
0,0% 
Dec-12 Mar-13 Jun -13 Sept -13 Dec-13 
Installents Overdue: total amount of installments overdue for more than 90 days / Loan Portfolio 
excluding Bank Guarantees and Stand-by Letters of Credit. 
1.9% 
Credit Coverage Collaterals 
3 4% 3 4% Products Guarantees 
3.3% 3.4% 3.4% 
3.0% 
2.7% 
Pledge 
34% 
Investments 
3% 
1% 
Receivables 
Dec-12 Mar-13 Jun-13 Sept-13 Dec-13 
Credit Coverage: Provision / Loan Portfolio excluding Bank Guarantees and Stand-by Letters of 
Credit. 
Properties 23% 
Pledge 
39% 
Investor Relations | 4Q13 | 10/19
FICC 
Proven trackrecord: 2nd in commodity derivatives1. 
Client Notional Derivatives by Market Notional Value and MtM 
December 31, 2013 R$ million 
Notional value 
MtM 
Stressed MtM 
Currencies 
83% 
- 
248 
530 
327 
498 
298 298 
197 174 
(195) 
Fixed Income 
Commodities (310) 
5 036 5 180 5 891 11 090 11 148 
8% 
9% 
5,036 5,180 5,891 11,090 11,148 
Dec-12 Mar-13 Jun-13 Sept-13 Dec-13 
Market Segments Portfolio Profile 
Fixed Income: Fixed Floating Inflation Libor 
Scenario December, on December 31: 
Duration: 183 days 
Mark-to-Market : R$327 million 
Fixed, Floating, Inflation, Currencies: Dollar, Euro, Yen, Pound, Canadian Dollar, 
Australian Dollar 
C dii S S b (G i M l d Oil) C 
Stress Scenario (Dollar: +31% and Commodities Prices: -30%): 
Stressed MtM: (R$310 million) 
Commodities: Sugar, Soybean Grain, Meal and Oil), Corn, 
Cotton, Metals, Energy 
1Source: Cetip Report, December 2013 
Investor Relations | 4Q13 | 11/19
PINE Investimentos 
Consolidation, result of the focused effort through the years in the franchise. 
Capital Markets: Structuring and Distribution of Fixed 
Selected Transactions 
R$ 800,000,000 
R$ 50,000,000 R$ 100,000,000 
Income Transactions. 
Financial Advisory: Project & Structured Finance, M&A, 
Debentures Debentures Debentures 
and hybrid capital transactions. 
Research: Macro, Commodities, and Corporate. 
Coordinator 
January, 2013 
Coordinator 
June, 2013 
Lead Coordinator 
July, 2013 
Volume of Underwriting Transactions 
R$ million 
R$ 483,000,000 US$ 400,000,000 
Senior Notes 
CRI 
US$ 250,000,000 
Bond 
1 040 
2,073 
Coordinator Co-Manager Co-Manager 
856 
1,040 
August, 2013 September, 2013 September, 2013 
2011 2012 2013 
Investor Relations | 4Q13 | 12/19
Funding 
Diversified sources of funding... 
R$ million 
41% 34% 38% 41% 50% 42% 44% 39% 41% Cash over Deposits 
8 383 
113 
6,443 , 429 
459 
1.3% 
500 
808 
997 
973 
866 
6,575 
6 443 
6,972 6,804 
7,062 
6,589 
7,111 
7,894 
8,383 
Trade Finance: 10.3% 
Private Placements: 6.0% 
Multilateral Lines: 1 3% 
312 314 593 
640 
901 
796 975 
1,411 
1,424 
246 233 
295 
260 
409 
402 
435 
437 
353 276 
234 
156 
152 
78 
80 
69 
250 125 
118 
180 
173 
171 
181 
686 
771 
1.011 
1.073 
752 
International Capital 
Markets: 5.4% 
Local Capital Markets: 17.0% 
934 938 890 23 
112 90 31 33 
106 161 194 176 121 139 
1,196 1,186 1,228 1,177 
110 110 93 
1,174 972 1,013 1,048 
1,112 
250 281 223 213 146 
126 
119 113 
33 30 
126 19 20 
840 903 
870 862 1,099 
1,147 
Onlending: 13.7% 
Demand Deposits: 0.3% 
Interbank Time Deposits: 
2,130 2,28 2,153 2,056 2,245 2,186 2,320 2,203 2,511 
1.1% 
High Net Worth Individual 
Time Deposits: 1.7% 
Corporate Time Deposits: 
13.2% 
I tit ti l Ti D it 
Dec-11 Mar-12 Jun-12 Sept-12 Dec-12 Mar-13 Jun-13 Sept-13 Dec-13 
Institutional Time Deposits: 
30.0% 
Investor Relations | 4Q13 | 13/19
Asset & Liability Management 
... keeping a positive gap between credit and funding. 
Leverage Credit over Funding Ratio 
7.5x 7.8x 
7 1x 87% 85% 
83% 
10,0 Expanded Loan Portfolio 
9,0 
8,0 
Loan Portfolio excluding Bank Guarantees 
82% 
7.1x 
6.5x 6.7x 81% 4.8x 4.7x 4.9x 5.1x 5.5x 
7,0 
6,0 
5,0 
4,0 
Dec-12 Mar-13 Jun-13 Sept-13 Dec-13 
3,0 
2,0 
1,0 
‐ 
Dec-12 Mar-13 Jun-13 Sept -13 Dec-13 
Credit over Funding ratio: Loan Portfolio excluding Bank Guarantees and Stand-by Letters of 
Credit / Total Funding 
R$ million 
Leverage: Expanded Loan Portfolio / Shareholders’ Equity 
Expanded Loan Portfolio excluding Bank Guarantees and Stand-by Letters of Credit / 
Shareholders’ Equity 
ALM – Average Maturity Total Deposits over Total Funding 
months Total Deposits Others 
17 17 
15 
18 
17 
16 
15 
7,062 6,589 7,111 7,894 8,383 
47% 47% 50% 56% 54% 
13 
14 14 
Funding 
Credit 53% 53% 50% 44% 46% 
Dec-12 Mar-13 Jun-13 Sept-13 Dec-13 
Investor Relations | 4Q13 | 14/19
Capital Adequacy Ratio (BIS), Basel III 
BIS ratio reached 14.1%. 
Tier II Tier I 
Minimum Regulatory 
4.2% 
3 0% 2 1% 2 3% 
18.5% 
16.4% 15.9% 
17.0% 
16.2% 
17.1% 17.0% 
Capital (11%) 
15.9% 
3.1% 3.3% 
3.0% 
2.8% 
2.1% 2.3% 
2.2% 
14.1% 
2.1% 
14.3% 13.3% 12.6% 14.0% 13.4% 15.0% 14.7% 13.7% 12.0% 
Dec-11 Mar-12 Jun-12 Sept-12 Dec-12 Mar-13 Jun-13 Sept-13 Dec-13 
R$ million BIS Ratio (%) 
Tier I 1,220 12.0 
Tier II 222 2.1 
Reference Equity 1,442 14.1% 
Investor Relations | 4Q13 | 15/19
PINE4 
Increased ADTV and yields above average. 
92 81 87 105 86 84 
111 
195 182 
220 
137 
246 
168 154 
Volume (R$ million) and Number of Trades (quantity) – Daily Average 
1,324 1,367 
2,027 
1.251 
26 44 44 30 41 49 53 52 38 30 
Number of Trades 
Volume 
Hiring of Market Maker 
(R$) 
161 
871 
435 
267 
1,004 
607 
407 
947 
309 
564 
716 
634 
762 
935 1,000 1,023 
932 
1,093 
584 
426 
jan/12 fev/12 mar/12 abr/12 mai/12 jun/12 jul/12 aug/12 sept/12 out/12 nov/12 dec/12 jan/13 fev/13 mar/13 abr/13 mai/13 jun/13 jul/13 aug/13 sept/13 out/13 nov/13 dec/13 
Multiples Dividend Yield 
10 9% 10 6% 
PINE4 | As of December 31th 
Price (R$) 10,53 
P/BV 0 8 
7.8% 
8.5% 
10.9% 10.6% 
0.8x 
P/E(1) 5.8x 
1Q13 2Q13 3Q13 4Q13 
Dividend Yield: Average daily closing prices of the stocks in 3Q13 / Dividends and Interest on Own 
Capital of the last twelve months 
(1) Considers the market consensus for the 2013 net income; source: Bloomberg 
Investor Relations | 4Q13 | 16/19
Guidance 2013 
Guidance Performed 
Expanded Loan Portfolio 12% - 15% 24.9% 
Personnel and Administrative Expenses 5% - 10% 3.1% 
NIM 4.5% - 6.5% 4.7% 
ROAE 15.0% - 17.0% 13.0% 
Investor Relations | 4Q13 | 17/19
Guidance 2014 
Assumption: 1.6% GDP growth. 
Guidance 
Expanded Loan Portfolio 8.0% – 12.0% 
Personnel and Administrative Expenses 4.0% - 6.0% 
NIM 4.0% - 5.0% 
ROAE 13.0% - 15.0% 
Investor Relations | 4Q13 | 18/19
Investor Relations 
Noberto N. Pinheiro Junior 
CEO 
Susana Waldeck Norberto Zaiet Junior 
CFO/IRO COO 
Raquel Varela 
Head of Investor Relations 
Alejandra Hidalgo 
Investor Relations Manager 
Luiz Máximo 
Investor Relations Analyst 
Ana Lopes 
Investor Relations Analyst 
Fone: +55 (11) 3372-5343 
www.pine.com/ir 
ir@pine.com 
This report may contain forward-looking statements concerning the business prospects, projections of operating and financial results and growth outlook of PINE. These are merely 
projections and as such are based solely on management’s expectations regarding the future of the business. These statements depend substantially on market conditions, the 
performance of the sector and the Brazilian economy (political and economic changes, volatility in interest and exchange rates, technological changes, inflation, financial 
disintermediation, competitive pressures on products and prices and changes in tax legislation) and therefore are subject to change without prior notice. 
. 
Investor Relations | 4Q13 | 19/19

2013 Earnings Conference Call

  • 1.
    2013 Earnings ReleaseConference Call February 18, 2014
  • 2.
    Agenda 2013 Eventsand Highlights 3 2013 Financial Highlights 4 Product and Revenue Diversification 5 Net Interest Margin 6 Expenses and Efficiency Ratio 7 Loan Portfolio 8 Continuous Loan Portfolio Management 9 Loan Portfolio Quality 10 FICC 11 PINE Investimentos 12 Funding 13 Asset & Liability Management 14 Capital Adequacy Ratio (BIS), Basel III 15 PINE4 16 Guidance 2013 17 G id 2014 Guidance 18 Investor Relations | 4Q13 | 2/19
  • 3.
    2013 Events andHighlights Recurring results. Positive contributions from all business lines in 2013: 62.9% from Corporate Credit, 27.9% from FICC, 5.5% from Pine Investimentos, and 3.7% from Treasury. 1 Upgrade of PINE’s global scale ratings by Fitch and Moody’s. The Bank is now only one notch from Global Investment Grade according to the three international agencies: Moody’s, Fitch and S&P. 2 Maintenance of positive liquidity gap over the past years. Liquid balance sheet, fueled by higher funding, which increased the level of cash. 3 4 In April, the Brazilian Central Bank approved the second phase of the capital increase made by DEG, Proparco, controlling and minority shareholders in approximately R$170 million, announced on the second semester of 2012. 5 Pine moved up three positions in the derivative ranking of CETIP – OTC Clearing House, being ranked the 12th largest bank in derivative transactions, and maintained its second place in the commodity derivatives segment. 6 Consolidation of Pine Investimentos’ strategy, with a highlight to Pine Securities, which in its first year of operations executed three mandates for clients in different sectors, with a total volume of US$900 million. 7 Investor Relations | 4Q13 | 3/19
  • 4.
    2013 Financial Highlights The main performance indicators presented adequate performance in the period... R$ million Total Funding 18.7% Total Loan Portifolio1 24.9% Shareholders’ Equity 4.0% 7,062 8,383 7,948 9 9,930 930 1,220 1,272 Dec-12 Dec-13 Dec-12 Dec-13 Dec-12 Dec-13 Fee Income Net Income ROAE -1.7% -13.4% 16 8% -380 bps 120 118 187 162 16.8% 13.0% 2012 2013 2012 2013 2012 2013 1 Includes Stand by LCs, Bank Guarantees, Credit Securities to be Received and Private Securities (bonds, CRIs, eurobonds and fund shares) Investor Relations | 4Q13 | 4/19
  • 5.
    Product and RevenueDiversification ... with contributions from all business lines, fruit of the strategy of complete service to clients. Revenue Mix T 2012 Treasury 2013 Corporate Credit 62.8% Treasury 10.2% FICC Corporate Credit 62.9% FICC 27 9% 3.7% PINE 16.7% Investimentos PINE 27.9% 10.3% Investimentos 5.5% Clients with more than one product Penetration Ratio – Clients with more than one product 1 Product More than 1 product 3.0 2.8 3.0 59% 61% 62% 41% 39% 38% Dec-11 Dec-12 Dec-13 Dec -11 Dec -12 Dec -13 Investor Relations | 4Q13 | 5/19
  • 6.
    Net Interest Margin NIM is within the guidance range. NIM Evolution Impacts in the Period Rise in the volume of funding made at the end of the period. Significant growth in the loan portfolio at the end of December and -160 bps a mix that favored unfunded products. The average Selic benchmark interest rate, which affected returns 6.3% on cash investments. The weak Treasury performance due to a reduction in risk taking. Lower spreads. 4.7% NIM Composition 2012 2013 R$ million 4Q13 3Q13 4Q12 2013 2012 Income from financial intermediation 78 108 93 371 459 Overhedge effect 3 (1) (1) 6 3 Income from financial intermediation desconsidering overhedge 81 107 92 377 462 Provision for loan losses (24) (34) (19) (101) (83) Income from financial intermediation after provision 57 73 73 276 379 Investor Relations | 4Q13 | 6/19
  • 7.
    Expenses and EfficiencyRatio Rigorous management and control of expenses, expanding below the guidance range. Expenses 95 32.8% 39.8% 60,0% 40,0% 100 98 96 94 Personnel Expenses 89 92 92 20,0% 0,0% - 20,0% 92 90 Other administrative expenses Efficiency Ratio (%) - 40,0% - 60,0% - 80,0% 88 86 84 82 - 100,0% 2012 2013 Efficiency Ratio R$ millions 4Q13 3Q13 4Q12 2013 2012 Operating expenses 1 56 51 49 203 198 (-) Non-recurring expenses 1 1 1 6 7 Recurring Operating Expenses (A) 55 50 48 197 191 Revenues 2 (B) 106 140 122 495 582 Ratio (A/B) 51.9% 35.7% 39.3% 39.8% 32.8% 1 Other administrative expenses + tax expenses + personnel expenses 2 Gross Income from financial intermediation - provision for loan losses + fee income + overhedge effect Investor Relations | 4Q13 | 7/19
  • 8.
    Loan Portfolio1 Theportfolio reached R$9.9 billion... R$ million 965 843 18 13 10 8 405 8,994 9,537 9,930 2 807 3,073 2,909 782 1.021 1.154 942 781 832 1,059 102 81 65 47 36 26 7,065 7,426 7,642 7,444 7,948 8,405 Individuals: 0.1% Trade finance: 8.4% 561 588 883 884 822 800 853 826 844 990 1,108 1,687 1,684 1,599 1,699 2,114 2,501 2,807 Bank Guarantees: 29.3% BNDES O l di 322 367 670 683 787 670 549 3,289 3,389 3,332 3,274 3,377 3,550 3,717 3,935 4,472 Onlending : 11.2% Private Securities + Working Capital: 51.0% Dec-11 Mar-12 Jun-12 Sept-12 Dec-12 Mar-13 Jun-13 Sept-13 Dec-13 1 Includes Stand by LC, Bank Guarantees, Credit Securities to be Received and Private Securities (bonds, CRIs, eurobonds and fund shares) Investor Relations | 4Q13 | 8/19
  • 9.
    Continuous Loan PortfolioManagement ...with increased sector diversification... Retail 2013 Meatpacking 2% Other Meatpacking 2012 h Sugar and Ethanol 14% Construction Material 2% Beverages and Tobacco 2% Chemicals 2% Food Industry 2% 6% Sugar and Ethanol 15% Construction Material Financial Institutions Chemicals Telecom 2% 2% 2% p g 2% Other 9% Construction 14% 3% Foreign Trade 3% Telecom 4% Vehicles Parts Electric and Renewable Energy 13% Vehicles and Parts 3% Food Industry 3% Metals 2% 2% Electric and Renewable Energy Metallurgy 5% Specialized Services 9% 5% and 4% Construction 12% Metallurgy 4% Specialized Services 4% Foreign Trade 4% Agriculture 9% Infrastructure 9% Transportation and Logistics 5% Agriculture Infrastructure 9% 7% Transportation and Logistics 5% The portfolio of the 20 largest clients reshuffled by over 25% in the past 12 months; 20 largest clients continue to represent less than 30% of the total loan portfolio. Investor Relations | 4Q13 | 9/19
  • 10.
    Loan Portfolio Quality ... quality, collaterals, and adequate credit coverage. Loan Portfolio Quality Non Performing Loans > 90 days December 31, 2013 B 33.7% 2,0% Contracts Overdue Installments Overdue AA-1.2% 1.2% 1.1% 0.7% 0.6% 0.6% 0.6% 1,5% 1,0% 0,5% Contracts Overdue: total amount of the contracts overdue for more than 90 days / Loan Portfolio excluding Bank Guarantees and Stand-by Letters of Credit. AA A 52.9% C 8.2% D-E 3.4% F-H 1 9% 0.1% 0.1% 0.1% 0,0% Dec-12 Mar-13 Jun -13 Sept -13 Dec-13 Installents Overdue: total amount of installments overdue for more than 90 days / Loan Portfolio excluding Bank Guarantees and Stand-by Letters of Credit. 1.9% Credit Coverage Collaterals 3 4% 3 4% Products Guarantees 3.3% 3.4% 3.4% 3.0% 2.7% Pledge 34% Investments 3% 1% Receivables Dec-12 Mar-13 Jun-13 Sept-13 Dec-13 Credit Coverage: Provision / Loan Portfolio excluding Bank Guarantees and Stand-by Letters of Credit. Properties 23% Pledge 39% Investor Relations | 4Q13 | 10/19
  • 11.
    FICC Proven trackrecord:2nd in commodity derivatives1. Client Notional Derivatives by Market Notional Value and MtM December 31, 2013 R$ million Notional value MtM Stressed MtM Currencies 83% - 248 530 327 498 298 298 197 174 (195) Fixed Income Commodities (310) 5 036 5 180 5 891 11 090 11 148 8% 9% 5,036 5,180 5,891 11,090 11,148 Dec-12 Mar-13 Jun-13 Sept-13 Dec-13 Market Segments Portfolio Profile Fixed Income: Fixed Floating Inflation Libor Scenario December, on December 31: Duration: 183 days Mark-to-Market : R$327 million Fixed, Floating, Inflation, Currencies: Dollar, Euro, Yen, Pound, Canadian Dollar, Australian Dollar C dii S S b (G i M l d Oil) C Stress Scenario (Dollar: +31% and Commodities Prices: -30%): Stressed MtM: (R$310 million) Commodities: Sugar, Soybean Grain, Meal and Oil), Corn, Cotton, Metals, Energy 1Source: Cetip Report, December 2013 Investor Relations | 4Q13 | 11/19
  • 12.
    PINE Investimentos Consolidation,result of the focused effort through the years in the franchise. Capital Markets: Structuring and Distribution of Fixed Selected Transactions R$ 800,000,000 R$ 50,000,000 R$ 100,000,000 Income Transactions. Financial Advisory: Project & Structured Finance, M&A, Debentures Debentures Debentures and hybrid capital transactions. Research: Macro, Commodities, and Corporate. Coordinator January, 2013 Coordinator June, 2013 Lead Coordinator July, 2013 Volume of Underwriting Transactions R$ million R$ 483,000,000 US$ 400,000,000 Senior Notes CRI US$ 250,000,000 Bond 1 040 2,073 Coordinator Co-Manager Co-Manager 856 1,040 August, 2013 September, 2013 September, 2013 2011 2012 2013 Investor Relations | 4Q13 | 12/19
  • 13.
    Funding Diversified sourcesof funding... R$ million 41% 34% 38% 41% 50% 42% 44% 39% 41% Cash over Deposits 8 383 113 6,443 , 429 459 1.3% 500 808 997 973 866 6,575 6 443 6,972 6,804 7,062 6,589 7,111 7,894 8,383 Trade Finance: 10.3% Private Placements: 6.0% Multilateral Lines: 1 3% 312 314 593 640 901 796 975 1,411 1,424 246 233 295 260 409 402 435 437 353 276 234 156 152 78 80 69 250 125 118 180 173 171 181 686 771 1.011 1.073 752 International Capital Markets: 5.4% Local Capital Markets: 17.0% 934 938 890 23 112 90 31 33 106 161 194 176 121 139 1,196 1,186 1,228 1,177 110 110 93 1,174 972 1,013 1,048 1,112 250 281 223 213 146 126 119 113 33 30 126 19 20 840 903 870 862 1,099 1,147 Onlending: 13.7% Demand Deposits: 0.3% Interbank Time Deposits: 2,130 2,28 2,153 2,056 2,245 2,186 2,320 2,203 2,511 1.1% High Net Worth Individual Time Deposits: 1.7% Corporate Time Deposits: 13.2% I tit ti l Ti D it Dec-11 Mar-12 Jun-12 Sept-12 Dec-12 Mar-13 Jun-13 Sept-13 Dec-13 Institutional Time Deposits: 30.0% Investor Relations | 4Q13 | 13/19
  • 14.
    Asset & LiabilityManagement ... keeping a positive gap between credit and funding. Leverage Credit over Funding Ratio 7.5x 7.8x 7 1x 87% 85% 83% 10,0 Expanded Loan Portfolio 9,0 8,0 Loan Portfolio excluding Bank Guarantees 82% 7.1x 6.5x 6.7x 81% 4.8x 4.7x 4.9x 5.1x 5.5x 7,0 6,0 5,0 4,0 Dec-12 Mar-13 Jun-13 Sept-13 Dec-13 3,0 2,0 1,0 ‐ Dec-12 Mar-13 Jun-13 Sept -13 Dec-13 Credit over Funding ratio: Loan Portfolio excluding Bank Guarantees and Stand-by Letters of Credit / Total Funding R$ million Leverage: Expanded Loan Portfolio / Shareholders’ Equity Expanded Loan Portfolio excluding Bank Guarantees and Stand-by Letters of Credit / Shareholders’ Equity ALM – Average Maturity Total Deposits over Total Funding months Total Deposits Others 17 17 15 18 17 16 15 7,062 6,589 7,111 7,894 8,383 47% 47% 50% 56% 54% 13 14 14 Funding Credit 53% 53% 50% 44% 46% Dec-12 Mar-13 Jun-13 Sept-13 Dec-13 Dec-12 Mar-13 Jun-13 Sept-13 Dec-13 Investor Relations | 4Q13 | 14/19
  • 15.
    Capital Adequacy Ratio(BIS), Basel III BIS ratio reached 14.1%. Tier II Tier I Minimum Regulatory 4.2% 3 0% 2 1% 2 3% 18.5% 16.4% 15.9% 17.0% 16.2% 17.1% 17.0% Capital (11%) 15.9% 3.1% 3.3% 3.0% 2.8% 2.1% 2.3% 2.2% 14.1% 2.1% 14.3% 13.3% 12.6% 14.0% 13.4% 15.0% 14.7% 13.7% 12.0% Dec-11 Mar-12 Jun-12 Sept-12 Dec-12 Mar-13 Jun-13 Sept-13 Dec-13 R$ million BIS Ratio (%) Tier I 1,220 12.0 Tier II 222 2.1 Reference Equity 1,442 14.1% Investor Relations | 4Q13 | 15/19
  • 16.
    PINE4 Increased ADTVand yields above average. 92 81 87 105 86 84 111 195 182 220 137 246 168 154 Volume (R$ million) and Number of Trades (quantity) – Daily Average 1,324 1,367 2,027 1.251 26 44 44 30 41 49 53 52 38 30 Number of Trades Volume Hiring of Market Maker (R$) 161 871 435 267 1,004 607 407 947 309 564 716 634 762 935 1,000 1,023 932 1,093 584 426 jan/12 fev/12 mar/12 abr/12 mai/12 jun/12 jul/12 aug/12 sept/12 out/12 nov/12 dec/12 jan/13 fev/13 mar/13 abr/13 mai/13 jun/13 jul/13 aug/13 sept/13 out/13 nov/13 dec/13 Multiples Dividend Yield 10 9% 10 6% PINE4 | As of December 31th Price (R$) 10,53 P/BV 0 8 7.8% 8.5% 10.9% 10.6% 0.8x P/E(1) 5.8x 1Q13 2Q13 3Q13 4Q13 Dividend Yield: Average daily closing prices of the stocks in 3Q13 / Dividends and Interest on Own Capital of the last twelve months (1) Considers the market consensus for the 2013 net income; source: Bloomberg Investor Relations | 4Q13 | 16/19
  • 17.
    Guidance 2013 GuidancePerformed Expanded Loan Portfolio 12% - 15% 24.9% Personnel and Administrative Expenses 5% - 10% 3.1% NIM 4.5% - 6.5% 4.7% ROAE 15.0% - 17.0% 13.0% Investor Relations | 4Q13 | 17/19
  • 18.
    Guidance 2014 Assumption:1.6% GDP growth. Guidance Expanded Loan Portfolio 8.0% – 12.0% Personnel and Administrative Expenses 4.0% - 6.0% NIM 4.0% - 5.0% ROAE 13.0% - 15.0% Investor Relations | 4Q13 | 18/19
  • 19.
    Investor Relations NobertoN. Pinheiro Junior CEO Susana Waldeck Norberto Zaiet Junior CFO/IRO COO Raquel Varela Head of Investor Relations Alejandra Hidalgo Investor Relations Manager Luiz Máximo Investor Relations Analyst Ana Lopes Investor Relations Analyst Fone: +55 (11) 3372-5343 www.pine.com/ir ir@pine.com This report may contain forward-looking statements concerning the business prospects, projections of operating and financial results and growth outlook of PINE. These are merely projections and as such are based solely on management’s expectations regarding the future of the business. These statements depend substantially on market conditions, the performance of the sector and the Brazilian economy (political and economic changes, volatility in interest and exchange rates, technological changes, inflation, financial disintermediation, competitive pressures on products and prices and changes in tax legislation) and therefore are subject to change without prior notice. . Investor Relations | 4Q13 | 19/19