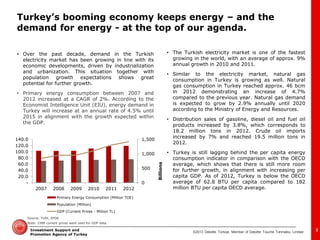
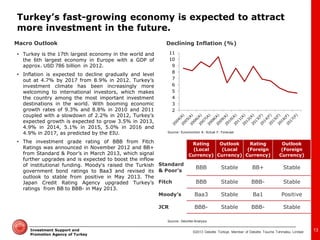
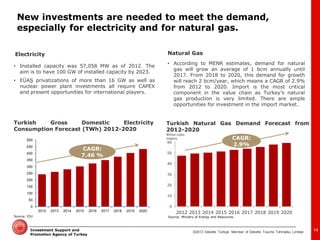
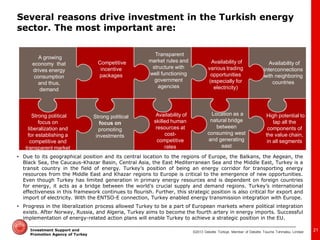
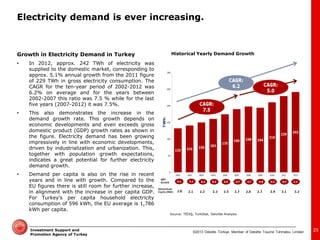
- Turkey has a fast-growing economy and energy demand that is expected to continue increasing significantly in the coming years.
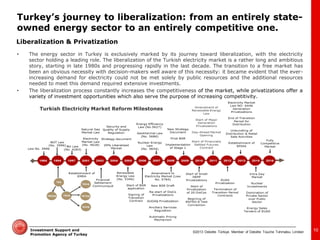
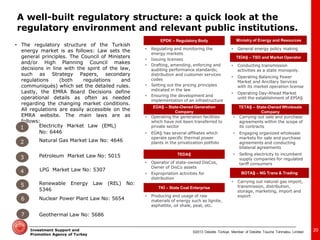
- The country has undertaken extensive reforms to liberalize its energy sector and attract more private investment, particularly in electricity, natural gas, oil, and coal.
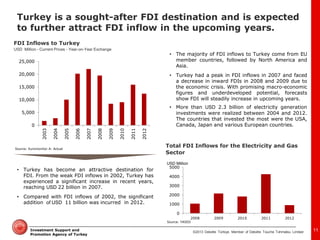
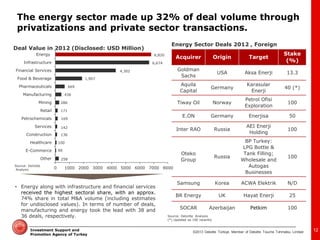
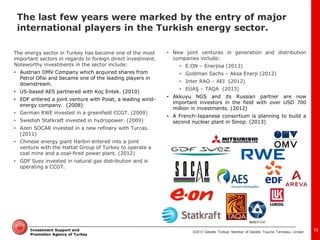
- Investment opportunities exist across the entire energy value chain, and the sector has received a large share of foreign direct investment and M&A deals in Turkey.