Downloaded 35 times


![8
• The state is still a dominant actor, but its share in the electricity market is decreasing.
• EUAS’s (Electricity Generation Company) share in installed power has decreased
from 90% in 1990 down to 43% in 2012. (Source: Turkish Electricity Transmission Company [TEIAS], 2013)
• The transmission, which is carried out by TEIAS (Electricity Transmission Company),
is 100% public.
• TETAS’s (Electricity Trading and Contracting Company) share in consumption, which
was 78% in 2005, decreased down to 34% in 2012. (Source: TETAS, 2013)
• Still many state-owned power plants in the privatization portfolio.
• All distribution companies have already been privatized.
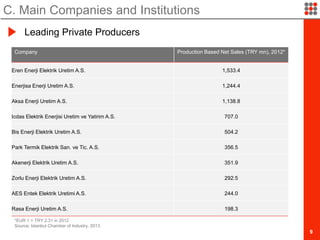
C. Main Companies and Institutions
State Enterprises and Privatization](https://image.slidesharecdn.com/fmc140704de-energyindustry-141219092444-conversion-gate01/85/Energy-Industry-in-Turkey-by-2014-8-320.jpg)
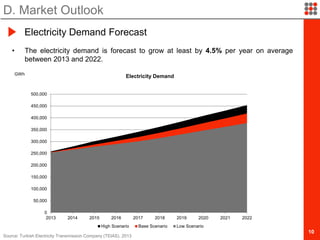

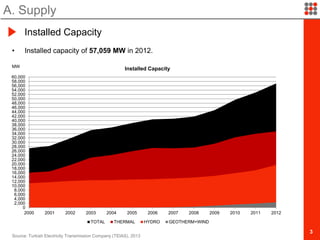
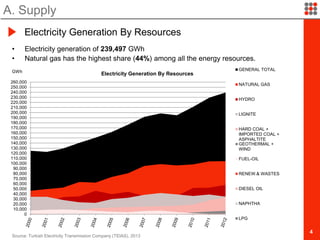
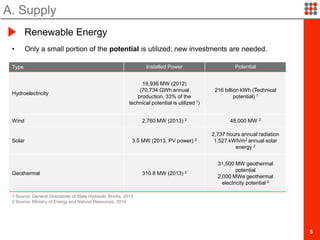
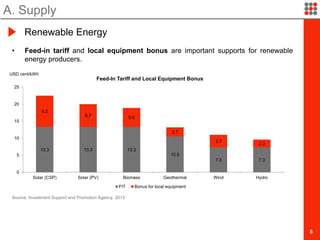
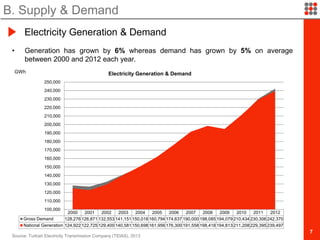
The document summarizes Turkey's energy industry, including: - Installed power capacity reached 57,059 MW in 2012, with natural gas making up 44% of electricity generation. - Renewable energy such as hydro, wind, and solar have significant potential but little has been developed. Feed-in tariffs support renewable producers. - Electricity demand has grown 5% annually while generation grew 6% from 2000-2012. The state previously dominated the industry but its control is decreasing through privatization. Significant new investments are needed to meet the projected 4.5% annual demand growth through 2022.