Download to read offline

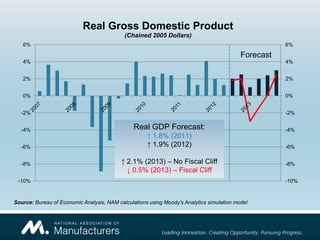
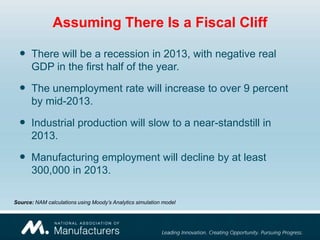
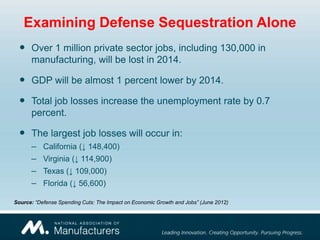
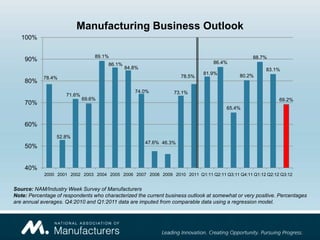
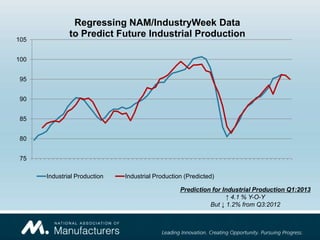
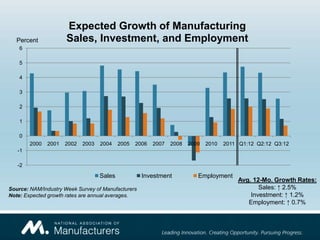
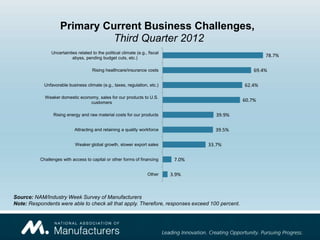
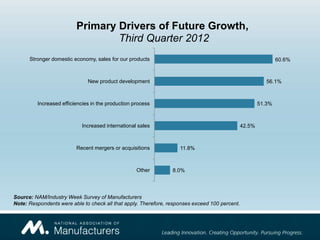


The Manufacturing Economic Update forecasts a recession in 2013, with negative GDP growth and an unemployment rate exceeding 9%. Additionally, over 1 million private sector jobs, including 130,000 in manufacturing, are expected to be lost by 2014 due to defense spending cuts. Challenges for manufacturing businesses include uncertainties over the political climate, rising costs, and a weaker domestic economy.


