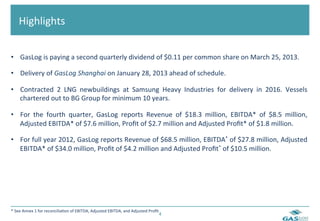
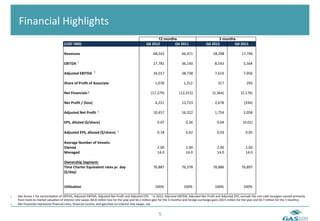
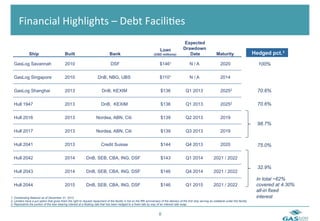
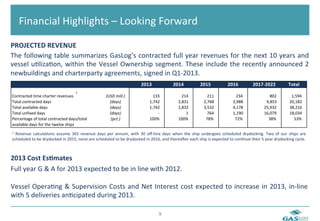
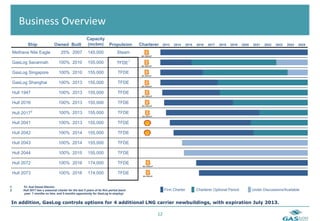
GASLOG	
  LTD	


     Fourth	
  Quarter	
  Earnings	
  Presenta8on	
  2012	
  
	
                    27	
  February	
  2013	


  Forward	
  Looking	
  Statements	
  
This	
   presenta6on	
   contains	
   “forward-­‐looking	
   statements”	
   as	
   defined	
   in	
   the	
   Private	
   Securi6es	
   Li6ga6on	
   Reform	
   Act	
   of	
   1995.	
  	
   The	
   reader	
  
is	
   cau6oned	
   not	
   to	
   rely	
   on	
   these	
   forward-­‐looking	
   statements.	
  	
   These	
   statements	
   are	
   based	
   on	
   current	
   expecta6ons	
   of	
   future	
   events.	
  	
   If	
  
underlying	
   assump6ons	
   prove	
   inaccurate	
   or	
   unknown	
   risks	
   or	
   uncertain6es	
   materialize,	
   actual	
   results	
   could	
   vary	
   materially	
   from	
   our	
  
expecta6ons	
  and	
  projec6ons.	
  	
  Risks	
  and	
  uncertain6es	
  include,	
  but	
  are	
  not	
  limited	
  to,	
  general	
  LNG	
  and	
  LNG	
  shipping	
  market	
  condi6ons	
  
and	
  trends,	
  including	
  charter	
  rates,	
  ship	
  values,	
  factors	
  affec6ng	
  supply	
  and	
  demand	
  and	
  opportuni6es	
  for	
  the	
  profitable	
  opera6ons	
  of	
  
LNG	
   carriers;	
   our	
   con6nued	
   ability	
   to	
   enter	
   into	
   mul6-­‐year	
   6me	
   charters	
   with	
   our	
   customers;	
   our	
   contracted	
   charter	
   revenue;	
   our	
  
customers’	
   performance	
   of	
   their	
   obliga6ons	
   under	
   our	
   6me	
   charters	
   and	
   other	
   contracts;	
   the	
   effect	
   of	
   the	
   worldwide	
   economic	
  
slowdown;	
  future	
  opera6ng	
  or	
  financial	
  results	
  and	
  future	
  revenue	
  and	
  expenses;	
  our	
  future	
  financial	
  condi6on	
  and	
  liquidity;	
  our	
  ability	
  
to	
   obtain	
   financing	
   to	
   fund	
   capital	
   expenditures,	
   acquisi6ons	
   and	
   other	
   corporate	
   ac6vi6es,	
   and	
   funding	
   by	
   banks	
   of	
   their	
   financial	
  
commitments;	
   future,	
   pending	
   or	
   recent	
   acquisi6ons	
   of	
   ships	
   or	
   other	
   assets,	
   business	
   strategy,	
   areas	
   of	
   possible	
   expansion	
   and	
  
expected	
   capital	
   spending	
   or	
   opera6ng	
   expenses;	
   our	
   ability	
   to	
   enter	
   into	
   shipbuilding	
   contracts	
   for	
   newbuilding	
   ships	
   and	
   our	
  
expecta6ons	
   about	
   the	
   availability	
   of	
   exis6ng	
   LNG	
   carriers	
   to	
   purchase,	
   as	
   well	
   as	
   our	
   ability	
   to	
   consummate	
   any	
   such	
   acquisi6ons;	
   our	
  
expecta6ons	
  about	
  the	
  6me	
  that	
  it	
  may	
  take	
  to	
  construct	
  and	
  deliver	
  newbuilding	
  ships	
  and	
  the	
  useful	
  lives	
  of	
  our	
  ships;	
  number	
  of	
  off-­‐
hire	
  days,	
  drydocking	
  requirements	
  and	
  insurance	
  costs;	
  our	
  an6cipated	
  general	
  and	
  administra6ve	
  expenses;	
  fluctua6ons	
  in	
  currencies	
  
and	
   interest	
   rates;	
   our	
   ability	
   to	
   maintain	
   long-­‐term	
   rela6onships	
   with	
   major	
   energy	
   companies;	
   expira6on	
   dates	
   and	
   extensions	
   of	
  
charters;	
   our	
   ability	
   to	
   maximize	
   the	
   use	
   of	
   our	
   ships,	
   including	
   the	
   re-­‐employment	
   or	
   disposal	
   of	
   ships	
   no	
   longer	
   under	
   mul6-­‐year	
  
charter	
   commitments;	
   environmental	
   and	
   regulatory	
   condi6ons,	
   including	
   changes	
   in	
   laws	
   and	
   regula6ons	
   or	
   ac6ons	
   taken	
   by	
  
regulatory	
   authori6es;	
   risks	
   inherent	
   in	
   ship	
   opera6on,	
   including	
   the	
   discharge	
   of	
   pollutants;	
   availability	
   of	
   skilled	
   labor,	
   ship	
   crews	
   and	
  
management;	
  poten6al	
  disrup6on	
  of	
  shipping	
  routes	
  due	
  to	
  accidents,	
  poli6cal	
  events,	
  piracy	
  or	
  acts	
  by	
  terrorists;	
  and	
  poten6al	
  liability	
  
from	
  future	
  li6ga6on.	
  A	
  further	
  list	
  and	
  descrip6on	
  of	
  these	
  risks,	
  uncertain6es	
  and	
  other	
  factors	
  can	
  be	
  found	
  in	
  our	
  Prospectus	
  filed	
  
April	
  2,	
  2012.	
  	
  Copies	
  of	
  the	
  Prospectus,	
  as	
  well	
  as	
  subsequent	
  filings,	
  are	
  available	
  online	
  at	
  www.sec.gov	
  or	
  on	
  request	
  from	
  us.	
  	
  We	
  do	
  
not	
  undertake	
  to	
  update	
  any	
  forward-­‐looking	
  statements	
  as	
  a	
  result	
  of	
  new	
  informa6on	
  or	
  future	
  events	
  or	
  developments.	


The	
  declara6on	
  and	
  payment	
  of	
  dividends	
  is	
  at	
  all	
  6mes	
  subject	
  to	
  the	
  discre6on	
  of	
  our	
  Board	
  of	
  Directors	
  and	
  will	
  depend	
  on,	
  among	
  
other	
  things,	
  our	
  earnings,	
  financial	
  condi6on,	
  cash	
  requirements	
  and	
  availability,	
  restric6ons	
  in	
  our	
  credit	
  facili6es	
  and	
  the	
  provisions	
  of	
  
Bermuda	
  law	
  and	
  such	
  other	
  factors	
  as	
  the	
  Board	
  of	
  Directors	
  may	
  deem	
  advisable.	


                                                                                                             2	
  
 	
  Agenda	


  • 	
  Highlights	
  

  • 	
  Financial	
  Highlights	
  

  • 	
  Market	
  Update	
  

  • 	
  Business	
  Overview	
  

  • 	
  Summary	


                                      3	
  
 	
  Highlights	


•  GasLog	
  is	
  paying	
  a	
  second	
  quarterly	
  dividend	
  of	
  $0.11	
  per	
  common	
  share	
  on	
  March	
  25,	
  2013.	
  

•  Delivery	
  of	
  GasLog	
  Shanghai	
  on	
  January	
  28,	
  2013	
  ahead	
  of	
  schedule.	
  

•  Contracted	
   2	
   LNG	
   newbuildings	
   at	
   Samsung	
   Heavy	
   Industries	
   for	
   delivery	
   in	
   2016.	
   Vessels	
  
   chartered	
  out	
  to	
  BG	
  Group	
  for	
  minimum	
  10	
  years.	
  

•  For	
   the	
   fourth	
   quarter,	
   GasLog	
   reports	
   Revenue	
   of	
   $18.3	
   million,	
   EBITDA*	
   of	
   $8.5	
   million,	
  
   Adjusted	
  EBITDA*	
  of	
  $7.6	
  million,	
  Profit	
  of	
  $2.7	
  million	
  and	
  Adjusted	
  Profit*	
  of	
  $1.8	
  million.	
  

•  For	
   full	
   year	
   2012,	
   GasLog	
   reports	
   Revenue	
   of	
   $68.5	
   million,	
   EBITDA*	
   of	
   $27.8	
   million,	
   Adjusted	
  
   EBITDA*	
  of	
  $34.0	
  million,	
  Profit	
  of	
  $4.2	
  million	
  and	
  Adjusted	
  Profit*	
  of	
  $10.5	
  million.	


*	
  See	
  Annex	
  1	
  for	
  reconcilia6on	
  of	
  EBITDA,	
  Adjusted	
  EBITDA,	
  and	
  Adjusted	
  Profit	
  
                                                                                                                     4	
  
 	
  Financial	
  Highlights	
  
                                                                                                                                                                              12 months                                                               3 months
                                                              (USD%'000)                                                                                       Q4%2012%                           Q4%2011                              Q4%2012%                          Q4%2011

                                                              Revenues                                                                                                  68,542                            66,471                               18,298                            17,796
                                                                              1	
  
                                                              EBITDA                                                                                                    27,781                            36,140                                 8,543                             5,564

                                                                                                 1	
  
                                                              Adjusted%EBITDA                                                                                           34,017                            38,738                                 7,619                             7,956

                                                              Share%of%Profit%of%Associate                                                                                1,078                             1,312                                    317                               293

                                                              Net%Financials%2	
                                                                                     (17,279)                          (12,315)                               (2,364)                           (5,176)

                                                              Net%Profit%/%(loss)                                                                                         4,221                           13,723                                 2,678                              (334)

                                                              Adjusted%Net%Profit% 1	
                                                                                  10,457                            16,322                                 1,754                             2,058

                                                              EPS,%diluted%($/share)                                                                                         0.07                              0.36                                 0.04                           (0.01)

                                                              Adjusted%EPS,%diluted%($/share)                                1	
                                             0.18                              0.42                                 0.03                              0.05

                                                              Average%Number%of%Vessels:
                                                              Owned                                                                                                          2.00                              2.00                                 2.00                              2.00
                                                              Managed                                                                                                        14.0                              14.0                                 14.0                              14.0

                                                              Ownership%Segment:
                                                              Time%Charter%Equivalent%rates%pr.%day%                                                                    76,887                            76,378                               76,886                            76,897
                                                              ($/day)


                                                              Utilisation                                                                                                 100%                              100%                                 100%                              100%

1.     See	
   Annex	
   1	
   for	
   reconcilia6on	
   of	
   EBITDA,	
   Adjusted	
   EBITDA,	
   Adjusted	
   Net	
   Profit	
   and	
   Adjusted	
   EPS.	


   In	
   2012,	
   Adjusted	
   EBITDA,	
   Adjusted	
   Net	
   Profit	
   and	
   Adjusted	
   EPS,	
   exclude	
   the	
   non-­‐cash	
   loss/gain	
   caused	
   primarily	
  
       from	
  mark-­‐to-­‐market	
  valua6on	
  of	
  interest	
  rate	
  swaps	
  ($6.8	
  million	
  loss	
  for	
  the	
  year	
  and	
  $0.2	
  million	
  gain	
  for	
  the	
  3	
  months)	
  and	
  foreign	
  exchange	
  gains	
  ($0.5	
  million	
  for	
  the	
  year	
  and	
  $0.7	
  million	
  for	
  the	
  3	
  months).	
  
2.     Net	
  Financials	
  represents	
  financial	
  costs,	
  financial	
  income,	
  and	
  gain/loss	
  on	
  interest	
  rate	
  swaps,	
  net.	


                                                                                                                                                                              5	
  
 	
  Financial	
  Highlights	
  
                (USD%'000)                                          31+Dec+12%   31+Dec+11%
                Assets

                Non+current%assets
                Goodwill                                                9,511        9,511
                Investment2in2associate                                 6,856        6,528
                Tangible2fixed2assets                                 426,880      438,902
                Deferred2financing2costs                               24,279       14,289
                Other2nonEcurrent2assets                                4,071          872
                Vessels2under2construction                            217,322      109,070
                Total%non+current%assets                              688,918      579,172

                Current%assets
                Trade2and2other2receivables                             2,432        2,683
                Dividends2receivable2and2due2from2related2parties         859        1,274
                Inventories                                               481          425
                Prepayments2and2other2current2assets                      425        3,366
                Short2term2investments                                104,674            0
                Cash2and2cash2equivalents                             110,978       20,093
                Total%current%assets                                  219,849       27,841

                Total%assets                                          908,768      607,013


                                                          6	
  
 	
  Financial	
  Highlights	
  
                   (USD%'000)                                 31+Dec+12%   31+Dec+11%
                   Equity%&%Liabilities

                   Equity
                   Share&capital                                     629          391
                   Contributed&surplus                          621,879      300,716
                   Reserves                                     (11,081)        1,744
                   Accumulated&deficit                           (8,217)     (12,437)
                   Total%equity                                 603,210      290,414

                   Current%liabilities
                   Trade&accounts&payable                         1,794        1,705
                   Ship&management&creditors                        851        1,102
                   Amounts&due&to&related&parties                   122          114
                   Derivative&financial&instruments               7,145        3,451
                   Other&payables&and&accruals                   15,094       18,541
                   Loans&K&current&portion                       25,753       24,277
                   Total%current%liabilities                     50,759       49,190

                   Non+current%liabilities
                   Derivative&financial&instruments              24,184        5,101
                   Loans&K&nonKcurrent&portion                  228,515      256,788
                   Other&nonKcurrent&liabilities                  2,100        5,520
                   Total%non+current%liabilities                254,798      267,409

                   Total%equity%&%liabilities                   908,768      607,013

                                                      7	
  
 	
  Financial	
  Highlights	
  –	
  Debt	
  Facili6es	
  
                                                                                                                                                  Expected
                                	
  	
                                                                                        Loan                Drawdown
               Ship                           Built                                Bank                                  (USD millions)              Date                     Maturity                      Hedged pct. 3	
  
  GasLog Savannah                             2010                                  DSF                                       $146¹                     N/A                       2020                         100%

  GasLog Singapore                            2010                       DnB, NBG, UBS                                        $110¹                     N/A                       2014

  GasLog Shanghai                             2013                           DnB, KEXIM                                        $136                 Q1 2013                       20252                       70.6%

  Hull 1947                                   2013                          DnB, KEXIM                                         $136                 Q1 2013                       20252                       70.6%

  Hull 2016                                   2013                      Nordea, ABN, Citi                                      $139                 Q2 2013                       2019
                                                                                                                                                                                                              98.7%
  Hull 2017                                   2013                      Nordea, ABN, Citi                                      $139                 Q3 2013                       2019

  Hull 2041                                   2013                          Credit Suisse                                      $144                 Q4 2013                       2020                        75.0%

  Hull 2042                                   2014              DnB, SEB, CBA, ING, DSF                                        $143                 Q1 2014                 2021 / 2022

                                                                                                                                                                                                              32.9%
  Hull 2043                                   2014              DnB, SEB, CBA, ING, DSF                                        $146                 Q4 2014                 2021 / 2022
                                                                                                                                                                                                              In total ~62%
  Hull 2044                                   2015              DnB, SEB, CBA, ING, DSF                                        $146                 Q1 2015                 2021 / 2022                       covered at 4.30%
                                                                                                                                                                                                              all-in fixed
1.  Outstanding Balance as of December 31, 2012.                                                                                                                                                              interest
2.  Lenders have a put option that gives them the right to request repayment of the facility in full on the fifth anniversary of the delivery of the first ship serving as collateral under the facility.
3.  Represents the portion of the loan bearing interest at a floating rate that has been hedged to a fixed rate by way of an interest rate swap.


                                                                                                                             8	
  
 	
  Financial	
  Highlights	
  –	
  Looking	
  Forward	
  

PROJECTED	
  REVENUE	
  
The	
  following	
  table	
  summarizes	
  GasLog’s	
  contracted	
  full	
  year	
  revenues	
  for	
  the	
  next	
  10	
  years	
  and	
  
vessel	
  u6liza6on,	
  within	
  the	
  Vessel	
  Ownership	
  segment.	
  These	
  include	
  the	
  recently	
  announced	
  2	
  
newbuildings	
  and	
  charterparty	
  agreements,	
  signed	
  in	
  Q1-­‐2013.	
  
	
                                                      2013          2014           2015    2016             2017)2022         Total
                                                    1	
  
Contracted*time*charter*revenues                                             (USD%mill.)               ****************133*         **********214*         ********211*         ***********234*           **************802*        ****1,594*
Total*contracted*days                                                          (days)                               1,742                  2,831                2,768                   2,988                        9,853            20,182
Total*available*days                                                           (days)                               1,742                  2,832                3,532                   4,178                     25,932              38,216
Total*unfixed*days                                                             (days)                                    B                      1                  764                  1,190                     16,079              18,034
Percentage*of*total*contracted*days/total*                                      (pct.)                              100%                   100%                   78%                     72%                          38%               53%
available*days*for*the*twelve*ships
1	
   Revenue	
   calcula6ons	
   assume	
   365	
   revenue	
   days	
   per	
   annum,	
   with	
   30	
   off-­‐hire	
   days	
   when	
   the	
   ship	
   undergoes	
   scheduled	
   drydocking.	
   Two	
   of	
   our	
   ships	
   are	
  

scheduled	
  to	
  be	
  drydocked	
  in	
  2015,	
  none	
  are	
  scheduled	
  to	
  be	
  drydocked	
  in	
  2016,	
  and	
  therealer	
  each	
  ship	
  is	
  expected	
  to	
  con6nue	
  their	
  5	
  year	
  drydocking	
  cycle.	


2013	
  Cost	
  Es8mates	
  
Full	
  year	
  G	
  &	
  A	
  for	
  2013	
  expected	
  to	
  be	
  in	
  line	
  with	
  2012.	


Vessel	
   Opera6ng	
   &	
   Supervision	
   Costs	
   and	
   Net	
   Interest	
   cost	
   expected	
   to	
   increase	
   in	
   2013,	
   in-­‐line	
  
with	
  5	
  deliveries	
  an6cipated	
  during	
  2013.	
  

                                                                                                                         9	
  
 	
  Market	
  Update	
  
LNG	
   shipping	
   con6nued	
   to	
   benefit	
   from	
   strong	
   industry	
   fundamentals.	
   Spot	
   rates	
   remained	
   at	
  
historically	
  high	
  levels;	
  suppor6ng	
  op6mism	
  for	
  longer-­‐term	
  forward-­‐rates.	
  

We	
  expect	
  LNG	
  produc6on	
  to	
  increase.	
  Developments	
  in	
  Q4-­‐2012	
  include:	


USA	
  	
   •  A	
   USA	
   Dept.	
   of	
   Energy	
   commissioned	
   study	
   concluded	
   LNG	
   exports	
   would	
   be	
   net	
  
	
               beneficial	
  for	
  the	
  US	
  economy.	
  
	
          •  Total	
   announced	
   a	
   20	
   year	
   agreement	
   to	
   buy	
   2	
   million	
   tons	
   p.a.	
   from	
   Cheniere	
  
                 Energy’s	
  Sabine	
  Pass	
  facility.	


China	
     •  BG	
  announced	
  that	
  CNOOC	
  had	
  agreed	
  to	
  buy	
  interests	
  in	
  their	
  Cur6s	
  LNG	
  project	
  as	
  
	
               well	
  as	
  5	
  million	
  tons	
  p.a.	
  from	
  BG’s	
  global	
  porpolio.	


India	
     •  GAIL	
  announced	
  a	
  20	
  year	
  agreement	
  to	
  buy	
  2.5	
  million	
  tons	
  p.a.	
  from	
  Gazprom.	


Thailand	
   •  PTT	
  announced	
  a	
  20	
  year	
  deal	
  to	
  buy	
  2	
  million	
  tons	
  p.a.	
  from	
  Qatar.	


                                                                            10	
  
 	
  Business	
  Overview	
  -­‐	
  GasLog’s	
  recently	
  announced	
  orders	
  &	
  charters	


On	
  February	
  8th	
  2013,	
  GasLog	
  announced:	
  
•  2	
  firm	
  orders	
  for	
  LNG	
  carriers	
  to	
  be	
  built	
  by	
  Samsung	
  Heavy	
  Industries,	
  South	
  Korea.	
  
•  Each	
  ship	
  will	
  commence	
  10	
  year	
  6me	
  charters	
  to	
  BG	
  subsidiary	
  from	
  delivery	
  in	
  H1-­‐2016.	
  
•  Combined	
  investment	
  of	
  $410-­‐420	
  million	
  (delivered	
  cost).	
  
•  EBITDA	
  of	
  $47-­‐48	
  million	
  expected	
  in	
  the	
  first	
  twelve	
  months	
  of	
  opera6on.	
  
•  We	
  now	
  hold	
  priced	
  op6ons	
  for	
  4	
  ships	
  at	
  Samsung.	


GasLog	
  also	
  agreed	
  to	
  modify	
  the	
  charter	
  currently	
  in	
  place	
  for	
  Hull	
  2017.	
  
•  8	
   year	
   structure,	
   in	
   place	
   of	
   the	
   former	
   6	
   years.	
   Ini6al	
   3	
   years	
   as	
   before,	
   with	
   subsequent	
   5	
  
   years	
  of	
  seasonal	
  charter	
  (each	
  year:	
  7	
  months	
  on	
  hire,	
  and	
  5	
  months	
  of	
  opportunity	
  for	
  GasLog	
  
   to	
  employ).	
  
•  EBITDA	
  of	
  approx.	
  $14-­‐16	
  million	
  expected	
  in	
  each	
  7	
  month	
  period.	


                                                                                  11	
  
 	
  Business	
  Overview	
  
                                                          Capacity
             Ship                Owned Built              (mcbm)           Propulsion      Charterer   2013      2014   2015   2016   2017   2018   2019   2020   2021   2022   2023   2024   2025

   Methane Nile Eagle                 25% 2007             145,000               Steam

   GasLog Savannah                  100% 2010              155,000               TFDE 1

   GasLog Singapore                 100% 2010              155,000               TFDE

   GasLog Shanghai                  100% 2013              155,000               TFDE

   Hull 1947                        100% 2013              155,000               TFDE

   Hull 2016                        100% 2013              155,000               TFDE

   Hull 20172                       100% 2013              155,000               TFDE

   Hull 2041                        100% 2013              155,000               TFDE

   Hull 2042                        100% 2014              155,000               TFDE

   Hull 2043                        100% 2014              155,000               TFDE

   Hull 2044                        100% 2015              155,000               TFDE

   Hull 2072                        100% 2016              174,000               TFDE

   Hull 2073                        100% 2016              174,000               TFDE


 1.       Tri -fuel Diesel Electric.
 2.       Hull 2017 has a seasonal charter for the last 5 years of its firm period (each                    Firm Charter       Charterer Optional Period          Under Discussions/Available
          year: 7 months on hire, and 5 months opportunity for GasLog to employ)


n  In addition, GasLog controls options for 4 additional LNG carrier newbuildings, with expiration July 2013.

                                                                                                   12	
  
 	
  Summary	
  

GasLog	
  is	
  paying	
  a	
  quarterly	
  dividend	
  of	
  $0.11	
  per	
  share	
  on	
  March	
  25,	
  2013.	


Our	
   overall	
   performance	
   in	
   2012	
   provides	
   us	
   with	
   a	
   solid	
   plaporm	
   for	
   the	
   projected	
  
growth	
  of	
  GasLog	
  in	
  2013	
  and	
  beyond.	


2	
  newbuilds	
  at	
  Samsung	
  H.I.,	
  with	
  10	
  year	
  charters	
  to	
  BG	
  group,	
  announced	
  in	
  Q1-­‐2013.	


GasLog	
  Shanghai	
  delivered	
  in	
  January	
  2013;	
  the	
  first	
  of	
  5	
  expected	
  deliveries	
  in	
  2013.	


Con6nued	
  strong	
  fundamentals	
  for	
  the	
  LNG	
  industry.	


GasLog’s	
  strengths	
  come	
  from:	
  
   •  Significant	
  contracted	
  revenues	
  from	
  credit-­‐worthy	
  counterparts.	
  
   •  A	
  strong	
  financial	
  posi6on	
  and	
  track	
  record	
  in	
  securing	
  funding.	
  
   •  A	
  young,	
  pure-­‐play	
  LNG	
  shipping	
  fleet	
  with	
  fuel-­‐efficient	
  technology.	
  	
  
   •  An	
  experienced	
  technical	
  plaporm	
  delivering	
  strong	
  opera6onal	
  performance.
            	
  	
                                            13	
  
 	
  Annex	
  1	
  –	
  reconcilia6on	
  /	
  non-­‐GAAP	
  measures	


Non-­‐GAAP	
  Financial	
  Measure	


EBITDA	
  represents	
  earnings	
  before	
  interest	
  income	
  and	
  expense,	
  taxes,	
  deprecia6on	
  and	
  amor6za6on.	
  Adjusted	
  EBITDA	
  represents	
  EBITDA	
  before	
  gain/loss	
  on	
  interest	
  rate	
  swaps	
  
and	
  net	
  foreign	
  exchange	
  gains/losses.	
  Adjusted	
  Profit/(loss)	
  and	
  Adjusted	
  EPS	
  represent	
  earnings	
  and	
  earnings	
  per	
  share,	
  respec6vely,	
  before	
  gain/loss	
  on	
  interest	
  rate	
  swaps	
  and	
  
net	
   foreign	
   exchange	
   gains.	
   EBITDA,	
   Adjusted	
   EBITDA,	
   Adjusted	
   Profit/(loss)	
   and	
   Adjusted	
   EPS,	
   which	
   are	
   non-­‐GAAP	
   financial	
   measures,	
   are	
   used	
   as	
   supplemental	
   financial	
  
measures	
   by	
   management	
   and	
   external	
   users	
   of	
   financial	
   statements,	
   such	
   as	
   investors,	
   to	
   assess	
   our	
   financial	
   and	
   opera6ng	
   performance.	
   We	
   believe	
   that	
   these	
   non-­‐GAAP	
  
financial	
  measures	
  assist	
  our	
  management	
  and	
  investors	
  by	
  increasing	
  the	
  comparability	
  of	
  our	
  performance	
  from	
  period	
  to	
  period.	
  We	
  believe	
  that	
  including	
  EBITDA,	
  Adjusted	
  
EBITDA,	
  Adjusted	
  Profit/(loss)	
  and	
  Adjusted	
  EPS	
  assists	
  our	
  management	
  and	
  investors	
  in	
  (i)	
  understanding	
  and	
  analyzing	
  the	
  results	
  of	
  our	
  opera6ng	
  and	
  business	
  performance,	
  
(ii)	
  selec6ng	
  between	
  inves6ng	
  in	
  us	
  and	
  other	
  investment	
  alterna6ves	
  and	
  (iii)	
  monitoring	
  our	
  ongoing	
  financial	
  and	
  opera6onal	
  strength	
  in	
  assessing	
  whether	
  to	
  con6nue	
  to	
  hold	
  
our	
   common	
   shares.	
   This	
   increased	
   comparability	
   is	
   achieved	
   by	
   excluding	
   the	
   poten6ally	
   disparate	
   effects	
   between	
   periods	
   of,	
   in	
   the	
   case	
   of	
   EBITDA	
   and	
   Adjusted	
   EBITDA,	
  
interest,	
   taxes,	
   deprecia6on	
   and	
   amor6za6on	
   and,	
   and	
   in	
   the	
   case	
   of	
   Adjusted	
   EBITDA,	
   Adjusted	
   Profit/(loss)	
   and	
   Adjusted	
   EPS,	
   loss	
   on	
   interest	
   rate	
   swaps	
   and	
   net	
   foreign	
  
exchange	
  gains/losses,	
  which	
  items	
  are	
  affected	
  by	
  various	
  and	
  possibly	
  changing	
  financing	
  methods,	
  capital	
  structure	
  and	
  historical	
  cost	
  basis	
  and	
  which	
  items	
  may	
  significantly	
  
affect	
  results	
  of	
  opera6ons	
  between	
  periods.	


EBITDA,	
  Adjusted	
  EBITDA,	
  Adjusted	
  Profit/(loss)	
  and	
  Adjusted	
  EPS	
  have	
  limita6ons	
  as	
  analy6cal	
  tools	
  and	
  should	
  not	
  be	
  considered	
  as	
  alterna6ves	
  to,	
  or	
  as	
  subs6tutes	
  for,	
  profit,	
  
profit	
  from	
  opera6ons,	
  earnings	
  per	
  share	
  or	
  any	
  other	
  measure	
  of	
  financial	
  performance	
  presented	
  in	
  accordance	
  with	
  IFRS.	
  These	
  non-­‐GAAP	
  financial	
  measures	
  exclude	
  some,	
  
but	
  not	
  all,	
  items	
  that	
  affect	
  profit,	
  and	
  these	
  measures	
  may	
  vary	
  among	
  companies.	
  In	
  evalua6ng	
  Adjusted	
  EBITDA,	
  Adjusted	
  Profit/(loss)	
  and	
  Adjusted	
  EPS,	
  you	
  should	
  be	
  aware	
  
that	
  in	
  the	
  future	
  we	
  may	
  incur	
  expenses	
  that	
  are	
  the	
  same	
  as	
  or	
  similar	
  to	
  some	
  of	
  the	
  adjustments	
  in	
  this	
  presenta6on.	
  Our	
  presenta6on	
  of	
  Adjusted	
  EBITDA,	
  Adjusted	
  Profit/
(loss)	
  and	
  Adjusted	
  EPS	
  should	
  not	
  be	
  construed	
  as	
  an	
  inference	
  that	
  our	
  future	
  results	
  will	
  be	
  unaffected	
  by	
  the	
  excluded	
  items.	
  Therefore,	
  the	
  non-­‐GAAP	
  financial	
  measures	
  as	
  
presented	
  below	
  may	
  not	
  be	
  comparable	
  to	
  similarly	
  6tled	
  measures	
  of	
  other	
  companies	
  in	
  the	
  shipping	
  or	
  other	
  industries.	


                                                                                                                                     14	
  
 	
  Annex	
  1	
  -­‐	
  reconcilia6on	
  (cont.)	
  

Reconciliation of EBITDA and Adjusted EBITDA to Profit/(loss) for the three and twelve month periods ended:
(All amounts expressed in U.S. Dollars)


                                                                For the three months ended                                 For the year ended

                                                      December 31, 2011              December 31, 2012        December 31, 2011          December 31, 2012

Profit/(loss) for the period                                      (333,980)                     2,677,888              13,722,678                   4,220,819
Depreciation of fixed assets                                      3,214,646                     3,291,587               12,827,284                 13,064,898
Financial costs                                                   2,683,756                     2,822,665                9,631,262                 11,669,562
Financial income                                                      (509)                     (249,237)                 (41,679)                 (1,174,361)


EBITDA                                                            5,563,913                     8,542,903               36,139,545                 27,780,918


Loss /(gain) on interest rate swaps, net                          2,492,735                     (209,832)                2,725,374                  6,783,315
Foreign exchange gains, net                                       (101,137)                     (713,734)                (126,493)                  (546,791)


Adjusted EBITDA                                                   7,955,511                     7,619,337               38,738,426                 34,017,442


                                                                                 15	
  
 	
  Annex	
  1	
  -­‐	
  reconcilia6on	
  (cont.)	


Reconciliation of Adjusted Profit/(loss) to Profit/(loss) for the three and twelve month periods ended:
(All amounts expressed in U.S. Dollars)
                                                                               For the three months ended                            For the year ended
                                                                     December 31, 2011            December 31, 2012     December 31, 2011          December 31, 2012
Profit/(loss) for the period                                                    (333,980)                   2,677,888           13,722,678                   4,220,819
Loss on interest rate swaps, net                                                2,492,735                   (209,832)             2,725,374                  6,783,315
Foreign exchange gains, net                                                     (101,137)                   (713,734)             (126,493)                  (546,791)


Adjusted Profit/(loss)                                                          2,057,618                   1,754,322            16,321,559                 10,457,343
Non-controlling interest                                                               —                          —                316,973                         —


Adjusted Profit/(loss) attributable to owners of the Group                      2,057,618                   1,754,322           16,638,532                  10,457,343


                                                                                         16	
  
 	
  Annex	
  1	
  -­‐	
  reconcilia6on	
  (cont.)	
  

Reconciliation of Adjusted Earnings Per Share to Earnings Per Share for the three months and the years ended December 31, 2011 and 2012:
(All amounts expressed in U.S. Dollars)
                                                                                                   For the three months ended                                    For the year ended
                                                                                       December 31, 2011               December 31, 2012          December 31, 2011             December 31, 2012
   Profit for the period attributable to owners of the Group                                       (333,980)                        2,677,888               14,039,651                     4,220,819
   Less: Earnings allocated to manager shares and subsidiary manager
                                                                                                                                            —                1,201,919                        44,798
   shares                                                                                           (25,709)


   Earnings attributable to the owners of common shares used in the
                                                                                                                                    2,677,888               12,837,732                     4,176,021
   calculation of basic EPS                                                                        (308,271)
   Weighted average number of shares outstanding                                                  36,091,510                       62,863,166               35,837,297                    56,093,775


   EPS                                                                                                 (0.01)                              0.04                   0.36                          0.07


   Adjusted profit for the period attributable to owners of the Group                              2,057,618                        1,754,322               16,638,532                    10,457,343
   Less: Adjusted earnings allocated to manager shares and subsidiary
                                                                                                     158,393                                —                1,418,874                       110,990
   manager shares


   Adjusted earnings attributable to the owners of common shares used
                                                                                                   1,899,225                        1,754,322               15,219,658                    10,346,353
   in the calculation of basic EPS
   Weighted average number of shares outstanding                                                  36,091,510                       62,863,166               35,837,297                    56,093,775


   Adjusted EPS                                                                                          0.05                              0.03                   0.42                          0.18


                                                                                                     17	
  

GasLog Q4 2012 results presentation

  • 1.
            GASLOG  LTD       Fourth  Quarter  Earnings  Presenta8on  2012     27  February  2013          
  • 2.
       Forward  Looking  Statements   This   presenta6on   contains   “forward-­‐looking   statements”   as   defined   in   the   Private   Securi6es   Li6ga6on   Reform   Act   of   1995.     The   reader   is   cau6oned   not   to   rely   on   these   forward-­‐looking   statements.     These   statements   are   based   on   current   expecta6ons   of   future   events.     If   underlying   assump6ons   prove   inaccurate   or   unknown   risks   or   uncertain6es   materialize,   actual   results   could   vary   materially   from   our   expecta6ons  and  projec6ons.    Risks  and  uncertain6es  include,  but  are  not  limited  to,  general  LNG  and  LNG  shipping  market  condi6ons   and  trends,  including  charter  rates,  ship  values,  factors  affec6ng  supply  and  demand  and  opportuni6es  for  the  profitable  opera6ons  of   LNG   carriers;   our   con6nued   ability   to   enter   into   mul6-­‐year   6me   charters   with   our   customers;   our   contracted   charter   revenue;   our   customers’   performance   of   their   obliga6ons   under   our   6me   charters   and   other   contracts;   the   effect   of   the   worldwide   economic   slowdown;  future  opera6ng  or  financial  results  and  future  revenue  and  expenses;  our  future  financial  condi6on  and  liquidity;  our  ability   to   obtain   financing   to   fund   capital   expenditures,   acquisi6ons   and   other   corporate   ac6vi6es,   and   funding   by   banks   of   their   financial   commitments;   future,   pending   or   recent   acquisi6ons   of   ships   or   other   assets,   business   strategy,   areas   of   possible   expansion   and   expected   capital   spending   or   opera6ng   expenses;   our   ability   to   enter   into   shipbuilding   contracts   for   newbuilding   ships   and   our   expecta6ons   about   the   availability   of   exis6ng   LNG   carriers   to   purchase,   as   well   as   our   ability   to   consummate   any   such   acquisi6ons;   our   expecta6ons  about  the  6me  that  it  may  take  to  construct  and  deliver  newbuilding  ships  and  the  useful  lives  of  our  ships;  number  of  off-­‐ hire  days,  drydocking  requirements  and  insurance  costs;  our  an6cipated  general  and  administra6ve  expenses;  fluctua6ons  in  currencies   and   interest   rates;   our   ability   to   maintain   long-­‐term   rela6onships   with   major   energy   companies;   expira6on   dates   and   extensions   of   charters;   our   ability   to   maximize   the   use   of   our   ships,   including   the   re-­‐employment   or   disposal   of   ships   no   longer   under   mul6-­‐year   charter   commitments;   environmental   and   regulatory   condi6ons,   including   changes   in   laws   and   regula6ons   or   ac6ons   taken   by   regulatory   authori6es;   risks   inherent   in   ship   opera6on,   including   the   discharge   of   pollutants;   availability   of   skilled   labor,   ship   crews   and   management;  poten6al  disrup6on  of  shipping  routes  due  to  accidents,  poli6cal  events,  piracy  or  acts  by  terrorists;  and  poten6al  liability   from  future  li6ga6on.  A  further  list  and  descrip6on  of  these  risks,  uncertain6es  and  other  factors  can  be  found  in  our  Prospectus  filed   April  2,  2012.    Copies  of  the  Prospectus,  as  well  as  subsequent  filings,  are  available  online  at  www.sec.gov  or  on  request  from  us.    We  do   not  undertake  to  update  any  forward-­‐looking  statements  as  a  result  of  new  informa6on  or  future  events  or  developments.     The  declara6on  and  payment  of  dividends  is  at  all  6mes  subject  to  the  discre6on  of  our  Board  of  Directors  and  will  depend  on,  among   other  things,  our  earnings,  financial  condi6on,  cash  requirements  and  availability,  restric6ons  in  our  credit  facili6es  and  the  provisions  of   Bermuda  law  and  such  other  factors  as  the  Board  of  Directors  may  deem  advisable.       2  
  • 3.
       Agenda   •   Highlights   •   Financial  Highlights   •   Market  Update   •   Business  Overview   •   Summary   3  
  • 4.
       Highlights   • GasLog  is  paying  a  second  quarterly  dividend  of  $0.11  per  common  share  on  March  25,  2013.   •  Delivery  of  GasLog  Shanghai  on  January  28,  2013  ahead  of  schedule.   •  Contracted   2   LNG   newbuildings   at   Samsung   Heavy   Industries   for   delivery   in   2016.   Vessels   chartered  out  to  BG  Group  for  minimum  10  years.   •  For   the   fourth   quarter,   GasLog   reports   Revenue   of   $18.3   million,   EBITDA*   of   $8.5   million,   Adjusted  EBITDA*  of  $7.6  million,  Profit  of  $2.7  million  and  Adjusted  Profit*  of  $1.8  million.   •  For   full   year   2012,   GasLog   reports   Revenue   of   $68.5   million,   EBITDA*   of   $27.8   million,   Adjusted   EBITDA*  of  $34.0  million,  Profit  of  $4.2  million  and  Adjusted  Profit*  of  $10.5  million.   *  See  Annex  1  for  reconcilia6on  of  EBITDA,  Adjusted  EBITDA,  and  Adjusted  Profit   4  
  • 5.
       Financial  Highlights   12 months 3 months (USD%'000) Q4%2012% Q4%2011 Q4%2012% Q4%2011 Revenues 68,542 66,471 18,298 17,796 1   EBITDA 27,781 36,140 8,543 5,564 1   Adjusted%EBITDA 34,017 38,738 7,619 7,956 Share%of%Profit%of%Associate 1,078 1,312 317 293 Net%Financials%2   (17,279) (12,315) (2,364) (5,176) Net%Profit%/%(loss) 4,221 13,723 2,678 (334) Adjusted%Net%Profit% 1   10,457 16,322 1,754 2,058 EPS,%diluted%($/share) 0.07 0.36 0.04 (0.01) Adjusted%EPS,%diluted%($/share) 1   0.18 0.42 0.03 0.05 Average%Number%of%Vessels: Owned 2.00 2.00 2.00 2.00 Managed 14.0 14.0 14.0 14.0 Ownership%Segment: Time%Charter%Equivalent%rates%pr.%day% 76,887 76,378 76,886 76,897 ($/day) Utilisation 100% 100% 100% 100% 1.  See   Annex   1   for   reconcilia6on   of   EBITDA,   Adjusted   EBITDA,   Adjusted   Net   Profit   and   Adjusted   EPS.         In   2012,   Adjusted   EBITDA,   Adjusted   Net   Profit   and   Adjusted   EPS,   exclude   the   non-­‐cash   loss/gain   caused   primarily   from  mark-­‐to-­‐market  valua6on  of  interest  rate  swaps  ($6.8  million  loss  for  the  year  and  $0.2  million  gain  for  the  3  months)  and  foreign  exchange  gains  ($0.5  million  for  the  year  and  $0.7  million  for  the  3  months).   2.  Net  Financials  represents  financial  costs,  financial  income,  and  gain/loss  on  interest  rate  swaps,  net.   5  
  • 6.
       Financial  Highlights   (USD%'000) 31+Dec+12% 31+Dec+11% Assets Non+current%assets Goodwill 9,511 9,511 Investment2in2associate 6,856 6,528 Tangible2fixed2assets 426,880 438,902 Deferred2financing2costs 24,279 14,289 Other2nonEcurrent2assets 4,071 872 Vessels2under2construction 217,322 109,070 Total%non+current%assets 688,918 579,172 Current%assets Trade2and2other2receivables 2,432 2,683 Dividends2receivable2and2due2from2related2parties 859 1,274 Inventories 481 425 Prepayments2and2other2current2assets 425 3,366 Short2term2investments 104,674 0 Cash2and2cash2equivalents 110,978 20,093 Total%current%assets 219,849 27,841 Total%assets 908,768 607,013 6  
  • 7.
       Financial  Highlights   (USD%'000) 31+Dec+12% 31+Dec+11% Equity%&%Liabilities Equity Share&capital 629 391 Contributed&surplus 621,879 300,716 Reserves (11,081) 1,744 Accumulated&deficit (8,217) (12,437) Total%equity 603,210 290,414 Current%liabilities Trade&accounts&payable 1,794 1,705 Ship&management&creditors 851 1,102 Amounts&due&to&related&parties 122 114 Derivative&financial&instruments 7,145 3,451 Other&payables&and&accruals 15,094 18,541 Loans&K&current&portion 25,753 24,277 Total%current%liabilities 50,759 49,190 Non+current%liabilities Derivative&financial&instruments 24,184 5,101 Loans&K&nonKcurrent&portion 228,515 256,788 Other&nonKcurrent&liabilities 2,100 5,520 Total%non+current%liabilities 254,798 267,409 Total%equity%&%liabilities 908,768 607,013 7  
  • 8.
       Financial  Highlights  –  Debt  Facili6es   Expected     Loan Drawdown Ship Built Bank (USD millions) Date Maturity Hedged pct. 3   GasLog Savannah 2010 DSF $146¹ N/A 2020 100% GasLog Singapore 2010 DnB, NBG, UBS $110¹ N/A 2014 GasLog Shanghai 2013 DnB, KEXIM $136 Q1 2013 20252 70.6% Hull 1947 2013 DnB, KEXIM $136 Q1 2013 20252 70.6% Hull 2016 2013 Nordea, ABN, Citi $139 Q2 2013 2019 98.7% Hull 2017 2013 Nordea, ABN, Citi $139 Q3 2013 2019 Hull 2041 2013 Credit Suisse $144 Q4 2013 2020 75.0% Hull 2042 2014 DnB, SEB, CBA, ING, DSF $143 Q1 2014 2021 / 2022 32.9% Hull 2043 2014 DnB, SEB, CBA, ING, DSF $146 Q4 2014 2021 / 2022 In total ~62% Hull 2044 2015 DnB, SEB, CBA, ING, DSF $146 Q1 2015 2021 / 2022 covered at 4.30% all-in fixed 1.  Outstanding Balance as of December 31, 2012. interest 2.  Lenders have a put option that gives them the right to request repayment of the facility in full on the fifth anniversary of the delivery of the first ship serving as collateral under the facility. 3.  Represents the portion of the loan bearing interest at a floating rate that has been hedged to a fixed rate by way of an interest rate swap. 8  
  • 9.
       Financial  Highlights  –  Looking  Forward   PROJECTED  REVENUE   The  following  table  summarizes  GasLog’s  contracted  full  year  revenues  for  the  next  10  years  and   vessel  u6liza6on,  within  the  Vessel  Ownership  segment.  These  include  the  recently  announced  2   newbuildings  and  charterparty  agreements,  signed  in  Q1-­‐2013.     2013 2014 2015 2016 2017)2022 Total 1   Contracted*time*charter*revenues (USD%mill.) ****************133* **********214* ********211* ***********234* **************802* ****1,594* Total*contracted*days (days) 1,742 2,831 2,768 2,988 9,853 20,182 Total*available*days (days) 1,742 2,832 3,532 4,178 25,932 38,216 Total*unfixed*days (days) B 1 764 1,190 16,079 18,034 Percentage*of*total*contracted*days/total* (pct.) 100% 100% 78% 72% 38% 53% available*days*for*the*twelve*ships 1   Revenue   calcula6ons   assume   365   revenue   days   per   annum,   with   30   off-­‐hire   days   when   the   ship   undergoes   scheduled   drydocking.   Two   of   our   ships   are   scheduled  to  be  drydocked  in  2015,  none  are  scheduled  to  be  drydocked  in  2016,  and  therealer  each  ship  is  expected  to  con6nue  their  5  year  drydocking  cycle.         2013  Cost  Es8mates   Full  year  G  &  A  for  2013  expected  to  be  in  line  with  2012.     Vessel   Opera6ng   &   Supervision   Costs   and   Net   Interest   cost   expected   to   increase   in   2013,   in-­‐line   with  5  deliveries  an6cipated  during  2013.   9  
  • 10.
       Market  Update   LNG   shipping   con6nued   to   benefit   from   strong   industry   fundamentals.   Spot   rates   remained   at   historically  high  levels;  suppor6ng  op6mism  for  longer-­‐term  forward-­‐rates.   We  expect  LNG  produc6on  to  increase.  Developments  in  Q4-­‐2012  include:       USA     •  A   USA   Dept.   of   Energy   commissioned   study   concluded   LNG   exports   would   be   net     beneficial  for  the  US  economy.     •  Total   announced   a   20   year   agreement   to   buy   2   million   tons   p.a.   from   Cheniere   Energy’s  Sabine  Pass  facility.         China   •  BG  announced  that  CNOOC  had  agreed  to  buy  interests  in  their  Cur6s  LNG  project  as     well  as  5  million  tons  p.a.  from  BG’s  global  porpolio.         India   •  GAIL  announced  a  20  year  agreement  to  buy  2.5  million  tons  p.a.  from  Gazprom.     Thailand   •  PTT  announced  a  20  year  deal  to  buy  2  million  tons  p.a.  from  Qatar.   10  
  • 11.
       Business  Overview  -­‐  GasLog’s  recently  announced  orders  &  charters   On  February  8th  2013,  GasLog  announced:   •  2  firm  orders  for  LNG  carriers  to  be  built  by  Samsung  Heavy  Industries,  South  Korea.   •  Each  ship  will  commence  10  year  6me  charters  to  BG  subsidiary  from  delivery  in  H1-­‐2016.   •  Combined  investment  of  $410-­‐420  million  (delivered  cost).   •  EBITDA  of  $47-­‐48  million  expected  in  the  first  twelve  months  of  opera6on.   •  We  now  hold  priced  op6ons  for  4  ships  at  Samsung.   GasLog  also  agreed  to  modify  the  charter  currently  in  place  for  Hull  2017.   •  8   year   structure,   in   place   of   the   former   6   years.   Ini6al   3   years   as   before,   with   subsequent   5   years  of  seasonal  charter  (each  year:  7  months  on  hire,  and  5  months  of  opportunity  for  GasLog   to  employ).   •  EBITDA  of  approx.  $14-­‐16  million  expected  in  each  7  month  period.   11  
  • 12.
       Business  Overview   Capacity Ship Owned Built (mcbm) Propulsion Charterer 2013 2014 2015 2016 2017 2018 2019 2020 2021 2022 2023 2024 2025 Methane Nile Eagle 25% 2007 145,000 Steam GasLog Savannah 100% 2010 155,000 TFDE 1 GasLog Singapore 100% 2010 155,000 TFDE GasLog Shanghai 100% 2013 155,000 TFDE Hull 1947 100% 2013 155,000 TFDE Hull 2016 100% 2013 155,000 TFDE Hull 20172 100% 2013 155,000 TFDE Hull 2041 100% 2013 155,000 TFDE Hull 2042 100% 2014 155,000 TFDE Hull 2043 100% 2014 155,000 TFDE Hull 2044 100% 2015 155,000 TFDE Hull 2072 100% 2016 174,000 TFDE Hull 2073 100% 2016 174,000 TFDE 1.  Tri -fuel Diesel Electric. 2.  Hull 2017 has a seasonal charter for the last 5 years of its firm period (each Firm Charter Charterer Optional Period Under Discussions/Available year: 7 months on hire, and 5 months opportunity for GasLog to employ) n  In addition, GasLog controls options for 4 additional LNG carrier newbuildings, with expiration July 2013. 12  
  • 13.
       Summary   GasLog  is  paying  a  quarterly  dividend  of  $0.11  per  share  on  March  25,  2013.     Our   overall   performance   in   2012   provides   us   with   a   solid   plaporm   for   the   projected   growth  of  GasLog  in  2013  and  beyond.     2  newbuilds  at  Samsung  H.I.,  with  10  year  charters  to  BG  group,  announced  in  Q1-­‐2013.     GasLog  Shanghai  delivered  in  January  2013;  the  first  of  5  expected  deliveries  in  2013.       Con6nued  strong  fundamentals  for  the  LNG  industry.     GasLog’s  strengths  come  from:   •  Significant  contracted  revenues  from  credit-­‐worthy  counterparts.   •  A  strong  financial  posi6on  and  track  record  in  securing  funding.   •  A  young,  pure-­‐play  LNG  shipping  fleet  with  fuel-­‐efficient  technology.     •  An  experienced  technical  plaporm  delivering  strong  opera6onal  performance.     13  
  • 14.
       Annex  1  –  reconcilia6on  /  non-­‐GAAP  measures   Non-­‐GAAP  Financial  Measure     EBITDA  represents  earnings  before  interest  income  and  expense,  taxes,  deprecia6on  and  amor6za6on.  Adjusted  EBITDA  represents  EBITDA  before  gain/loss  on  interest  rate  swaps   and  net  foreign  exchange  gains/losses.  Adjusted  Profit/(loss)  and  Adjusted  EPS  represent  earnings  and  earnings  per  share,  respec6vely,  before  gain/loss  on  interest  rate  swaps  and   net   foreign   exchange   gains.   EBITDA,   Adjusted   EBITDA,   Adjusted   Profit/(loss)   and   Adjusted   EPS,   which   are   non-­‐GAAP   financial   measures,   are   used   as   supplemental   financial   measures   by   management   and   external   users   of   financial   statements,   such   as   investors,   to   assess   our   financial   and   opera6ng   performance.   We   believe   that   these   non-­‐GAAP   financial  measures  assist  our  management  and  investors  by  increasing  the  comparability  of  our  performance  from  period  to  period.  We  believe  that  including  EBITDA,  Adjusted   EBITDA,  Adjusted  Profit/(loss)  and  Adjusted  EPS  assists  our  management  and  investors  in  (i)  understanding  and  analyzing  the  results  of  our  opera6ng  and  business  performance,   (ii)  selec6ng  between  inves6ng  in  us  and  other  investment  alterna6ves  and  (iii)  monitoring  our  ongoing  financial  and  opera6onal  strength  in  assessing  whether  to  con6nue  to  hold   our   common   shares.   This   increased   comparability   is   achieved   by   excluding   the   poten6ally   disparate   effects   between   periods   of,   in   the   case   of   EBITDA   and   Adjusted   EBITDA,   interest,   taxes,   deprecia6on   and   amor6za6on   and,   and   in   the   case   of   Adjusted   EBITDA,   Adjusted   Profit/(loss)   and   Adjusted   EPS,   loss   on   interest   rate   swaps   and   net   foreign   exchange  gains/losses,  which  items  are  affected  by  various  and  possibly  changing  financing  methods,  capital  structure  and  historical  cost  basis  and  which  items  may  significantly   affect  results  of  opera6ons  between  periods.       EBITDA,  Adjusted  EBITDA,  Adjusted  Profit/(loss)  and  Adjusted  EPS  have  limita6ons  as  analy6cal  tools  and  should  not  be  considered  as  alterna6ves  to,  or  as  subs6tutes  for,  profit,   profit  from  opera6ons,  earnings  per  share  or  any  other  measure  of  financial  performance  presented  in  accordance  with  IFRS.  These  non-­‐GAAP  financial  measures  exclude  some,   but  not  all,  items  that  affect  profit,  and  these  measures  may  vary  among  companies.  In  evalua6ng  Adjusted  EBITDA,  Adjusted  Profit/(loss)  and  Adjusted  EPS,  you  should  be  aware   that  in  the  future  we  may  incur  expenses  that  are  the  same  as  or  similar  to  some  of  the  adjustments  in  this  presenta6on.  Our  presenta6on  of  Adjusted  EBITDA,  Adjusted  Profit/ (loss)  and  Adjusted  EPS  should  not  be  construed  as  an  inference  that  our  future  results  will  be  unaffected  by  the  excluded  items.  Therefore,  the  non-­‐GAAP  financial  measures  as   presented  below  may  not  be  comparable  to  similarly  6tled  measures  of  other  companies  in  the  shipping  or  other  industries.     14  
  • 15.
       Annex  1  -­‐  reconcilia6on  (cont.)   Reconciliation of EBITDA and Adjusted EBITDA to Profit/(loss) for the three and twelve month periods ended: (All amounts expressed in U.S. Dollars) For the three months ended For the year ended December 31, 2011 December 31, 2012 December 31, 2011 December 31, 2012 Profit/(loss) for the period (333,980) 2,677,888 13,722,678 4,220,819 Depreciation of fixed assets 3,214,646 3,291,587 12,827,284 13,064,898 Financial costs 2,683,756 2,822,665 9,631,262 11,669,562 Financial income (509) (249,237) (41,679) (1,174,361) EBITDA 5,563,913 8,542,903 36,139,545 27,780,918 Loss /(gain) on interest rate swaps, net 2,492,735 (209,832) 2,725,374 6,783,315 Foreign exchange gains, net (101,137) (713,734) (126,493) (546,791) Adjusted EBITDA 7,955,511 7,619,337 38,738,426 34,017,442 15  
  • 16.
       Annex  1  -­‐  reconcilia6on  (cont.)   Reconciliation of Adjusted Profit/(loss) to Profit/(loss) for the three and twelve month periods ended: (All amounts expressed in U.S. Dollars) For the three months ended For the year ended December 31, 2011 December 31, 2012 December 31, 2011 December 31, 2012 Profit/(loss) for the period (333,980) 2,677,888 13,722,678 4,220,819 Loss on interest rate swaps, net 2,492,735 (209,832) 2,725,374 6,783,315 Foreign exchange gains, net (101,137) (713,734) (126,493) (546,791) Adjusted Profit/(loss) 2,057,618 1,754,322 16,321,559 10,457,343 Non-controlling interest — — 316,973 — Adjusted Profit/(loss) attributable to owners of the Group 2,057,618 1,754,322 16,638,532 10,457,343 16  
  • 17.
       Annex  1  -­‐  reconcilia6on  (cont.)   Reconciliation of Adjusted Earnings Per Share to Earnings Per Share for the three months and the years ended December 31, 2011 and 2012: (All amounts expressed in U.S. Dollars) For the three months ended For the year ended December 31, 2011 December 31, 2012 December 31, 2011 December 31, 2012 Profit for the period attributable to owners of the Group (333,980) 2,677,888 14,039,651 4,220,819 Less: Earnings allocated to manager shares and subsidiary manager — 1,201,919 44,798 shares (25,709) Earnings attributable to the owners of common shares used in the 2,677,888 12,837,732 4,176,021 calculation of basic EPS (308,271) Weighted average number of shares outstanding 36,091,510 62,863,166 35,837,297 56,093,775 EPS (0.01) 0.04 0.36 0.07 Adjusted profit for the period attributable to owners of the Group 2,057,618 1,754,322 16,638,532 10,457,343 Less: Adjusted earnings allocated to manager shares and subsidiary 158,393 — 1,418,874 110,990 manager shares Adjusted earnings attributable to the owners of common shares used 1,899,225 1,754,322 15,219,658 10,346,353 in the calculation of basic EPS Weighted average number of shares outstanding 36,091,510 62,863,166 35,837,297 56,093,775 Adjusted EPS 0.05 0.03 0.42 0.18 17