
Recommended
More Related Content
Viewers also liked
Similar to 3D Digital Modeling for Urban Design + Planning
Similar to 3D Digital Modeling for Urban Design + Planning (20)
3D Digital Modeling for Urban Design + Planning
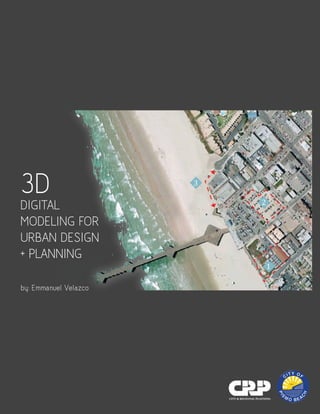
- 1. 3 1 2 3DDIGITAL MODELING FOR URBAN DESIGN + PLANNING by: Emmanuel Velazco
- 3. 3D Digital Modeling for Urban Design + Planning by Emmanuel Velazco Submitted to the Department of City and Regional Planning and the College of Architecture and Environmental Design in partial fulfillment of the requirements for the degree of Bachelor of Science in City and Regional Planning at the CALIFORNIA POLYTECHNIC STATE UNIVERSITY, SAN LUIS OBISPO June 2012 Advisor: Hemalata Dandekar City and Regional Planning Department Chair
- 5. Introduction About Google SketchUp Scope of Work Overview State and Local Efforts Funding Modeling Pismo Beach Modeling A Classic California Beach Town Developing A Land Use Map Existing Conditions and Land Uses Digital Photos Goals Benson Project Boardwalk Beachwalk Resort Challenges to Using Google Earth Presentation to the Planning Commission Project Lessons Technical Characteristics of an Affordable 3D Model Conclusion References Table of Contents 7 8 9 9 10 11 13 13 15 15 19 19 20 21 22 23 23 24 25 25 27
- 7. 7 As cities throughout the country face a number of challenges with the evolving development needs of the 21st century, city planning decisions should continue to adapt to these needs so as to benefit the social, environmental, political, and economic aspects of the city and it’s region. However, local, state, and federal governments are experiencing an economic downturn, which has made resources to plan for smarter development, attain greater public interest, and bring about economic revival, unavailable. This project seeks to address this planning scarcity and offer a tool which can assist a city in making good decisions about proposed development. The primary objective of this work is to introduce an innovative tool for city and regional planning using Google SketchUp 3D modeling to assess the impacts of various urban design projects that are proposed or approved with a city core. A second objective is to create a 3D model of an existing city, which can be updated, corrected, and augmented to allow for a visualization of proposed and approved additions. This model serves an additional benefit as it is a useful tool not only to study the impact of planned urban development, but also to engage the public and those interested in the city, to understand changes that are underway. It also serves to accommodate the needs of various stakeholders to visualize the consequences of changes and engage in deliberations and decisions in an informed fashion. Models created on Google SketchUp are able to bring together a greater understanding of the context and consequences of planned development between stakeholders, policy makers, technical planning staff and the concerned public. This senior project involved creating a 3-D model for the downtown of a small iconic “beach city”, Pismo Beach, INTRODUCTION
- 8. 8 and demonstrate its utility to the Planning Commission in making decisions about projects proposed to be developed in the downtown area. The attached DVD presents the central contribution of this project, providing: 1. The 3-D model of Downtown Pismo Beach 2. A fly-through animation to demonstrate how the model can be used 3. A video of the presentation to the Pismo Beach Planning Commission demonstrating how the model was used to assist policy makers in decisions related to project development This accompanying booklet provides an overview of the model building process and highlights aspects of the tools used and approaches taken in model creation. About Google SketchUp SketchUp is an application created by Google and is commonly used by architects and engineers to create 3D models of existing or proposed buildings. The program is flexible and allows placement of models within Google Earth and Google Maps, which allows the projects to be visualized within the context of its immediate surroundings and at the scale of the region. Google SketchUp is also compatible with other programs (3DOn, ArcGIS [with plugin by Google], Archicad [with plugin], Navisworks, Revit, Rhino, and Vectorworks [with plugin]), which enables professionals to develop more
- 9. 9 sophisticated and detailed renderings. Today, more than 350 million Internet users have turned to Google Earth to better understand and navigate their world and destinations. Viewers use the tool to observe their community from above, but also to consider street view and site context to plan a travel itinerary, or to look at a cityscape from a new, itegrative perspective. Scope of Work This report presents an overview of one successful attempt to use SketchUp, to illustrate a study of some critical beachfront sites and their impact on the quality of life and ambience of the city, and highlight the benefits of 3D modeling in this effort. The study was structured to lead the City of Pismo Beach to innovative decision-making based on the use of a downtown 3-D model to analyze the impact of three significant, large projects on the iconic beachfront. The study was organized under the direction of the City of Pismo’s Planning Department to explore the use of 3D modeling in assisting the City’s Planning Commission to make development decisions. Overview As supplemental to the traditional form of urban design representation, 3D Digital Modeling for Urban Design and Planning utilizes Google SketchUp as tool to visually identify current conditions of development and proactively engage the public in planning. Because the tool enables easier and cost–efficient ways to visualize different scenarios within the early design phases of projects, cities benefit from using
- 10. 10 a 3D model as concerns and conflicts can be understood in three dimensions and addressed earlier and more fully in the decision making process. Traditionally, the methods of formal representation for urban design have been 2-Dimensional (site plans, elevations, sections) and to some extent, 3-Dimensional (architectural rendering) allowing an visualization of some general massing surrounding the site. As visualization technology has advanced, an urban design process had involved a more expansive approach that precisely represents urban scale, the relationship with neighborhoods, buildings and districts, and the local character. In this study the City of Pismo Beach’s downtown-core has been modeled to demonstrate the potential of these new technologically advanced tools. The study illustrates the benefits of doing this and might serve to encourage, through illustration, the efforts of local governments and planning divisions to create 3D models of their town or cities. State and Local Efforts Google recently announced the development of 3D modeling for urban centers throughout a 50-mile stretch between San Francisco and San Jose. Cities that now have 3D facilities include Berkeley, Mountain View, Palo Alto, Oakland, Redwood City, Santa Clara, Santa Cruz, San Mateo, and Sunnyvale, according to Google’s SketchUp Blog. However, there are no known cities that have adopted 3D digital modeling as an official tool for urban design and planning practices. Most buildings found in UC Berkeley campus in 3D Googleplex in Mountain View, CA
- 11. 11 Google Warehouse or on Google Earth have been developed to detail the visual identity of existing buildings. Review and research of city websites revealed that the cities of Ventura and Chula Vista appear to be the only two cities in California to include 3D models as part of the geographical information systems that are available for review by the public. As of 2006, the City of Ventura had created building blocks within the Downtown Ventura Redevelopment Area and has made this model available to anyone to download and view on Google Earth. The city has since not updated the file and the model remains as blocks providing no detailed facades or other design-relevant information. The City of Chula Vista has included on their website a 3D Modeling Program, under Information and Technology Services, to engage citizens in future planning projects. Chula Vista has expressed an interest in partnering with Google to hold a community workshop to provide additional information and training for anyone interested in modeling the City. The program is currently lead by volunteers, but is not fully integrated as a planning decision tool or service within the planning department. Funding Funding for 3D modeling is varied but some of the software for this is relatively inexpensive, as SketchUp offers a free downloadable version. In addition to State and Federal funding, cities may apply to receive grants from Google Earth Outreach, which supports nonprofit organizations to utilize “Pro” versions of Google Earth and SketchUp. The Pro version City of Chula Vista City Hall City of Ventura’s model (limited detail on Google Earth)
- 12. 12 of Google Earth extends the capabilities with additional features including GIS data, and parcel layers. SketchUp Pro offers users additional functionality, such as interoperability with other 3D software packages and sophisticated rendering systems (V-Ray). One bottleneck to a significant adoption of the tool might be that investments in developing appropriate 3-D modeling skills on the part of staff are needed. The concept of adopting 3D strategies for local planning is a new and revolutionary idea. If it is to be adopted broadly as a decision making tool, it may need to be formalized so as to be included in General Plans and other guiding documents. Many state programs have provided technical assistance or funding support for the development of “sustainable” communities, such as the Department of Conservation’s Emerald Cities Program, the Governor’s Office of Planning and Research’s General Plan Guideline, and the Institute for Local Governments. Cities could actively seek for support of integrating 3D digital modeling as a tool that assists in developing “sustainability” – social, economic and technical.
- 13. 13 The idea of creating a 3D digital model of downtown Pismo Beach began in Fall 2011 as a way to help the city understand the potential impact of new and existing projects. The City of Pismo Beach is located mid-way between Los Angeles and San Francisco with a population of approximately 8,600. The city is more commonly known for its recreation and tourism, and is often referenced as the “classic California surf beach-town.” Because Pismo Beach has maintained a distinct local character, 3D digital model was created to insert recently approved projects as a way to assess their impact on the city and to serve as an example of how a 3-D model can be a useful tool in the effort to make a good fit of new projects with the existing fabric of the city. Modeling A Classic California Beach Town In developing a 3D model of Downtown Pismo Beach, the City has recognized it as an opportunity to better engage and inform the public of future development. The Planning Department has the ability to reference and showcase the model during the Planning Commission meetings to establish mutual understanding of site locations, parcels, streets, buildings, and other pertinent information. The model has also brought forth data not otherwise available, such as the alignment of built features in the city, with respect to each other or with natural features. It has allowed the public greater access to, and understanding of, the development of the city. Such data further illustrates the character of downtown MODELING PISMO BEACH Downtown Pismo Beach viewed from the pier Pismo Beach iconic sign near Downtown entrance Aerial view of Pismo Beach
- 14. 14 Pismo Beach and facilitates the planning process for growth and development. Specifically, 3D modeling assists in the following tasks: • Enable professional designers to look at proposed designs in context with more complete elevations, walk-thru, and visual animation, • Communicate/display to the public, who may be impacted about the decisions made by the Planning Department and City Council, • Manipulate the design and demonstrate impacts on site lines, views, aesthetics, etc. and • Provide a tool to decision makers to enable them to - Visually foresee opportunities - Arbitrate or decide on better, more compelling designs - Request additional options In creating a 3D model of Pismo Beach using SketchUp, two tasks were performed prior to developing an accurately scaled model. They were: 1.Developing a map of exiting land uses 2. Taking digital pictures of the building or structure on all sides of the buildings to assure accuracy in scaling PizMo Pizza Parlor in Downtown Chele’s Restaurant
- 15. 15 Developing A Land Use Map Developing a map of existing land uses is useful to understand specifications and restrictions that apply to a given parcel of land. Many cities and towns have established guidelines and/ or standards for land use, building height, and density that supports a strategic balance of development. In working with a map of existing land uses, planners and designers may develop the model to show individual parcels at maximum and/ or minimum height. In doing so, planners and city council members are able to review the model and address concerns accordingly. This is especially important for cities and towns striving to maintain a small-scale environment or preserving views, dependent on elevation and/or buildings and structures. In attaining a current land use map, planners and urban designers may raise existing and non-existing buildings within each parcel to the allowable building height. This enables viewers to see how the city or town would feel and look at if all parcels are developed to their full, allowable potential. Typically, a general massing can be performed to get an approximate idea of full build out. Existing Conditions & Land Uses The existing conditions of downtown Pismo Beach reflect the tourist-driven nature of the city economy. The study area consists of about six blocks between Main Street and Hinds Bowling in Downtown Pismo Beach Harry’s Nightclub and Beach Bar near the Pier
- 16. 16 Avenue, and the beach and Price Street. Highway 101 and Highway 1 parallel each other through Pismo Beach. Pacific Coast Highway 1 (PCH) travels through the study area and Highway 101 is nearby to the East. The city block directly across from the pier is predominantly a parking area consisting of a paved paid parking and a dirt lot, which is available for parking free of charge. Currently, a mixed- use (retail and condominiums) project has been approved for development in the area of the dirt lot. The buildings surrounding the parking are predominantly commercial buildings of one-to-three stories. The occupying businesses are local “mom and pop” shops with very few national, chain or franchised stores. Surf shops, restaurants, cafes, hotels, and souvenir shops can be found throughout the commercial area, and contribute greatly to the character of Pismo Beach. East of PCH (also named Dolliver Street in the project area) contains most of residential parcels in the project area; with a mixture of single-family homes, town-homes, and apartments. Many of the multi-unit developments are vacation or part-time rental units. Residential beachfront units can be found on the outer edge of the project area on Hinds Avenue and Main Street. The only public building is the Chamber of Commerce on Hinds Avenue and Dolliver Street. There are public restrooms and showers on the pier boardwalk. Another feature in the study area is a few parcels that act as alleyways or paved access into a block. There are two undeveloped parcels in the study area; both located on the east side of Price Street. Refer to Map 1, which illustrates Pismo Beach’s existing land-uses.
- 17. 17Map 1.1 - Existing Land Uses
- 19. 19 Digital Photos SketchUpallowsuserstocreatebuildingdesignsusingtheactual, real-world scale (a scale of 1:1 where a unit of measurement in SketchUp represents that actual unit of measurement in the real world). In the effort to create the most accurate model, in both design and physical scale, SketchUp enables users to match photos to buildings and structures for precise representation. The more photos taken, the better accuracy rates designers will have. Taking photographs of city buildings and structures also compliments the development of an up-to-date land use map. Goals The goal for Pismo Beach was to develop models of existing buildings with precise scaling and to also incorporate recently approved projects. The purpose of this was to give the planning commission a sense of future development. There are three city-approved projects that were modeled and incorporated. First was the Benson Project, the second the extension of the “boardwalk,” and the third was the Beachwalk Resort. Streetview on Pomeroy and Cypress Street Restaurant and Boardwalk adjacent to Pismo Mall
- 20. 20 The Benson project, approved by the City in 2006, The Pismo Pierside Plaza is a proposed mixed-use building comprised of three levels. The ground floor will include approximately 28,000 square feet of retail. The underground level will have 126 parking spaces, with 11 luxury condominiums on top. Property: Lot size 53,500 square feet, located at 601 Cypress Street Zoning: C-1 allows for mixed use, hotel, or retail development Parking: Private parking area for condominium owners. Pierside Plaza (Benson Project) Current Architect's Rendering 1 Current dirt lot temporarily used for parking Rendering offers detail, but no relationship with the existing buildings The Benson Project placed in the designated with elevation views and in relation to surrounding buildings
- 21. 21 The Boardwalk The extension of the boardwalk connects the pedestrian flow from Ocean View Avenue to Main Street. In modeling the beachfront boardwalk, texture and fabric was given as an example to showcase an alternative form of detail. Current SketchUp Model 2 Boardwalk to connect North and South of the Pier Visual connection with extention to Pierside Mall View of the proposed Boardwalk with Street and building alignment
- 22. 22 As approved by the City of Pismo Beach, the project involved demolition of 13 small rental cabins and a 7,000 square foot vacant building, and the construction of a 77,585 square foot, three story, 67-room ocean front hotel, with underground parking and a caisson/piling foundation. In modeling the Beachwalk Resort, general massing was used as another options for cities planners and designers to display urban development. Beachwalk Resort Current Architect's Rendering SketchUp Massing 3 Bungalows south of Downtown Proposed resort, with no visualization of surrounding buildings General Massing of Downtown with view of the Resort in place of 12’ bungalows
- 23. 23 Challenges to Using Google Earth Modeling for insertion in Google Earth can be challenging because it is considerably different than 3D modeling for architectural projects or to achieve professionally rendered scenes. Since Google Earth is an online interactive browser, 3D program models must be optimized for fast download and for good computer performance. Additionally, since the goal is to view a full city worth of models at a time, models must coincide with the big picture, and therefore portray only enough detail essential for analysis and comparisons. Presentation to the Planning Commission After completing the 3-D model of the three proposed and approved projects in downtown Pismo Beach and placing them in SketchUp, the downtown model was presented to the public and city council for review, questions, comments and concerns. Throughout the presentation, the model was displayed in relation to existing conditions and scale, including a walk-thru, Google Earth visualization, and animation. At the conclusion of the presentation, the City Council and public discussed the projects and remarked on the benefits of 3D model for their decision-making process. One of the more appreciated features of the model was seeing before and after shots, massing, and the ease to develop new projects. The success of the model further encouraged the Planning department to develop additional models of the surrounding The 2011 Planning Commission meeting 3D model placed on Google Earth with topography
- 24. 24 areas and throughout the City. The public also provided positive feedback, with excitement to see their area of interest as a model. * See attached DVD file Planning Commission for a video recording of the presentation. Project Lessons The successful use of 3-D modeling in the City of Pismo Beach to help policy makers and residents understand and discuss developments in the downtown core and make sound decisions that was enabled by this project provides some evidence of how a 3-D modeling tool might be used by other cities seeking to preserve the character of their downtowns. This document seeks to convince local and regional policy makers to explore including the practice of 3D modeling as a tool for urban design and planning. Cities and towns may find this document useful during the transition of creating a 3D digital model of their city or town on Google SketchUp, as it provides instruction and links to more technical information for successful completion and general use of the model. Implementation of 3D Digital Modeling can help cities and towns understand the issues that various communities face regarding urban form, local character and design. As communities work to establish appropriate long-term goals and meet objectives, officials may find this tool useful in reaching their city plan goals. Main thoroughfare to downtown on Pomeroy Avenue Shops on Dolliver Street/Pacific Coast Highway
- 25. 25 Technical Characteristics of an Affordable 3-D Model This project identified some technical characteristics that make for a successful 3-D model that assists in planning decisions. These may be useful for cities that seek to develop an affordable, general planning model to aid decisions. They include: 1. Avoid being too detailed with buildings 2. Represent only the important aspects (i.e. massing, particular characteristics, front facades) 3. Let texture images show most of the details (if applied) 4. Small files are crucial in the overall process 5. Make it appealing (trees, people, etc.) 6. Maintain accuracy in scale and location Conclusion The City of Pismo Beach is continuing its efforts in effective and strategic planning to maintain it’s historic character of a Classic California Beach Town. With the 3D model, the Planning Division and Commission can use this tool as a way to assess future developments for fit and compatibility. As of now, the model consists of the downtown commercial-core, with the ability to include additional models of other areas within the incorporated municipality, such as the Village at Shell Beach. The 3-D model presents an innovative tool for planning and design practice. Cities today have faced severe budget constraints, which has forced and restricted the ability to provide for a more detailed visualization of existing conditions Cypress Street and Main Street Beachfront overlooking downtown commercial core
- 26. 26 and future development. Such assessments in the context of the region, and it’s natural and man-made features, is essential if the unique characteristics of particular places are to be preserved and enhanced. The 3-D modeling exercise which was the key element of this project made a small contribution to this effort in enabling the Planning Commission of the City of Pismo Beach to make sound decisions about development projects in its iconic water front. It provides a case illustration that might be useful to other cities contemplating innovative use and application of this tool.
- 27. 27 References 1. Google Sketch-Up Support: http://support.google.com/sketchup/bin/answer.py?hl=en&answer=94919 2. 3D Modeling SketchUp: http://sketchup.google.com/3dwh/citiesin3d/westport.html 3. Pismo Beach Images: http://www.classiccalifornia.com/images/calif_pismo_map.jpg 4. Pismo Beach Images: http://www.flickr.com/photos/brianjmatis/6820952563/sizes/o/in/ photostream/ 5. City of Hillsboro: http://www.ci.hillsboro.or.us/Planning/htmlzonevol2/ ZORD2Section137.X.aspx 6. Google Maps: http://maps.google.com 7. Google SketchUp Blog: http://sketchupdate.blogspot.com/ 8. ESRI CityEngine: http://www.esri.com/software/cityengine/index.html 9. Satellite Imaging Corporation: http://www.satimagingcorp.com/svc/3d-city-and-urban-modeling.html