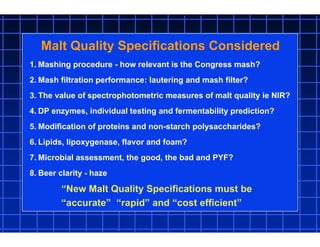
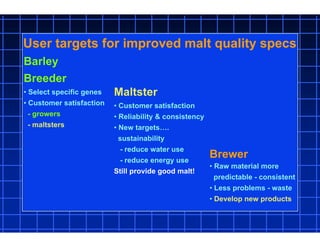
Modernization of malt quality analysis to
better inform brewers, maltsters and
barley breeders - functional tests and
future opportunities
Dr Evan Evans
School of Plant Science
University of Tasmania
Australia
Australian Barley Biochemistry & Brewing Research
Barley Malting Quality … from Grass to Glass.
Introduction
• If it is not malting quality it is feed!
Big $ implications for grower profits - gross margins
• Malting quality specifications are the basis commercial
transactions in the malt quality value chain
• Good malt quality reduces maltster and brewer risk - $ premiums
Grower Grain trader Maltster Brewer
How accurately do current
malt quality specifications predict malt quality?
What is the malt quality risk premium? Can we lower it?
$$$
$$$
Lower risk
Higher risk
What does the brewer really want to know?
• How much does it cost?
• How consistent & predictable is the malt quality?
• How much beer will a tonne of malt make?
• Will there be any brewing/fermenting difficulties (ie PYF)?
• Will there be any production difficulties (ie lautering, filtration)?
• Will the beer quality match specifications (ie color, foam, flavor)?
A Typical Malt Quality Specification Report
“Functional” Malt Quality Specifications: Barry Axcell, SABMiller
1. Mashing procedure - how relevant is the Congress mash?
2. Mash filtration performance: lautering and mash filter?
3. The value of spectrophotometric measures of malt quality ie NIR?
4. DP enzymes, individual testing and fermentability prediction?
5. Modification of proteins and non-starch polysaccharides?
6. Lipids, lipoxygenase, flavor and foam?
7. Microbial assessment, the good, the bad and PYF?
8. Beer clarity - haze
Malt Quality Specifications Considered
“New Malt Quality Specifications must be
“accurate” “rapid” and “cost efficient”
Mashing Procedure?
Extract, KI, Color, WBG, AAL, FAN…
How relevant is the
Congress mash?
Congress vs modern commercial mashes
The influence of mash in
temperature on AAL and
sugar composition
5.7%
Grist grinding - disc mill vs 6 roller mill
Conclusion: Brewers consider 0.7mm grind “closer”
to reality
6 roller mill Disc mill with setting:
Commercial
grist
0.2 mm
grind
0.7 mm
grind
1.0 mm
grind
Sieve Proportions
1.25 mm 46.4% 2.1% 9.8% 27.2%
1.0 mm 8.5% 1.8% 14.6% 20.2%
0.50 mm 16.4% 9.1% 41.5% 24.1%
0.25 mm 9.5% 37.9% 13.0% 9.7%
0.125 mm 6.0% 17.1% 6.5% 5.2%
Pan 13.3% 32.1% 14.6% 13.7%
Grist Milling
Mash in 65°C 50 min,
1:4 ratio, finish 74°C,
0.22mM CaSO4
Conclusion:
Substantial impact,
select 0.7mm as closer
to brewers reality
Grist to water ratio
Mash in 65°C 50 min,
0.7mm grind, finish 74°C
0.22-0.3 mM CaSO4
Conclusion:
Grist : water important,
choose 1:3 as closer to
commercial practice
Mash duration
Mash in 65°C, 1:3 ratio
0.7mm grind, finish 74°C
0.3 mM CaSO4
Conclusion:
Mash duration important.
use 60min as this gives
close to max fermentability
and same as IoB protocol
Mashing protocol comparison summary
Comparison Congress and Final 65°C protocols
n= 29, * LSD (P<0.05) calculated upon duplicate samples of a selection of nine of the malt samples
Extract and AAL Comparison (n=29):
Congress and Final 65°C Protocols
MLR - AAL comparison of mashing protocols
Mash filtration performance:
lautering and mash filters?
As simple 25min test of lautering performance
A bolt on to mash extract evaluation
As simple 25min test of lautering performance
A bolt on to mash extract evaluation
The Value of Spectrophotometric
Measures of Malt Quality?
Such as NIR and IR
• NIR regularly used for grain/malt protein and moisture - good accuracy
• Wort and alcohol in beer (ie Anton Paar Alcolyzer - very accurate)
• Breeders use for culling of inferior lines for:
- whole grain (barley - ads and limits) vs whole malt
- extract
- DP/ -amylase
- -glucan / viscosity
- FAN and soluble protein
- parameters such as husk content and grain color
- LOX?
Spectrophotometric Measures of Malt Quality
Future?
• NIR and image analysis?
• IR combined with statistical evaluation - new opportunities?
- Lipids in wort?
• Other components?
DP Enzymes,
Individual Testing
and Fermentability Prediction?
-amylase,
-amylase, limit dextrinase
(thermostability LD and -amylase)
ß-amylase
limit dextrinase
-amylase Reducing
end
-glucosidase
Starch is degraded by the four
diastase enzymes
20151050
0
20
40
60
80
100
Sd1
Sd2-H
Sd2-L
Sd3
Time (min)
Residualactivity(%)
Relative Rates of Irreversible Thermal Inactivation
of ß-amylase in Barley Extracts at 60 °C
Sd2L: low -amylase
thermostability ie Schooner
Sd1: intermediate -amylase
thermostability, ie Baudin,
Gairdner AC Metcalfe,
Harrington, Morex
Sd2H: high -amylase
thermostability, ie Buloke,
Flagship,Haruna nijo.
82807876
0
10
20
30
40
Fermentability (AAL %)
84828078
40
60
80
100
120
Sd1
Sd2-H
Sd2-L
Fermentability (AAL%)
Sd1
Sd2-H
Sd2-L
DP (oL)
Residual
-amylase
Actvity (%)
Relationship between -amylase thermostability
and wort fermentability in 42 commercial samples
( Extracted from Eglinton et al., 1998)
2 % point AAL
advantage for
Sd2H varieties
Evans et al., 2005, J. Am. Soc. Brew. Chem. 63:185-198
AAL = 69.9 + 0.017*a + 9.60*b + 0.195*c + 0.007*d + 0.538e - 0.001*d*e
r2 = 0.91
Parameters DP Enzyme MLR (multi linear regression):
a = -Amylase activity,
b = Total limit dextrinase activity
c = KI (%)
d = Total -amylase activity
e = -Amylase thermostability (%)
Predicting AAL from malt characteristics
Case study 1:
Commercial brewery fermentability variability
explained by DP enzymes
Commercial brewery fermentability variability
explained by DP enzyme levels: Case study 2
An Improved malt description
Impact of Blending on Fermentability
variety
Sd
type
b-amy
%Therm
b-amy
(U/g dw)
a-amy
(U/g dw)
LD
(U/kg dw)
LD
%Therm
b-glucanase
(U/kg dw)
KI DP
Total
Protein
Baudin Sd1 4.9 707 177 334 54.8 364 48.0 453 11.8
Schooner Sd2L 0.7 350 165 318 47.4 118 48.3 184 11.0
Flagship Sd2H 16.3 537 208 323 54.2 293 46.0 365 11.2
Schooner Sd2L 0.7 350 165 318 47.4 118 48.3 184 11.0
Combined testing of
DP enzymes by
MegaZyme assays
• Ceralpha
• Betamyl
• Limit DextriZyme
See: Evans, D.E., (2008)
Journal American Society of Brewing Chemists,
66:215-222
Further development - Use of robots?
Lipids, Lipoxygenase,
Flavor and Foam?
Lipoxygenase (LOX 1 and LOX2)
• Production of off flavours - beer flavour stability reduced
• Production of lipid hydroperoxides - beer foam stabilty reduced
• Lipoxygenase 1 null lines: Sapporo, Carlsberg-Heineken
Lipids, Lipoxygenase … Flavor and Foam
Lipids
• Substrate for lipoxygenase (linoleic acid C18:2)
• Required for yeast viability and vitality
• Can reduce beer foam and flavour stability
Impact of mash in temperature on wort lipids: B.
Comparison of the fatty acid content & composition of the wort
produced by the Final 65°C mashing protocol for 12 Gairdner malts
and the original 8 varieties
Modification of proteins
and non-starch polysaccharides?
KI, FAN, wort -glucan, viscosity
Beer filtration (AAL and foam)
Proteins and proteases
• Provision of FAN for yeast nutrition
• Some proteins impact lautering and beer filtration (gel proteins?)
• Some proteins valuable for foam stability (protein Z, LTP1 etc)
Modification of proteins and non-starch polysaccharides
Non-starch polysaccharides and viscosity
• -glucan and arabinoxylan (if large) viscosity …. Lautering filtration
cross-flow filtration!
• Source of fermentable extract (glucose)?
• Soluble fibre (size - not too big, not too small)?
variety
Sd
type
b-amy
%Therm
b-amy
(U/g dw)
a-amy
(U/g dw)
LD
(U/kg dw)
LD
%Therm
b-glucanase
(U/kg dw)
KI DP
Total
Protein
Buloke Sd2H 14.7 823 251 450 55.8 523 47.6 383 10.7
Gairdner Sd1 4.4 520 182 383 53.6 414 43.7 276 10.2
Buloke Sd2H 14.7 823 251 450 55.8 523 47.6 383 10.7
Schooner Sd2L 0.7 350 165 318 47.4 118 48.3 184 11.0
BulokeBuloke
Microbial assessment,
the good, the bad and PYF?
Microbes - more good than bad?
• We tend to focus on the bad, PYF, taints, gushing, toxins
However!
• Will not exclude as barley and malt is not sterile
• Produce beneficial enzymes, hormones
• Some may exclude harmful microbes
• Future: DNA - PCR testing for specific taxa?
Further discussion: Laitila A, More good than bad: microbes in the maltings.
Brewer & Distiller International, 2008, 4(8):52-54.
PYF
• Premature yeast flocculation (PYF) is an intermittent
fermentation problem.
• PYF results in incomplete wort fermentation.
• PYF occurrence appears to be related to certain malt
batches.
• However detection of problem batches is problematic
• Is a significant problem for some breweries.
See for further:
Evans, D.E. and Kaur, M. (2009) Keeping “Sleepy” Yeast Awake Until “Bedtime”:
Understanding and avoiding PYF The Brewer and Distiller International 5(5): 38-40.
The impact of PYF on fermentation
After van Nierop 2005 Thesis
TRFLP HaeIII chromatogram of suspected primary PYF malt
HAEIII HAEIII
Beer clarity - haze?
Genetic solution or assistance?
Silica Eluate (SE) Immunodetection
Barley
kDa
98
64
50
36
30
16
6
HarringtonBarley
StirlingBarley
LuberonBarley
AnnabellBarley
PasadenaBarley
PrestigeBarley
RicardaBarley
ChaliceBarley
JerseyBarley
BriseBarley
StirlingMalt
UnicornMalt
CommercialLager
UnicornBeer
StirlingBeer
Haze
Haze
kDa
98
64
50
36
30
16
6
kDa
98
64
50
36
30
16
6
kDa
98
64
50
36
30
16
6
Malt Beer Haze
Overall Classification of Varieties
SE -ve
varieties
17%
SE +ve
varieties
83%
SE +ve
Examples
Alexis
Arapiles
Baudin
Dhow
Franklin
Gairdner
Manley
Metcalfe
Optic
Scarlett
Schooner
Sloop
Steptoe
Triumph
SE -ve
Examples
Annabell
Barke
Bowman
Excel
Harrington
Haruna Nijo
Kustaa
Landlord
Moravian III
Morex
Pirkka
Robust
Saana
Unicorn
219 varieties were screened - 181 were identified as SE +ve,
while only 38 were identified as SE –ve.
Pilot Brewing Haze Stability Trial
55ºC Force Test
0
2
4
6
8
10
12
Unicorn
Harrington
Stiring
Schooner
Franklin
Gairdner
Variety
EBC
Haze
Units
SE (-)
SE (+)
The colloidal stability of beer produced from 6 (50L) pilot brewing trials with
the Tooheys chill haze force test (5 day 55oC/ 1 day 0oC).
Pilot brewing trial Sydney 2000 (50L)
Recent Novel Beer Haze Proteins?
(Iimure et al. 2008, J. Cereal Sci. Sapporo, Japan)
Haze growth factors (proteomics approach)
• Barley dimeric -amylase inhibitor (BDAI-I)
• BTI-CMb
• BTI-CMe
See also:
Robinson, et al. (2007) Journal of Cereal Science, 45:335-342 and 343-352.
Brewer
• Raw material more
predictable - consistent
• Less problems - waste
• Develop new products
User targets for improved malt quality specs
Maltster
• Customer satisfaction
• Reliability & consistency
• New targets….
sustainability
- reduce water use
- reduce energy use
Still provide good malt!
Barley
Breeder
• Select specific genes
• Customer satisfaction
- growers
- maltsters
Co-authors
Brian Rossnagel, Alex Speers, Mike Edney,
Sophie Roumeliotis
Assistance:
Very many people!
Funding:
Grains Research and Development Corporation,
Grant: UT 00017.
Acknowledgments
36 evans

36 evans

  • 1.
    Modernization of maltquality analysis to better inform brewers, maltsters and barley breeders - functional tests and future opportunities Dr Evan Evans School of Plant Science University of Tasmania Australia Australian Barley Biochemistry & Brewing Research Barley Malting Quality … from Grass to Glass.
  • 2.
    Introduction • If itis not malting quality it is feed! Big $ implications for grower profits - gross margins • Malting quality specifications are the basis commercial transactions in the malt quality value chain • Good malt quality reduces maltster and brewer risk - $ premiums Grower Grain trader Maltster Brewer How accurately do current malt quality specifications predict malt quality? What is the malt quality risk premium? Can we lower it? $$$ $$$ Lower risk Higher risk
  • 3.
    What does thebrewer really want to know? • How much does it cost? • How consistent & predictable is the malt quality? • How much beer will a tonne of malt make? • Will there be any brewing/fermenting difficulties (ie PYF)? • Will there be any production difficulties (ie lautering, filtration)? • Will the beer quality match specifications (ie color, foam, flavor)? A Typical Malt Quality Specification Report “Functional” Malt Quality Specifications: Barry Axcell, SABMiller
  • 4.
    1. Mashing procedure- how relevant is the Congress mash? 2. Mash filtration performance: lautering and mash filter? 3. The value of spectrophotometric measures of malt quality ie NIR? 4. DP enzymes, individual testing and fermentability prediction? 5. Modification of proteins and non-starch polysaccharides? 6. Lipids, lipoxygenase, flavor and foam? 7. Microbial assessment, the good, the bad and PYF? 8. Beer clarity - haze Malt Quality Specifications Considered “New Malt Quality Specifications must be “accurate” “rapid” and “cost efficient”
  • 5.
    Mashing Procedure? Extract, KI,Color, WBG, AAL, FAN… How relevant is the Congress mash?
  • 6.
    Congress vs moderncommercial mashes
  • 7.
    The influence ofmash in temperature on AAL and sugar composition 5.7%
  • 8.
    Grist grinding -disc mill vs 6 roller mill Conclusion: Brewers consider 0.7mm grind “closer” to reality 6 roller mill Disc mill with setting: Commercial grist 0.2 mm grind 0.7 mm grind 1.0 mm grind Sieve Proportions 1.25 mm 46.4% 2.1% 9.8% 27.2% 1.0 mm 8.5% 1.8% 14.6% 20.2% 0.50 mm 16.4% 9.1% 41.5% 24.1% 0.25 mm 9.5% 37.9% 13.0% 9.7% 0.125 mm 6.0% 17.1% 6.5% 5.2% Pan 13.3% 32.1% 14.6% 13.7%
  • 9.
    Grist Milling Mash in65°C 50 min, 1:4 ratio, finish 74°C, 0.22mM CaSO4 Conclusion: Substantial impact, select 0.7mm as closer to brewers reality
  • 10.
    Grist to waterratio Mash in 65°C 50 min, 0.7mm grind, finish 74°C 0.22-0.3 mM CaSO4 Conclusion: Grist : water important, choose 1:3 as closer to commercial practice
  • 11.
    Mash duration Mash in65°C, 1:3 ratio 0.7mm grind, finish 74°C 0.3 mM CaSO4 Conclusion: Mash duration important. use 60min as this gives close to max fermentability and same as IoB protocol
  • 12.
  • 13.
    Comparison Congress andFinal 65°C protocols n= 29, * LSD (P<0.05) calculated upon duplicate samples of a selection of nine of the malt samples
  • 14.
    Extract and AALComparison (n=29): Congress and Final 65°C Protocols
  • 15.
    MLR - AALcomparison of mashing protocols
  • 16.
  • 17.
    As simple 25mintest of lautering performance A bolt on to mash extract evaluation
  • 18.
    As simple 25mintest of lautering performance A bolt on to mash extract evaluation
  • 19.
    The Value ofSpectrophotometric Measures of Malt Quality? Such as NIR and IR
  • 20.
    • NIR regularlyused for grain/malt protein and moisture - good accuracy • Wort and alcohol in beer (ie Anton Paar Alcolyzer - very accurate) • Breeders use for culling of inferior lines for: - whole grain (barley - ads and limits) vs whole malt - extract - DP/ -amylase - -glucan / viscosity - FAN and soluble protein - parameters such as husk content and grain color - LOX? Spectrophotometric Measures of Malt Quality Future? • NIR and image analysis? • IR combined with statistical evaluation - new opportunities? - Lipids in wort? • Other components?
  • 21.
    DP Enzymes, Individual Testing andFermentability Prediction? -amylase, -amylase, limit dextrinase (thermostability LD and -amylase)
  • 22.
  • 23.
    20151050 0 20 40 60 80 100 Sd1 Sd2-H Sd2-L Sd3 Time (min) Residualactivity(%) Relative Ratesof Irreversible Thermal Inactivation of ß-amylase in Barley Extracts at 60 °C Sd2L: low -amylase thermostability ie Schooner Sd1: intermediate -amylase thermostability, ie Baudin, Gairdner AC Metcalfe, Harrington, Morex Sd2H: high -amylase thermostability, ie Buloke, Flagship,Haruna nijo.
  • 24.
    82807876 0 10 20 30 40 Fermentability (AAL %) 84828078 40 60 80 100 120 Sd1 Sd2-H Sd2-L Fermentability(AAL%) Sd1 Sd2-H Sd2-L DP (oL) Residual -amylase Actvity (%) Relationship between -amylase thermostability and wort fermentability in 42 commercial samples ( Extracted from Eglinton et al., 1998) 2 % point AAL advantage for Sd2H varieties
  • 25.
    Evans et al.,2005, J. Am. Soc. Brew. Chem. 63:185-198 AAL = 69.9 + 0.017*a + 9.60*b + 0.195*c + 0.007*d + 0.538e - 0.001*d*e r2 = 0.91 Parameters DP Enzyme MLR (multi linear regression): a = -Amylase activity, b = Total limit dextrinase activity c = KI (%) d = Total -amylase activity e = -Amylase thermostability (%) Predicting AAL from malt characteristics
  • 26.
    Case study 1: Commercialbrewery fermentability variability explained by DP enzymes
  • 27.
    Commercial brewery fermentabilityvariability explained by DP enzyme levels: Case study 2
  • 28.
    An Improved maltdescription
  • 29.
    Impact of Blendingon Fermentability variety Sd type b-amy %Therm b-amy (U/g dw) a-amy (U/g dw) LD (U/kg dw) LD %Therm b-glucanase (U/kg dw) KI DP Total Protein Baudin Sd1 4.9 707 177 334 54.8 364 48.0 453 11.8 Schooner Sd2L 0.7 350 165 318 47.4 118 48.3 184 11.0 Flagship Sd2H 16.3 537 208 323 54.2 293 46.0 365 11.2 Schooner Sd2L 0.7 350 165 318 47.4 118 48.3 184 11.0
  • 30.
    Combined testing of DPenzymes by MegaZyme assays • Ceralpha • Betamyl • Limit DextriZyme See: Evans, D.E., (2008) Journal American Society of Brewing Chemists, 66:215-222
  • 31.
    Further development -Use of robots?
  • 32.
  • 33.
    Lipoxygenase (LOX 1and LOX2) • Production of off flavours - beer flavour stability reduced • Production of lipid hydroperoxides - beer foam stabilty reduced • Lipoxygenase 1 null lines: Sapporo, Carlsberg-Heineken Lipids, Lipoxygenase … Flavor and Foam Lipids • Substrate for lipoxygenase (linoleic acid C18:2) • Required for yeast viability and vitality • Can reduce beer foam and flavour stability
  • 34.
    Impact of mashin temperature on wort lipids: B.
  • 35.
    Comparison of thefatty acid content & composition of the wort produced by the Final 65°C mashing protocol for 12 Gairdner malts and the original 8 varieties
  • 36.
    Modification of proteins andnon-starch polysaccharides? KI, FAN, wort -glucan, viscosity Beer filtration (AAL and foam)
  • 37.
    Proteins and proteases •Provision of FAN for yeast nutrition • Some proteins impact lautering and beer filtration (gel proteins?) • Some proteins valuable for foam stability (protein Z, LTP1 etc) Modification of proteins and non-starch polysaccharides Non-starch polysaccharides and viscosity • -glucan and arabinoxylan (if large) viscosity …. Lautering filtration cross-flow filtration! • Source of fermentable extract (glucose)? • Soluble fibre (size - not too big, not too small)?
  • 38.
    variety Sd type b-amy %Therm b-amy (U/g dw) a-amy (U/g dw) LD (U/kgdw) LD %Therm b-glucanase (U/kg dw) KI DP Total Protein Buloke Sd2H 14.7 823 251 450 55.8 523 47.6 383 10.7 Gairdner Sd1 4.4 520 182 383 53.6 414 43.7 276 10.2 Buloke Sd2H 14.7 823 251 450 55.8 523 47.6 383 10.7 Schooner Sd2L 0.7 350 165 318 47.4 118 48.3 184 11.0 BulokeBuloke
  • 39.
  • 40.
    Microbes - moregood than bad? • We tend to focus on the bad, PYF, taints, gushing, toxins However! • Will not exclude as barley and malt is not sterile • Produce beneficial enzymes, hormones • Some may exclude harmful microbes • Future: DNA - PCR testing for specific taxa? Further discussion: Laitila A, More good than bad: microbes in the maltings. Brewer & Distiller International, 2008, 4(8):52-54.
  • 41.
    PYF • Premature yeastflocculation (PYF) is an intermittent fermentation problem. • PYF results in incomplete wort fermentation. • PYF occurrence appears to be related to certain malt batches. • However detection of problem batches is problematic • Is a significant problem for some breweries. See for further: Evans, D.E. and Kaur, M. (2009) Keeping “Sleepy” Yeast Awake Until “Bedtime”: Understanding and avoiding PYF The Brewer and Distiller International 5(5): 38-40.
  • 42.
    The impact ofPYF on fermentation After van Nierop 2005 Thesis
  • 43.
    TRFLP HaeIII chromatogramof suspected primary PYF malt HAEIII HAEIII
  • 44.
    Beer clarity -haze? Genetic solution or assistance?
  • 45.
    Silica Eluate (SE)Immunodetection Barley kDa 98 64 50 36 30 16 6 HarringtonBarley StirlingBarley LuberonBarley AnnabellBarley PasadenaBarley PrestigeBarley RicardaBarley ChaliceBarley JerseyBarley BriseBarley StirlingMalt UnicornMalt CommercialLager UnicornBeer StirlingBeer Haze Haze kDa 98 64 50 36 30 16 6 kDa 98 64 50 36 30 16 6 kDa 98 64 50 36 30 16 6 Malt Beer Haze
  • 46.
    Overall Classification ofVarieties SE -ve varieties 17% SE +ve varieties 83% SE +ve Examples Alexis Arapiles Baudin Dhow Franklin Gairdner Manley Metcalfe Optic Scarlett Schooner Sloop Steptoe Triumph SE -ve Examples Annabell Barke Bowman Excel Harrington Haruna Nijo Kustaa Landlord Moravian III Morex Pirkka Robust Saana Unicorn 219 varieties were screened - 181 were identified as SE +ve, while only 38 were identified as SE –ve.
  • 47.
    Pilot Brewing HazeStability Trial 55ºC Force Test 0 2 4 6 8 10 12 Unicorn Harrington Stiring Schooner Franklin Gairdner Variety EBC Haze Units SE (-) SE (+) The colloidal stability of beer produced from 6 (50L) pilot brewing trials with the Tooheys chill haze force test (5 day 55oC/ 1 day 0oC). Pilot brewing trial Sydney 2000 (50L)
  • 48.
    Recent Novel BeerHaze Proteins? (Iimure et al. 2008, J. Cereal Sci. Sapporo, Japan) Haze growth factors (proteomics approach) • Barley dimeric -amylase inhibitor (BDAI-I) • BTI-CMb • BTI-CMe See also: Robinson, et al. (2007) Journal of Cereal Science, 45:335-342 and 343-352.
  • 49.
    Brewer • Raw materialmore predictable - consistent • Less problems - waste • Develop new products User targets for improved malt quality specs Maltster • Customer satisfaction • Reliability & consistency • New targets…. sustainability - reduce water use - reduce energy use Still provide good malt! Barley Breeder • Select specific genes • Customer satisfaction - growers - maltsters
  • 50.
    Co-authors Brian Rossnagel, AlexSpeers, Mike Edney, Sophie Roumeliotis Assistance: Very many people! Funding: Grains Research and Development Corporation, Grant: UT 00017. Acknowledgments