Download to read offline
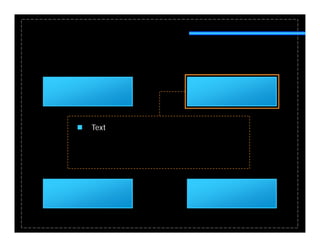
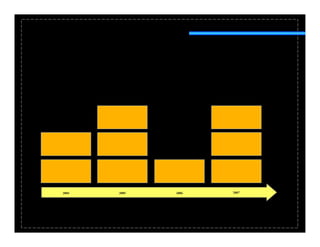
![ [Text to Come.]](https://image.slidesharecdn.com/portfolioslides-090813223538-phpapp01/85/Portfolio-Slides-3-320.jpg)


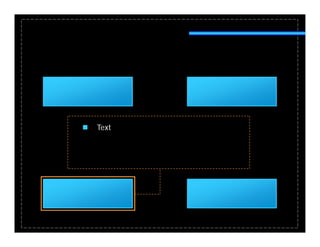
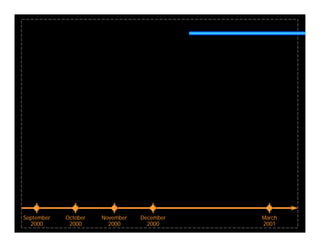
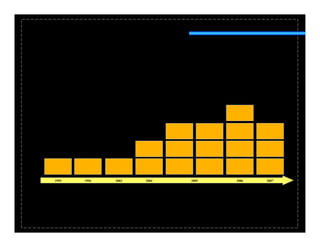
![ [Text to Come]
[ ]
Wide Area Network](https://image.slidesharecdn.com/portfolioslides-090813223538-phpapp01/85/Portfolio-Slides-20-320.jpg)

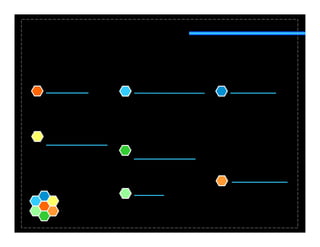
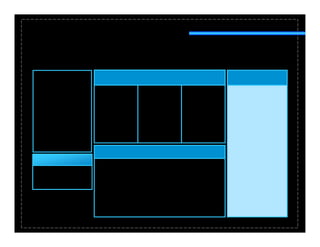
![Technology Investment Banking
Name
Title
Equity Research Strategic Advisory
Name
Title
Name Name
Title Name Title
Title
Name Name
Title Name Title
Title
Equity Capital Markets Equity Capital Markets Services
Name
Title [Logo or Name
Name
Title
Company Name] Title](https://image.slidesharecdn.com/portfolioslides-090813223538-phpapp01/85/Portfolio-Slides-23-320.jpg)


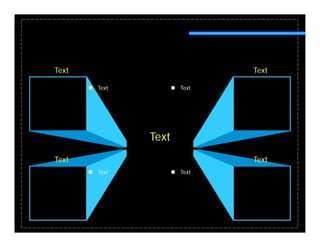


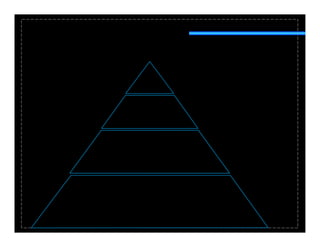


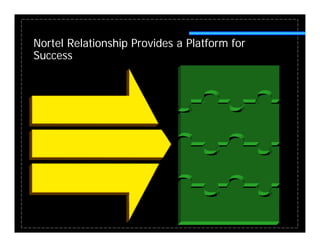


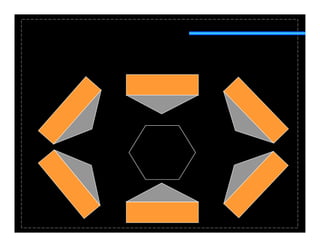


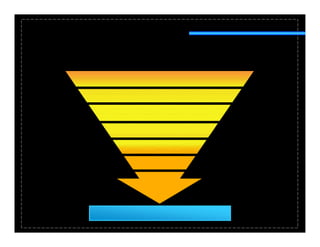
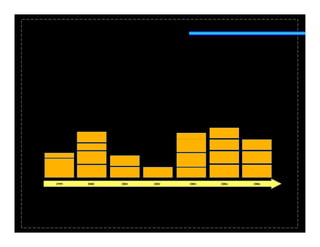
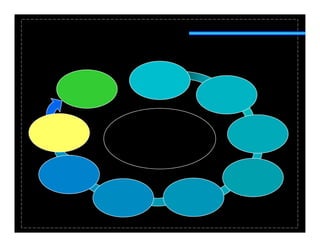
![Convergence Trends [Scott Wanted to Delete]](https://image.slidesharecdn.com/portfolioslides-090813223538-phpapp01/85/Portfolio-Slides-104-320.jpg)


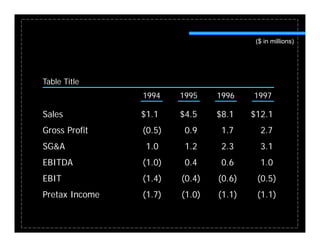
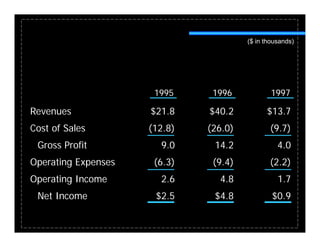
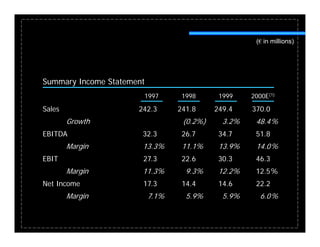
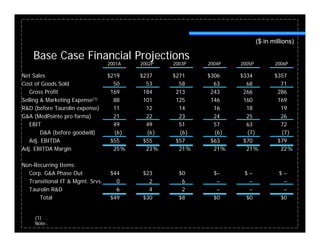
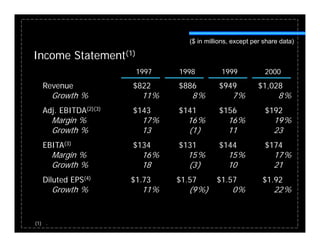
The document contains financial data and projections for several companies from 1994-2007 including income statements, EBITDA, revenues, costs and margins. It also includes diagrams, organizational charts and discusses topics like telecom equipment markets, potential strategic directions, infrastructure, convergence trends and opportunities in various industries.


