Download as PDF, PPTX

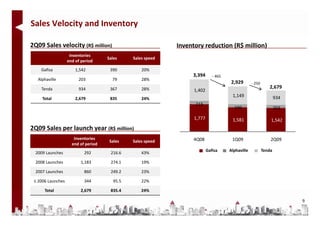
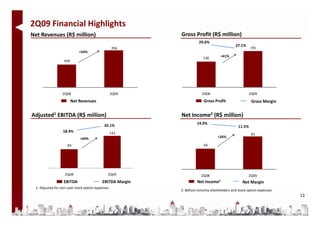
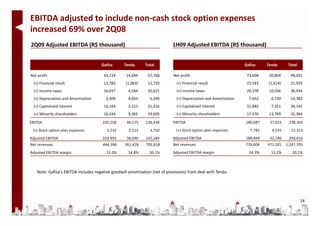
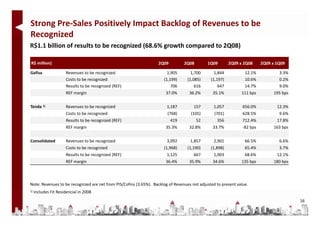


1) Gafisa reported financial results for the second quarter of 2009 with pre-sales increasing 9% compared to the second quarter of 2008 despite a 56% reduction in launches. 2) Net operating revenues rose 54% year-over-year while adjusted EBITDA increased 69% and net income before minority interest grew 26%. 3) The company received R$600 million in debenture funds in May to support its Tenda division projects that meet government housing requirements.


