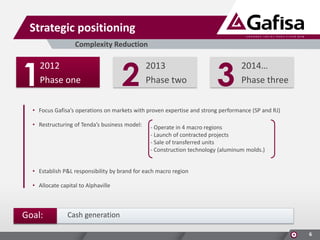
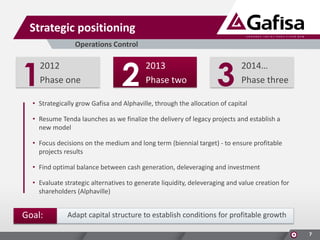
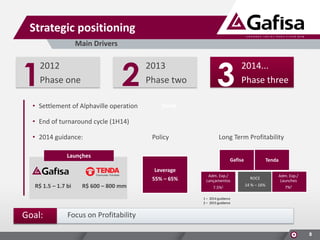
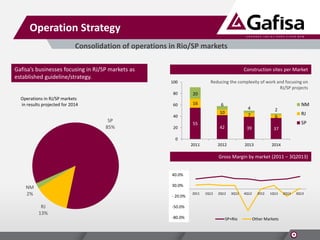
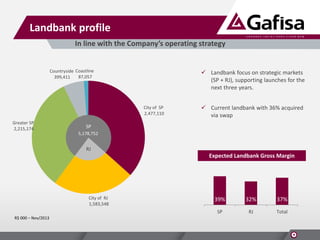
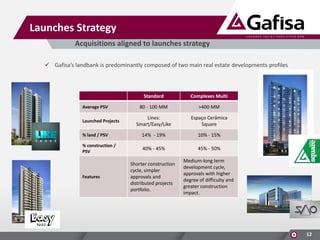
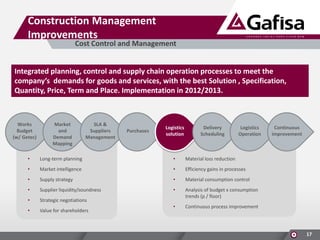
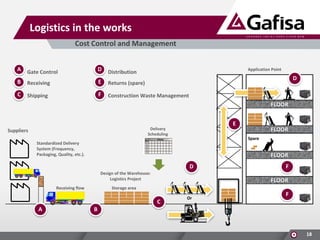
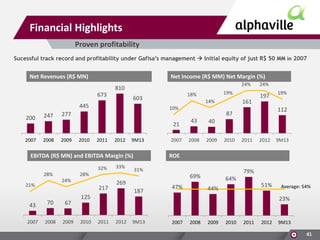
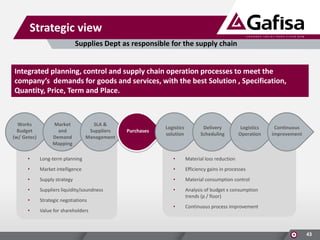
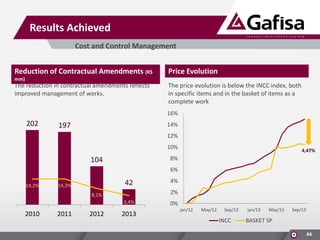
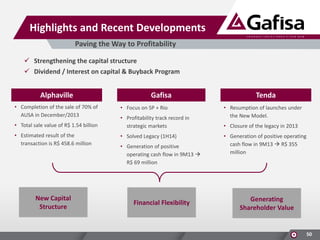
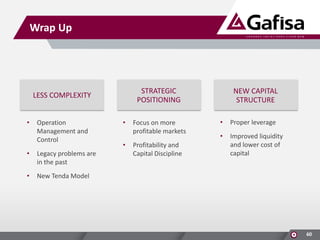
Gafisa outlined its strategic positioning to focus operations on the Rio de Janeiro and Sao Paulo markets, establish profit and loss responsibility by brand and region, and allocate capital to the Alphaville brand. Gafisa also discussed improvements to its construction management, cost control, landbank profile, product segmentation, and customer relations to support its strategic goals of cash generation and adapting its capital structure for profitable growth.
Samir S. Al-Hudhud is an experienced financial management professional and audit consultant with expertise in areas such as project management, financial analysis, internal controls, and compliance monitoring. He has over 25 years of experience working in financial roles for companies in Jordan, Saudi Arabia, and Syria. Currently, he is the Managing Partner of the Suleiman Taher Hudhud & Sons Group in Jordan, where he oversees all financial management and planning.
SEMAFO held an investor day in June 2019 to provide updates on its operations and growth strategy. The presentation discussed SEMAFO's Boungou and Mana mines, exploration prospects, and financial overview. It highlighted that Boungou was built on time and on budget in 2018, establishing a production run rate to achieve the company's 5-year target of 400,000 ounces per year at AISC below $700/oz. SEMAFO also noted its goal of developing a third cornerstone asset at Bantou and eliminating debt by 2020.
This document summarizes the career history and qualifications of Ashrafali Usman Shipra. It outlines his experience working in finance and accounting roles for various companies in Dubai and the UAE over the past 23 years, including his current role as Financial Analyst for Al Tayer Stocks LLC. It also lists his educational background of a partially completed MCom degree and a BCom degree from Mumbai University. His skills include being Microsoft Certified and having experience with enterprise resource planning (ERP) systems like JD Edwards and financial reporting tools.
Samir Al-Hudhud is a business leader in Jordan with over 25 years of experience leading startups and growing businesses. He has expertise in areas such as entrepreneurship, financial management, and people management. Currently he is the Managing Partner of Suleiman Taher Hudhud & Sons Group, where he is responsible for strategic direction, revenue growth, and daily operations. Prior to this role, he held positions as General Manager and Finance Manager for other companies in Jordan and Saudi Arabia.
The document is a resume for Mohammed Yousuf. It summarizes his experience as a Chief Financial Officer and Finance Director for various companies over 24 years. Some of the key responsibilities and accomplishments highlighted in the resume include restructuring finance teams, implementing budgetary controls, developing financial reporting systems, managing projects' financials, ensuring compliance with accounting standards, and implementing ERP systems like Oracle, SAP, and Microsoft Dynamics.
Srinivasan Arun is a senior finance executive with over 20 years of experience in corporate finance, accounting, reporting, and strategic business planning. He has worked in leadership roles for companies in Dubai, overseeing financial operations and multi-million dollar budgets. He is a Certified Public Accountant in the US and Chartered Accountant in the UK and India, with expertise in financial accounting, corporate finance, business modeling, and M&A transactions.
Shihab KC is applying for the position of Chief Financial Officer/Finance Manager/GM-Finance with over 19 years of experience in finance, accounting, auditing and general management roles. He has extensive experience working with companies in various industries such as manufacturing, construction, trading, facility management and more. Some of his key strengths include financial reporting and analysis, internal auditing, budgeting, cash flow management and business development.
This document is a CV for Ahmad Husain Hafeezullah KV that summarizes his professional experience and qualifications. He has over 13 years of finance experience in multinational companies in the Middle East, Africa, and the Indian subcontinent. Currently he is the Finance Manager at M H Al Mana Group in Qatar, where he manages finance departments and restructures subsidiaries. Previously he held finance leadership roles at companies in Yemen, Uganda, and Saudi Arabia. He has extensive experience in financial modeling, budgeting, reporting, and improving company performance. He holds an MBA in Finance and other qualifications.
Merrill lynch non deal road show, Europa, 17 à 19 de Maio de 2006Gafisa RI !
The document provides an overview of Merrill Lynch's roadshow activities in Europe from May 17-19, 2006. It discusses Merrill Lynch's first quarter 2006 launches in Rio de Janeiro and Sao Paulo, Brazil, including four residential projects. It also includes a standard "Safe-Harbor" statement regarding forward-looking projections and describes the agenda for the roadshow.
The document provides an overview of Gafisa S.A., a Brazilian real estate developer, including:
1) Gafisa has grown significantly since 2004 through both organic growth and acquisitions. It focuses on core market regions in Brazil.
2) In 2012, Gafisa prioritized deleveraging and cash generation by reducing launch volumes and focusing on core regions.
3) Gafisa has agreed to sell a 70% stake in its subsidiary Alphaville to investment firms Blackstone and Patria for $1.4 billion, reducing its leverage significantly.
4) Post-transaction, Gafisa will have a more flexible balance sheet and be better positioned to focus
The document discusses Gafisa's 4Q09 and full year 2009 financial results. Key highlights include a 60% increase in net revenue in 4Q09 and 74% increase for the full year. Gross profit grew 88% in 4Q09 and 67% for 2009. Adjusted EBITDA margins improved to 19.5% in 4Q09 and 20% for 2009. Contracted sales grew 79% in 4Q09 and 26% for the full year. The company also saw strong sales in its middle and mid-high segments and continued diversifying its product offerings and geographic presence.
A Gafisa anuncia a aquisição da AlphaVille Urbanismo, a maior incorporadora de projetos de desenvolvimento urbano do Brasil, em uma transação de R$ 201,7 milhões que será realizada em três fases ao longo de cinco anos. A combinação das duas empresas resultará em sinergias significativas e reforçará o posicionamento de mercado da Gafisa.
The document outlines Gafisa's investor day agenda, which includes presentations on Gafisa and Tenda's strategy, operations, and financial performance. It also provides an overview of Gafisa's history and strategic repositioning over time to focus on core markets in Sao Paulo and Rio de Janeiro. Gafisa has implemented improvements to streamline operations and reduce costs, improving financial results with stable operating margins and profitability expected to continue at current levels based on backlog revenues and margins.
O documento fornece informações sobre o empreendimento Alphaville Costa Verde, localizado no Rio de Janeiro. O empreendimento contará com 93 lotes residenciais, clubes com piscinas e salão de festas, além de acesso a um píer e heliponto. O documento detalha ainda informações sobre as normas de construção, taxas de condomínio e serviços oferecidos no local.
O documento apresenta as informações para o Investor Day da Gafisa realizado em 04 de dezembro de 2014. Nele, a empresa faz declarações prospectivas sobre seus negócios que estão sujeitas a riscos e incertezas. A agenda do evento inclui apresentações sobre a estratégia e desempenho operacional e financeiro da Gafisa e de sua subsidiária Tenda.
O documento apresenta os resultados financeiros do 4T14 e do ano de 2014 para os segmentos Gafisa e Tenda. No segmento Gafisa, as vendas contratadas totalizaram R$177 milhões no 4T14 e R$811 milhões no ano. O lucro líquido foi de R$36,8 milhões no trimestre. No segmento Tenda, as vendas contratadas foram de R$126,6 milhões no trimestre, enquanto o prejuízo líquido foi de R$28,8 milhões. O documento também discute o desempen
- The company reported financial results for the fourth quarter and full year of 2014.
- For the Gafisa segment, net pre-sales fell 61% year-over-year in 4Q14. Adjusted EBITDA was R$81.8 million with a 16.7% margin.
- For the Tenda segment, launches increased 173% year-over-year in 4Q14 while pre-sales fell 23%. Adjusted EBITDA was negative R$30.9 million.
- Consolidated net revenue increased 31% quarter-over-quarter. Adjusted gross profit rose 9% and adjusted gross margin was 30.2%.
- Company reported financial results for 4Q13 and full year 2013, with consolidated launches totaling R$1.6 billion for 4Q13, up 224.9% quarter-over-quarter.
- Adjusted EBITDA was R$978.9 million for 4Q13 and R$1.3 billion for 2013, reflecting contributions from the Alphaville transaction.
- Net income was R$921.3 million for 4Q13 and R$867.4 million for 2013.
Shopify is an e-commerce platform that powers over 200,000 active merchants with $1.9 billion in GMV in Q3 2015. The document discusses Shopify's multi-channel commerce platform that allows merchants to manage sales across all channels through a single integrated back office. It highlights Shopify's growing merchant base and financials including strong and consistent growth in revenue, monthly recurring revenue, and GMV driven by new merchants and solutions.
Shopify is an e-commerce platform that powers over 200,000 active merchants with $1.9 billion in gross merchandise volume in Q3 2015. The document discusses Shopify's multi-channel commerce platform that provides a single integrated back office to power online stores, physical retail locations, and sales across all channels. It highlights Shopify's growing merchant base and financial results including strong and consistent growth in revenue, monthly recurring revenue, and gross merchandise volume driven by more merchants and solutions.
Presentation by LafargeHolcim management, Jan Hofmann and Neeraj Akhoury, to members of the financial community at LafargeHolcim Capital Markets Day 2018
Shopify is a multi-channel commerce platform that powers over 200,000 active merchants. In Q3 2015, Shopify merchants generated over $1.9 billion in sales. The document discusses Shopify's financial highlights including strong and consistent growth in revenue, monthly recurring revenue, and gross merchandise volume driven by acquiring more merchants and introducing new solutions. It also outlines Shopify's powerful recurring revenue business model and operating leverage.
Masco Corporation presented at the J.P. Morgan 7th Annual Homebuilding and Building Products Conference on May 15, 2014. The presentation provided an overview of Masco's performance, strengths, opportunities and go forward plan. Masco delivered solid performance in 2013 with $8.2 billion in revenue and over $500 million in free cash flow. The presentation highlighted Masco's strengths in areas like brand leadership, innovation, market coverage and financial position. Opportunities discussed included fully leveraging core businesses, synergies across the portfolio, and actively managing the portfolio. Masco outlined plans for strategic review and communicating an updated strategy by the end of 2014.
This presentation provides an overview of PREIT's strategy and performance over the past three years. It discusses PREIT's focus on improving portfolio quality, strengthening its balance sheet, growing same store NOI, and elevating its position among retail real estate peers. Key highlights include significant reductions in leverage, increases in sales per square foot and occupancy rates, and additions of new retailers. The presentation emphasizes PREIT's concentration of high-quality assets in major markets like Philadelphia and Washington D.C. and its opportunities to drive further growth through redevelopment initiatives.
- Consolidated launches totaled R$1.6 billion in 4Q13, up 224.9% quarter-over-quarter and 8.7% year-over-year. Consolidated pre-sales reached R$1.3 billion in 4Q13 and R$2.5 billion in 2013.
- Net income for 4Q13 was R$921.3 million and R$867.4 million for 2013. Operating cash generation was R$667.7 million in 2013, resulting in positive free cash flow of R$97.3 million.
- Guidance for 2014 includes consolidated launches of R$2.1-2.5 billion and leverage of 55-65%.
Shopify is an e-commerce platform with over 175,000 active merchants and $10 billion in cumulative GMV. The document discusses Shopify's financial highlights including strong and consistent revenue, MRR, and GMV growth driven by growing merchant base and introduction of new products. It also notes Shopify's powerful recurring revenue business model and operating leverage with expanding gross margins and decreasing operating expenses as a percentage of revenue.
The presentation discusses HubSpot's forward-looking statements regarding its expectations for cash flow and margin improvement, ability to execute on its growth strategy in the mid-market, and ability to expand its leadership position and market opportunity for its inbound platform. It notes that actual results may differ from forward-looking statements and will be affected by risks including HubSpot's history of losses, ability to retain and add customers, continued market growth, ability to differentiate its platform, and ability to manage growth. Financial information shows steady revenue growth and progress towards improved gross and operating margins.
Shopify is an e-commerce platform with over 200,000 active merchants and $1.9 billion in gross merchandise volume (GMV) in Q3 2015. The document discusses Shopify's multi-channel commerce platform that allows merchants to manage sales across all channels from a single back office. It provides financial highlights showing Shopify's strong and consistent revenue growth, powerful recurring revenue business model, and operating leverage.
The document provides an overview of Shopify, including key metrics and financial information:
- Shopify has over 243,000 active merchants and generated over $7.7 billion in GMV in 2015.
- It presents Shopify as a one platform solution for merchants to manage their businesses across online and physical stores.
- Financial highlights show strong and consistent growth in revenue, monthly recurring revenue, and GMV, demonstrating the success of Shopify's recurring subscription business model.
Coupa Software Incorporated - Analyst_Investor Day 2017ShiPark2
The agenda outlines presentations from Coupa executives on the company's strategy and business from 9:00 AM to 12:05 PM. The presentation materials contain forward-looking statements and disclosures around non-GAAP financial measures. The company aims to provide an overview of its business while managing risks around future projections.
Zep Inc. sells highly-effective consumable chemicals that help professionals maintain, clean and protect assets and facilities. It markets over 4,000 formulas under trusted brands to over 200,000 customers. Zep aims to reduce complexity and drive organic growth through strategic initiatives like product line rationalization and supply chain optimization. It expects these actions to generate $9 million in cost savings in 2014 and profitably grow its business toward $1 billion in revenue within 5 years.
Shopify is an e-commerce platform with over 300,000 active merchants and $3.4 billion in GMV in Q2 2016. The document discusses Shopify's growth, including strong and consistent increases in revenue, monthly recurring revenue, and GMV. It highlights Shopify's business model of providing a single integrated platform for merchants to manage online stores, payments, shipping, and other operations. The summary highlights Shopify's large opportunity in the global SMB e-commerce market and its vision to make commerce better for everyone.
Shopify is an e-commerce platform powering over 165,000 active merchants with cumulative GMV of over $8 billion. The platform provides a single integrated back office for multi-channel sales across online storefronts, retail locations, and apps on any device. Shopify has a growing merchant base, strong recurring revenue model, and expanding ecosystem of app developers and theme designers. It aims to make commerce better for everyone through its growing product capabilities and long-term focus.
Carfinco Financial Group Inc. is a uniquely positioned auto finance company that has delivered consistent 20%+ annual growth. It provides financing to "non-prime" credit applicants, with a principal balance of $205 million and over 20,000 customers as of March 2013. The presentation highlights Carfinco's competitive position, growing loan portfolio, impressive returns, experienced leadership, and analysts' positive outlook. It argues that Carfinco is well positioned for continued strong growth amid economic volatility.
Gafisa is a Brazilian real estate developer that has undergone a strategic shift since 2011 to focus on profitable opportunities in core markets and reduce leverage. It completed the first stage of its turnaround in 2012 through measures like reducing launches and prioritizing cash flow. Gafisa entered 2013 with improved liquidity and recently agreed to sell a 70% stake in its subsidiary Alphaville to private equity firms for $1.4 billion, which will significantly reduce its debt levels. The transaction maintains Gafisa's 30% stake in Alphaville and positions it for future growth opportunities while improving its balance sheet.
This document contains forward-looking statements about the company's plans, intentions and expectations, which are based on management's views of historical trends and future developments. It cautions that actual results may differ from these statements due to risks and uncertainties. It also notes that case studies of merchant growth do not necessarily mean the company's platform was the only contributing factor. Finally, it provides context for using non-GAAP financial measures to supplement GAAP reporting.
- In 3Q14, the company's launches totaled R$510 million, up 142% year-over-year. Net pre-sales were R$230 million, down 32% year-over-year.
- Adjusted gross profit was R$179.9 million with a margin of 36.4%, up 200 basis points from the prior year. Adjusted EBITDA was R$73.5 million with a margin of 14.9%, down 750 basis points from the prior year.
- Net loss was R$10 million compared to net income of R$15.8 million in 3Q13, impacted by lower pre-sales and margins in the Tenda segment.
O documento apresenta os resultados financeiros da Gafisa e Tenda no 3T14 e nos primeiros 9 meses de 2014. A Gafisa teve aumento nos lançamentos e vendas contratadas, além de melhora nas margens. A Tenda reduziu prejuízos com foco no novo modelo de negócios, apesar de queda nas vendas. Ambas as empresas tiveram redução de custos.
The document summarizes the company's 1Q14 results conference call. It discusses positive operational and financial results for both the Gafisa and Tenda segments. Gafisa saw increases in launches, pre-sales, gross profit and EBITDA. Tenda's launches and pre-sales also increased significantly year-over-year, though it continues to have negative EBITDA. The company has a net debt to equity ratio of 1.26x and generated cash of R$20.5 million in 1Q14. Management provided updates on recent events including the shareholder meeting, dividend program, and preliminary studies on separating the Gafisa and Tenda business units.
Este documento apresenta os resultados da empresa no primeiro trimestre de 2014. Os principais pontos são: (1) Lançamentos totais de R$535 milhões, aumento de 172% em relação ao mesmo período do ano anterior. (2) Vendas contratadas totais de R$239 milhões, aumento de 122% na comparação anual. (3) Lucro bruto ajustado de R$132 milhões e margem bruta ajustada de 30,5%.
1) O documento apresenta os resultados financeiros e operacionais da empresa no 4T13 e no ano de 2013, destacando o crescimento dos lançamentos, vendas e lucro operacional.
2) Também discute eventos recentes como a venda de participação na AUSA, programa de recompra de ações, e proposta de separação das unidades de negócio.
3) Fornece detalhes do balanço patrimonial pós-transação e status dos turnarounds dos segmentos Gafisa e Tenda.
O documento apresenta o planejamento da Gafisa para o Investor Day de 18 de dezembro de 2013, com as seguintes informações essenciais:
1) A agenda do evento inclui apresentações sobre a estratégia da Gafisa, Tenda, Alphaville, cadeia de suprimentos e finanças;
2) A empresa tem focado sua atuação nos mercados do Rio de Janeiro e São Paulo e reduzido a complexidade das operações;
3) A Gafisa tem concentrado seu banco de terrenos em projetos de médio
Gafisa reported financial and operating results for 3Q13. Key highlights included:
- Launches totaled R$498 million in 3Q13, up 8.1% q-o-q and 10.3% y-o-y.
- Consolidated pre-sales reached R$1.2 billion in 9M13.
- Net income was R$15.8 million in 3Q13, reversing a net loss in 2Q13.
- Positive free cash flow of R$32.1 million in 3Q13, compared to a cash burn in 2Q13.
A presentação 3 t13 - port - v0511_v2 (1)Gafisa RI !
O documento apresenta os resultados financeiros da empresa no 3T13. Os principais destaques são: (1) lucro líquido de R$15,8 milhões no trimestre revertendo prejuízo anterior; (2) geração de caixa positiva de R$32,1 milhões; (3) evolução da margem bruta. A empresa também fornece atualizações sobre a transação da Alphaville e perspectivas para 2013.
O documento apresenta os resultados financeiros da empresa no 2T13, destacando:
1) A venda de uma participação de 70% na Alphaville por R$2,01 bilhões, fortalecendo o caixa e reduzindo a alavancagem.
2) Melhoras nas vendas e redução gradual nos distratos, concentrando lançamentos e vendas nos mercados estratégicos de SP e RJ.
3) Retomada dos lançamentos da Tenda no fundamento, com redução do estoque legado e do ciclo financeiro.
- Gafisa reported 2Q13 results with sales exceeding launches and sequential improvement in the speed of sales.
- Gafisa entered an agreement to sell a 70% stake in Alphaville to Blackstone and Patria, generating expected proceeds of R$1.4 billion to reduce leverage.
- The sale allows shareholders to participate in long-term value through the retained 30% stake while unlocking value generated since Alphaville's acquisition.
- Gafisa S.A. signed an agreement to sell a 70% stake in Alphaville to Blackstone and Pátria, valuing the company at R$2.01 billion and generating expected gross cash proceeds of R$1.4 billion.
- The sale strengthens Gafisa's balance sheet by reducing leverage and generating long-term shareholder value. Shareholders will participate in future value creation through the retained 30% stake.
- In 2Q13, Gafisa exceeded sales over launches and saw sequential improvement in its sales velocity. Tenda's new launches are performing well and its financial cycle has halved to an average of 7 months.
- Post-
A apresentação discute os resultados financeiros da empresa no 2T13, incluindo a venda de uma participação majoritária na Alphaville para a Blackstone e Pátria. Além disso, fornece atualizações sobre o desempenho operacional dos segmentos Gafisa e Tenda e explica ajustes nas demonstrações financeiras devido à classificação de ativos da Alphaville como mantidos para venda.
O documento descreve a estratégia e histórico da Gafisa, incluindo: 1) A Gafisa focou-se inicialmente em crescimento orgânico e aquisições, mas agora prioriza oportunidades de alto retorno e disciplina financeira; 2) A venda de uma participação de 70% na Alphaville para a Blackstone e Pátria reduzirá significativamente a alavancagem da Gafisa; 3) A Tenda está relançando suas operações sob um novo modelo de negócios rentável.
Alphaville presented its corporate presentation which included:
1) An overview of Alphaville's history, products, national presence and key highlights including its strong brand, experience, and national partnerships.
2) Details on Alphaville's unique business model which relies on partnerships, efficient construction processes, and a proprietary sales process to ensure high sales velocity and profitability with low cash exposure.
3) Financial highlights demonstrating Alphaville's consistent growth and profitability with high margins, returns, and solid increases in launches, sales, and profits over recent years.
O documento apresenta os resultados financeiros do primeiro trimestre de 2013 da empresa. As vendas líquidas contratadas totalizaram R$218 milhões, em linha com o primeiro trimestre tradicionalmente mais fraco. A velocidade de vendas consolidada foi de 5,9%, impactada por maior volume de distratos. A empresa relançou operações da Tenda com novo modelo de negócios visando redução de riscos.
O documento apresenta os resultados financeiros do primeiro trimestre de 2013 da empresa. As margens operacionais ainda não retornaram aos níveis normais devido a projetos antigos com margens menores que serão entregues em 2013. A Tenda retomou lançamentos após reestruturação e agora prioriza projetos de menor risco e giro mais rápido. As vendas consolidadas atingiram R$481 milhões no trimestre, com velocidade de vendas de 5,9%.
- The document provides an overview of a company's 1Q13 earnings conference call, including highlights of financial performance, operational results, and recent developments.
- Revenue declined year-over-year due to lower seasonal activity and higher sales cancellations. Operating results have not yet reflected margins due to legacy project resolutions and structural changes.
- Cash generation was positive in 1Q13, with increased launch activity and land purchases to result in neutral operating cash flow for 2013. The new Tenda business model focuses on minimizing costs and balance sheet risk while maintaining construction quality.
Gafisa reported its 4Q12 and full year 2012 results on March 12, 2013. Key highlights included:
1) Positive consolidated free cash generation of R$381mn in 4Q12 and R$685mn in 2012, exceeding cash flow guidance.
2) Unit deliveries increased 20% to 27,107 units in 2012, exceeding guidance.
3) Launches totaled R$1.49bn in 4Q12 and R$2.95bn for the full year, near the high end of guidance.
4) Actions taken in 2012 positioned the company with a comfortable cash position and improved balance sheet as it prepares to accelerate investments in 2013.
Taurus Zodiac Sign: Unveiling the Traits, Dates, and Horoscope Insights of th...my Pandit
Dive into the steadfast world of the Taurus Zodiac Sign. Discover the grounded, stable, and logical nature of Taurus individuals, and explore their key personality traits, important dates, and horoscope insights. Learn how the determination and patience of the Taurus sign make them the rock-steady achievers and anchors of the zodiac.
Zodiac Signs and Food Preferences_ What Your Sign Says About Your Tastemy Pandit
Know what your zodiac sign says about your taste in food! Explore how the 12 zodiac signs influence your culinary preferences with insights from MyPandit. Dive into astrology and flavors!
How to Implement a Real Estate CRM SoftwareSalesTown
To implement a CRM for real estate, set clear goals, choose a CRM with key real estate features, and customize it to your needs. Migrate your data, train your team, and use automation to save time. Monitor performance, ensure data security, and use the CRM to enhance marketing. Regularly check its effectiveness to improve your business.
SATTA MATKA SATTA FAST RESULT KALYAN TOP MATKA RESULT KALYAN SATTA MATKA FAST RESULT MILAN RATAN RAJDHANI MAIN BAZAR MATKA FAST TIPS RESULT MATKA CHART JODI CHART PANEL CHART FREE FIX GAME SATTAMATKA ! MATKA MOBI SATTA 143 spboss.in TOP NO1 RESULT FULL RATE MATKA ONLINE GAME PLAY BY APP SPBOSS
Industrial Tech SW: Category Renewal and CreationChristian Dahlen
Every industrial revolution has created a new set of categories and a new set of players.
Multiple new technologies have emerged, but Samsara and C3.ai are only two companies which have gone public so far.
Manufacturing startups constitute the largest pipeline share of unicorns and IPO candidates in the SF Bay Area, and software startups dominate in Germany.
𝐔𝐧𝐯𝐞𝐢𝐥 𝐭𝐡𝐞 𝐅𝐮𝐭𝐮𝐫𝐞 𝐨𝐟 𝐄𝐧𝐞𝐫𝐠𝐲 𝐄𝐟𝐟𝐢𝐜𝐢𝐞𝐧𝐜𝐲 𝐰𝐢𝐭𝐡 𝐍𝐄𝐖𝐍𝐓𝐈𝐃𝐄’𝐬 𝐋𝐚𝐭𝐞𝐬𝐭 𝐎𝐟𝐟𝐞𝐫𝐢𝐧𝐠𝐬
Explore the details in our newly released product manual, which showcases NEWNTIDE's advanced heat pump technologies. Delve into our energy-efficient and eco-friendly solutions tailored for diverse global markets.
Best practices for project execution and deliveryCLIVE MINCHIN
A select set of project management best practices to keep your project on-track, on-cost and aligned to scope. Many firms have don't have the necessary skills, diligence, methods and oversight of their projects; this leads to slippage, higher costs and longer timeframes. Often firms have a history of projects that simply failed to move the needle. These best practices will help your firm avoid these pitfalls but they require fortitude to apply.
Building Your Employer Brand with Social MediaLuanWise
Presented at The Global HR Summit, 6th June 2024
In this keynote, Luan Wise will provide invaluable insights to elevate your employer brand on social media platforms including LinkedIn, Facebook, Instagram, X (formerly Twitter) and TikTok. You'll learn how compelling content can authentically showcase your company culture, values, and employee experiences to support your talent acquisition and retention objectives. Additionally, you'll understand the power of employee advocacy to amplify reach and engagement – helping to position your organization as an employer of choice in today's competitive talent landscape.
Part 2 Deep Dive: Navigating the 2024 Slowdownjeffkluth1
Introduction
The global retail industry has weathered numerous storms, with the financial crisis of 2008 serving as a poignant reminder of the sector's resilience and adaptability. However, as we navigate the complex landscape of 2024, retailers face a unique set of challenges that demand innovative strategies and a fundamental shift in mindset. This white paper contrasts the impact of the 2008 recession on the retail sector with the current headwinds retailers are grappling with, while offering a comprehensive roadmap for success in this new paradigm.
Digital Marketing with a Focus on Sustainabilitysssourabhsharma
Digital Marketing best practices including influencer marketing, content creators, and omnichannel marketing for Sustainable Brands at the Sustainable Cosmetics Summit 2024 in New York
IMPACT Silver is a pure silver zinc producer with over $260 million in revenue since 2008 and a large 100% owned 210km Mexico land package - 2024 catalysts includes new 14% grade zinc Plomosas mine and 20,000m of fully funded exploration drilling.
Best Competitive Marble Pricing in Dubai - ☎ 9928909666Stone Art Hub
Stone Art Hub offers the best competitive Marble Pricing in Dubai, ensuring affordability without compromising quality. With a wide range of exquisite marble options to choose from, you can enhance your spaces with elegance and sophistication. For inquiries or orders, contact us at ☎ 9928909666. Experience luxury at unbeatable prices.
[To download this presentation, visit:
https://www.oeconsulting.com.sg/training-presentations]
This PowerPoint compilation offers a comprehensive overview of 20 leading innovation management frameworks and methodologies, selected for their broad applicability across various industries and organizational contexts. These frameworks are valuable resources for a wide range of users, including business professionals, educators, and consultants.
Each framework is presented with visually engaging diagrams and templates, ensuring the content is both informative and appealing. While this compilation is thorough, please note that the slides are intended as supplementary resources and may not be sufficient for standalone instructional purposes.
This compilation is ideal for anyone looking to enhance their understanding of innovation management and drive meaningful change within their organization. Whether you aim to improve product development processes, enhance customer experiences, or drive digital transformation, these frameworks offer valuable insights and tools to help you achieve your goals.
INCLUDED FRAMEWORKS/MODELS:
1. Stanford’s Design Thinking
2. IDEO’s Human-Centered Design
3. Strategyzer’s Business Model Innovation
4. Lean Startup Methodology
5. Agile Innovation Framework
6. Doblin’s Ten Types of Innovation
7. McKinsey’s Three Horizons of Growth
8. Customer Journey Map
9. Christensen’s Disruptive Innovation Theory
10. Blue Ocean Strategy
11. Strategyn’s Jobs-To-Be-Done (JTBD) Framework with Job Map
12. Design Sprint Framework
13. The Double Diamond
14. Lean Six Sigma DMAIC
15. TRIZ Problem-Solving Framework
16. Edward de Bono’s Six Thinking Hats
17. Stage-Gate Model
18. Toyota’s Six Steps of Kaizen
19. Microsoft’s Digital Transformation Framework
20. Design for Six Sigma (DFSS)
To download this presentation, visit:
https://www.oeconsulting.com.sg/training-presentations
2. Safe-Harbor Statement
We make forward-looking statements that are subject to risks and uncertainties. These
statements are based on the beliefs and assumptions of our management, and on
information currently available to us. Forward-looking statements include statements
regarding our intent, belief or current expectations or that of our directors or
executive officers.
Forward-looking statements also include information concerning our possible or
assumed future results of operations, as well as statements preceded by, followed by,
or that include the words ''believes,'' ''may,'' ''will,'' ''continues,'' ''expects,'‘
''anticipates,'' ''intends,'' ''plans,'' ''estimates'' or similar expressions. Forward-looking
statements are not guarantees of performance. They involve risks, uncertainties and
assumptions because they relate to future events and therefore depend on
circumstances that may or may not occur. Our future results and shareholder values
may differ materially from those expressed in or suggested by these forward-looking
statements. Many of the factors that will determine these results and values are
beyond our ability to control or predict.
2
3. Agenda
1.
Strategic positioning - Duilio Calciolari
2.
Gafisa – Sandro Gamba
3.
Tenda – Rodrigo Osmo
4.
Alphaville – Marcelo Willer
5.
Supply Chain & Gafisa Service Center – Luiz Carlos Siciliano
6.
Finance – Andre Bergstein
7.
Conclusion and Closing Remarks – Duilio Calciolari
Q&A
3
5. Organizational Structure
Gafisa Management
Duilio Calciolari
CEO
Andre Bergstein
CFO and IRO
At Gafisa since 2000
At Gafisa since March/2012
Worked in the following areas: HR, IT, Finance,
Controllership and Investor Relations.
Responsible for Treasury , Corporate Finance, Capital
Markets and Investor Relations.
Fernando Calamita
Luiz Carlos Siciliano
Planning and Control
Director
Supply Chain Officer
At Gafisa since 2007
Finance and
Administrative VP of
Kidde do Brasil Ltda.
Rodrigo Osmo
Rodrigo Pádua
Sandro Gamba
Marcelo Willer
Head of Gafisa
Head of AlphaVille
Head of Tenda
Human Resources
Director
At Gafisa since 2005
At Gafisa since 2006
At Gafisa since 1996
Worked in the Sales
and Logistics area
of AmBev from
1992 to 2004.
Worked as an
Executive of GP
Investimentos and
Consultant of
Bain&Company
Worked as Project
Manager of AmBev
and Human
Resources Manager
at Danone.
Started as an intern at
Gafisa.
Graduated in Chemical
Engineering from USP,
with a Master in
Business by Harvard
Business School.
Graduated in
Business from UMAMG; MBA in Human
Resources from FGV
and an MBA in
Business
Management from
IBMEC.
MBA in finance
from IBMEC and in
Marketing from
PUC-RJ.
Graduated in Civil
Engineering by
Mackenzie University;
MBA from Insper and
an MBA in Real Estate
Management by FAAP.
Worked as a Real
Estate Officer at
Alphaville since 2006.
From 2000 to 2006
worked as a Projects
Officer.
6. Strategic positioning
Complexity Reduction
1
2012
Phase one
2
2013
Phase two
3
2014…
Phase three
• Focus Gafisa’s operations on markets with proven expertise and strong performance (SP and RJ)
• Restructuring of Tenda’s business model:
- Operate in 4 macro regions
- Launch of contracted projects
- Sale of transferred units
- Construction technology (aluminum molds.)
• Establish P&L responsibility by brand for each macro region
• Allocate capital to Alphaville
Goal:
Cash generation
6
7. Strategic positioning
Operations Control
1
2012
Phase one
2
2013
Phase two
3
2014…
Phase three
• Strategically grow Gafisa and Alphaville, through the allocation of capital
• Resume Tenda launches as we finalize the delivery of legacy projects and establish a
new model
• Focus decisions on the medium and long term (biennial target) - to ensure profitable
projects results
• Find optimal balance between cash generation, deleveraging and investment
• Evaluate strategic alternatives to generate liquidity, deleveraging and value creation for
shareholders (Alphaville)
Goal:
Adapt capital structure to establish conditions for profitable growth
7
8. Strategic positioning
Main Drivers
1
2
2012
Phase one
• Settlement of Alphaville operation
2013
Phase two
3
2014...
Phase three
Tenda
• End of turnaround cycle (1H14)
• 2014 guidance:
Policy
Long Term Profitability
Launçhes
Gafisa
Leverage
55% – 65%
R$ 1.5 – 1.7 bi
R$ 600 – 800 mm
Adm. Exp./
Lançamentos
7.5%1
Tenda
ROCE
14 % – 16%
Adm. Exp./
Launches
7%2
1 – 2014 guidance
2 – 2015 guidance
Goal:
Focus on Profitability
8
10. Operation Strategy
Consolidation of operations in Rio/SP markets
Gafisa’s businesses focusing in RJ/SP markets as
established guideline/strategy.
Construction sites per Market
Reducing the complexity of work and focusing on
RJ/SP projects
100
80
SP
85%
20
60
Operations in RJ/SP markets
in results projected for 2014
16
6
10
42
55
39
37
2012
40
20
NM
4
7
2013
2014
2
6
RJ
SP
0
2011
Gross Margin by market (2011 – 3Q2013)
40,0%
40.0%
10,0%
30.0%
NM
2%
--20,0%
20.0%
RJ
13%
2011
1Q12
2Q12
3Q12
4Q12
2012
1Q13
-50.0%
-50,0%
-80.0%
-80,0%
SP+Rio
Other Markets
2Q13
3Q13
11. Landbank profile
In line with the Company’s operating strategy
Countryside Coastline
87,057
399,411
Landbank focus on strategic markets
(SP + RJ), supporting launches for the
next three years.
City of SP
2,477,110
Greater SP
2,215,174
Current landbank with 36% acquired
via swap
SP
5,178,752
RJ
Expected Landbank Gross Margin
City of RJ
1,583,548
32%
37%
SP
R$ 000 – Nov/2013
39%
RJ
Total
12. Launches Strategy
Acquisitions aligned to launches strategy
Gafisa’s landbank is predominantly composed of two main real estate developments profiles
Standard
Complexes Multi
80 - 100 MM
>400 MM
Lines:
Smart/Easy/Like
Espaço Cerâmica
Square
% land / PSV
14% - 19%
10% - 15%
% construction /
PSV
40% - 45%
45% - 50%
Shorter construction
cycle, simpler
approvals and
distributed projects
portfolio.
Medium-long term
development cycle,
approvals with higher
degree of difficulty and
greater construction
impact.
Average PSV
Launched Projects
Features
12
13. Product Segmentation
Standardization of operating segments
Customers clusters segmentation project development to seek greater assertiveness on the product and
communication approach and better understand the public to serve in the most appropriate way.
Cluster 1
Cluster 2
Has questions, looks for
price, opportunity, and
requires security
New market segment.
Demands facilities,
location and modernity
Cluster 3
They demand good
taste and
exclusiveness. They
search for more than a
property, they demand
status
Cluster 2
24%
Cluster 1
35%
Cluster 4
Know what they want,
search, compare and
look for increased
space
Gafisa’s clients segmention*
Investor
18%
Cluster 3
18%
Cluster 4
5%
*Sample of 6,000 clients from Gafisa’s base
13
14. Market
Market in growth recovery
Launched PSV Evolution (R$ MM) Greater SP
Launched PSV Evolution (R$ MM) RIO+NIT
3,602
SOS
58%
4,395
17,916
14,361
9M12
SOS
60%
1,053
4,601
4,528
9M12
9M13
SOS
62%
9M13
Residential
1,647
Commercial
Residential
SOS
66%
Commercial
* 3Q12 and 3Q13 information
Lauches Performance Gafisa (R$ 000)
31
795
63
31
0
732
1,081
675
406
1,050
644
406
9M12
9M13
SP
RJ
Tend. FY13
YTD2012
SP
RJ
SP
RJ
*4Q13 and YTD with value up to 12/15
14
15. Sales Management
Increasingly mature sales management system
MONTHLY
Management guidelines
Medium-term strategy
Daily evolution of sales
OBJECTIVE
Expenses control
Visits and conversion
MKT and Business Planning
Real estate companies’ goal
Focus: Goal for the year
IMPROVEMENTS
FORECAST
Launches management
Sales
target
FOLLOW UP
Billing process
Credit before sale
Selling expenses
Sales and expenses forecast
WEEKLY
Price Strategy
Monitoring implementation
Monitoring the competition
Short-term tactic
Market share, EVs share
PIPELINE
Sales pipeline
Focus: Goal for the month
projects
15
16. Sales Management
Importance of Gafisa Sales and Online Channel
Gafisa Sales is gaining more space and currently represents 54% of Gafisa sales, thereby
reducing the dependence on third parties and ensuring greater control over the sales
process.
Gafisa Sales Share
Online Sales (SP+RJ 9M13)
3000
2500
1,876.231
Website visits
2000
54%
1500
45%
1000
500
35%
38%
44%
Contacts
(leads)
Valid Contacts
(prospects)
38%
31%
Referrals
0
2007
2008
2009
Gafisa
2010
2011
%GV
2012
Tendência
2013
Sold Units
53,589
3%
24,077 44%
12,059
48%
412
2%
Online channel
27%
of sales*
* SP+Rio
16
17. Construction Management
Improvements
Cost Control and Management
Integrated planning, control and supply chain operation processes to meet the
company’s demands for goods and services, with the best Solution , Specification,
Quantity, Price, Term and Place. Implementation in 2012/2013.
Works
Budget
(w/ Getec)
Market
and
Demand
Mapping
SLA &
Suppliers
Management
Purchases
Logistics
solution
Delivery
Scheduling
Logistics
Operation
•
Long-term planning
•
Material loss reduction
•
Market intelligence
•
Efficiency gains in processes
•
Supply strategy
•
Material consumption control
•
Supplier liquidity/soundness
•
•
Strategic negotiations
Analysis of budget x consumption
trends (p / floor)
•
Value for shareholders
•
Continuous
improvement
Continuous process improvement
17
18. Logistics in the works
Cost Control and Management
A Gate Control
D
Distribution
B
Receiving
E
Returns (spare)
C
Shipping
F
Construction Waste Management
Application Point
D
PAVIMENTO
FLOOR
E
Delivery
Scheduling
Suppliers
Spare
Standardized Delivery
System (Frequency,
Packaging, Quality, etc.).
FLOOR
PAVIMENTO
D
Design of the Warehouse:
Logistics Project
Receiving flow
F
FLOOR
PAVIMENTO
Storage area
C
A
FLOOR
PAVIMENTO
Or
F
B
18
19. Customer Relations
Investments on Customer Management
Dissemination of
Customer Culture
and expansion of
Relationship
Program (Viver
Bem)
Improved
Communication
Control, Internal
Processes and
Website
2010
Amid the crisis in the industry,
which started in 2008, Gafisa has
invested in the CRM area to
minimize Business diversions
impact to the customer.
Despite the increase in client
portfolio (50%) in the last three
years, the average monthly
volume of interactions across all
service channels remained stable.
2011
Deployment of
new relationship
initiatives, further
narrowing the
communication
with the customer
2012
Implementation
of CRM Dynamics
and Platinum
Customer Service
Center
2013
48,423
47,084
39,663
32,000
13,902
16,189
16,137
7,332
2010
2011
2012
Client Portfolio
Average monthly calls
Monthly average of unique clients
13,884
6,884
jul/13
20. Brand Strength
Recognition and Trust
Top of Mind
Stimulated
knowledge
Desirability
Purchase
preference
Gafisa
18
52
98
34
60
Peer 1
15
40
92
26
52
Peer 2
7
27
89
12
35
Peer 3
4
19
69
11
35
Peer 4
3
15
89
9
32
Peer 5
3
15
56
6
35
Peer 6
According to annual research
conducted by a third party
company, Gafisa leads the
main KPIs demonstrating
brand strength in the market.
Spontaneous
awareness
2
13
77
7
28
Strong Equity
Growing Equity
3
1
5
6
Brand positioning annual survey
performed by third party company Base: Total Sample (400, SP and RJ,
class A and B1, between 30 and 55
years old, who purchased new
residential property in the last 4 years
and / or plan to buy new residential
property in the next 3 years).
2
4
Little Equity
Declining Equity
22. Tenda
Run-Off of Legacy Projects
Legacy projects less relevant in 2014.
Tenda Legacy Run-Off - R$ 000
4Q11
4Q13*
% Solved
Units to Deliver
30,944
7,387
76.1%
3,774,933
922,848
75.6%
Accounts receivable + Invetory (PSV)
* Estimated
22
23. New Model
Tenda’s ‘New Model’, is based on 4 pillars.
1
ALUMINUM
MOLD
3
2
CONTRACTING
LAUNCHES
TRANSFER OF
SALES
4
IN STORE
SALES
23
24. Pillars: New Tenda Model
Aluminum Mold X Structural Masonry
1 of 4
Physical examination – development: 300 units
01
02
03
04
05
06
07
08
09
10
11
12
13
14
15
Restrictions
16
17
18
Conditions to obtain advantage in costs :
Minimum of 2 molds per project (1,000
un./year);
mobilization and earthmoving
foundation and beams
Continuous production (MDO own
structure)
structure
facade
internal finishing + facilities
Concrete wall - 2 sets of molds
Cost
Benefit of Concrete
Wall*
Direct
Indirect
Total
* Unit cost percentage
(1%)
3%
2%
Structural Masonry
Adittional Benefits:
(a) accelerated receiving (associative
financing);;
(b) Flexibility: start construction only with
good sale
24
25. New Model
Transfered Sales
2 of 4
Despite lower gross margins, transferred sales create more value
VPL x TIR
Cash Exposure
Cenário Inicial sem
custos adicionais
Cenário Inicial
sem custos adicionais
Scenarios: Loss due to increased dissolutions (10%, 20%, 30%) and sales and marketing costs
Restrictions:
• Unable to go back on development
25
26. New Model
Launch Contracted: Rational
3 of 4
• Necessary condition for transferred sales since the start
Rational
• Elimination of technical and legal risks
Technical risks Eliminated
Cost
Term
Change in the feasibility guideline from water supply, sewage and energy utilities
(design change)
Change in the agreements for environmental licensing between the municipal and state
levels
Requirements of the Fire Department to amend the legal design
CEF disagreement about the descriptive history of finishes and systems of work ex.
Waterproofing, windowsill (usually local requirements)
Customers’
Consent
Notary requirements to review contract draft
CEF requirements to provide visibility to the buyers via annotations on registration
(environmental processes)
Restrictions:
It results in a more lengthy launch process as it requires the evolution of projects and
licensing at a level of detail required only for early works
26
27. New Model
In Store Sales
4 of 4
In store sales allow a more competitive S&M expense
Additional Benefits
8%
EV’s at 4.6%
commission 3.2%
premium 1.0%
Stand 0.4%
6%
Store
Higher economics copared to stands (demolished)
Takes advantage of large walking flow in in places
with heavy traffic
Own Sales team
Continuous improvement in process
Specialized in MCMV
Lack of sales peak allows staff to work without
inactivity
2%
Lower turnover
0%
Units sale/Month
10
15
20
25
30
35
40
45
50
55
60
65
70
75
80
85
90
95
100
Sales Cost/PSV
4%
Large Store
Medium Store
Marketing Focused on Brand
Better use of the customer: high product availability
Small Store
Source: Sales and Marketing, Financial Planning, MRV Results
2727
29. Market
Competition
Complex implementation has driven away large players, reducing the competition
Launches Types I and II – Listed Companies
(R$ billion)
10.50
7.60
7.40
4.60
3.10
2009
2010
2011
2012
2013
2013*: 9 months 2013 Annualized
Note: The data are estimates based on reports of listed companies.
Source: Company Reports – MRV, Cyrela, Gafisa, PDG, Rossi, Brookfield, CCDI, Viver, Even, Rodobens, Trisul, Tecnisa, Direcional, Eztec , Helbor.
29
30. Financial Model
Average Transfer Period
Short transfer period for “new” sales and high sales velocity have important impacts
on the cash exposure of our projects
Average Time between Sale and Transfer
60
50
49.7
40
33.2
30.3
30
27.4
27.7
22.9
20
15.4
13.8
11.1
10.7
10
8.9
7.5
7.5
3.9
3.1
2.9
2.1
2.2
3Q12
4Q12
1Q13
2Q13
3Q13
0
1Q11
2Q11
3Q11
4Q11
1Q12
Total
2Q12
New Sales
30
31. Financial Model
Financial Cycle speed
Accelerated financial cycle, developments with sale time of less than 15 months and flexibility to start
well sold projects reduce the need for working capital
Project Indicators in % of PSV
100%
Free Cash Flow - Land in Cash
30%
20%
80%
10%
60%
0%
Lçto
3
5
7
9
11
13
15
17
19
21
23
25
27
29
31
33
-10%
40%
-20%
20%
-30%
0%
-40%
1 2 3 4 5 6 7 8 9 10 11 12 13 14 16 16 17 18 19 20 21
L
IO
FO
E
Vendas
Sales
Work cost
Custo Obra
Work cost
Custo Obra
Repasses
Transfers
Receita
Revenue
Revenue Custo Obra
Receita (-) (-) Work cost
Premises:
Units: 450
Sales per Month: 30
Price: R$ 130 thousand
Financing: R$ 113 thousand
Cost per unit: R$ 65 thousand
Cost/Financed: 57.5%
-50%
-60%
-70%
Transferred Sales
Venda Repassada
Value generated
by:
Repasse Piloto
Pilot Transfer
- Selling Cost
- Release only in the record (+ 3 months)
- Work Measuring (M + 1 of the cost)
31
32. Key Performance Indicators
Challenges and Risks
Challenges
•
Achieve attractive profitability from an
operation of approximately R$ 1 billion
•
Equate G&A to a legacy free scenario
•
Create landbank for operational continuity
•
Adapt Operations to a reality the New
Model
•
Increase Business (Prospecting and
incorporation) scale without loss of quality
•
Risks
Reinforce Tenda Culture
•
MCMV depends on political
programs
•
Low discontinuity risk
(directed funding FGTS)
•
Medium attractiveness risk
due to constantly revised
parameters (interest,
subsidies, etc)
32
33. New Launches
Performance
Launches performing well to date, but still early for smooth execution of works
Novo Horizonte
SP
Itaim Paulista
BA
Vila Cantuária
SP
Verde Vida
BA
Jaraguá
SP
Viva Mais
RJ
Mar/13
Mai/13
Mar/13
Jul/13
Ago/13
Nov/13
580
240
440
360
260
300
R$ 65.145
R$ 31.220
R$ 45.903
R$ 38.563
R$ 40.842
R$ 39.713
Sales
575
227
117
242
140
64
% Sales
99%
52%
49%
67%
54%
21%
Transfers
558
146
98
69
119
0
% Transfers
97%
64%
84%
29%
85%
0%
Work progress
70%
46%
20%
27%
34%
0%
% Price Gain
3.0%
2.4%
1.4%
1.3%
5.2%
-0.6%
Cost Trend
-3.1%
-1.0%
-2.3%
-
-
-
Launch date
Qty Units
PSV Total (R$000)
33
35. Introduction
Alphaville Timeline
Acquisition
of 1st land
parcel in
Barueri
Launch of Alphaville
Lagoa dos Ingleses
(Belo Horizonte)
Patria/Blackstone
acquire 70% stake.
Gafisa retains 30%
1st resident moves
to Alphaville and
2nd phase launch of
residential
development
1973
1976
Acquisition of 60% by
Gafisa.
1st Alphaville
outside
Barueri
Region
(Campinas)
launch
1995
1997
2000
Foundation of
Alphaville
Urbanismo S.A.
Development
launched in
Portugal
9 developments
launched
Launch of
Alphaville Goiânia
1998
Alphaville Graciosa
(Curitiba) launch
2001
2002
2005
Emphasis on
geographic
diversification, with
the launch of 15
projects
Creation of the
Alphaville
Foundation
Construtora Albuquerque Takaoka
12 developments
Alphaville Urbanismo S.A.
(Management by founding partners)
23 developments
second venture
launch - urban
development in
Brasilia
2006
2007
2008
2010
2011
2012
Acquisition of
additional 20% by
Gafisa.
Accelerated growth
phase, with emphasis
on increasing volume
and margins, with the
launch of 34 projects
2013
Gafisa
acquires
remaining
20%
New
Alphaville
brand
launch
Alphaville Urbanismo S.A.
(Gafisa management)
Aprox. 85 developments/phases
35
36. Alphaville
Alphaville Brand&Footprint
Brand Equity
National Presence
59 developments executed (45 MN m²)
32 projects being executed (19 MN m²)
98 residential phases and 54 commercial
• In 2012, we shifted the positioning and visual
identity of the brand, and launched a new
branding campaign
• Brand awareness increased 124%
• The Alphaville brand is mainly associated with
the attributes of Tradition, Synonymous with
Quality, Expertise, Safe and sound brand name.
Business Portfolio
Núcleos Urbanos
Planned Neighborhoods*
Open Neighborhoods*
* Products under development phase
21 States and 53 Cities
64
million m²
executed and
implemented
186
million m²
in projects to
be developed
Projects under
implementation
and execution (91) and
landbank exceeding R$ 14
billion support aggressive
growth strategy
36
37. Main Highlights
Alphaville Track Record
• Since 1973, leader in urban development in Brazil
Strong brand recognition with reputation for excellent quality
Nearly forty years experience in the complex process of approving subdivisions
• National Presence and consistent history of growth
Launches CAGR of 37% in the last 4 years. In 2012, projects launched totalled R$ 1.34 billion
Leadership position ensures access to the best land
Locked up partnerships already signed with land owners totaling a PSV of more than R$ 13 billion in
land bank for future developments
• Ventures with margins due to price premium and expertise in urbanization
Gross Margin of 50% (consolidated in 2012)
• Unique positioning and high demand by enterprises ensure good sales velocity and
price appreciation still during development
The process of damming sales and strong brand recognition generates high expectations at the
opening of sale
High sales velocity, with some projects sold out during the launch weekend
37
37
38. Organizational Structure
New Alphaville Structure and Management
CEO
Marcelo Willer
HR Manager
Karine Xavier
Planning
Director
Business
Director
Camillo
Baggiani
Claudia
Yassuda
Commercial /
New Business
Director
Environment /
Foundation
Director
Product
Director
Operations
Director
CFO
Fábio Valle
Giovana Kill
Katia Oliveira
Ricardo Telles
Ricardo
Scavazza
Finance/ I.R.
Director
Controllership
Director
Guilherme
Puppi
Frederico
Barros
38
39. AUSA structure
Leverage the competences of original entrepreneurs and create value
New Directions after the acquisition by
Blackstone and Patria
•
Continued growth, with a focus on profitability to
sustain cash position
•
Blackstone
Increase the efficiency of the most important
processes: Land acquisition and launches
•
Gafisa
Patria
Structuring own Alphaville back office
Fund
Supported by the values of Blackstone and Patria:
•
Long-term shareholders, with owner approach;
•
AUSA
Main business will be preserved and
complemented by the experience of Patria /
Blackstone the real estate market
•
Existing culture and management will be
maintained and strengthened;
•
Financial discipline to increase shareholder value.
Board
Alphaville Team (business)
Patria Executives (finance dept)
Members:
Patria (2)
Blackstone (2)
Gafisa (2)
Executive
Board
39
43. Strategic view
Supplies Dept as responsible for the supply chain
Integrated planning, control and supply chain operation processes to meet the
company’s demands for goods and services, with the best Solution , Specification,
Quantity, Price, Term and Place.
Works
Budget
(w/ Getec)
Market
and
Demand
Mapping
SLA &
Suppliers
Management
Purchases
Logistics
solution
Delivery
Scheduling
Logistics
Operation
•
Long-term planning
•
Material loss reduction
•
Market intelligence
•
Efficiency gains in processes
•
Supply strategy
•
Material consumption control
•
Suppliers liquidity/soundness
•
•
Strategic negotiations
Analysis of budget x consumption
trends (p / floor)
•
Value for shareholders
•
Continuous
improvement
Continuous process improvement
43
44. Results Achieved
Cost and Control Management
Reduction of Contractual Amendments (R$
Price Evolution
mm)
The reduction in contractual amendments reflects
improved management of works.
The price evolution is below the INCC index, both
in specific items and in the basket of items as a
complete work
16%
202
197
14%
12%
10%
4,47%
8%
104
6%
14,2%
42
14,3%
2%
8,1%
3,4%
2010
2011
2012
4%
2013
0%
jan/12
May/12
Sep/12
INCC
jan/13
May/13
Sep/13
BASKET SP
44
45. Results Achieved
Mitigating risks by monitoring suppliers ‘ performance
Company
Construction
PROJECT
safety
quality
2%
3%
13%
20%
10
6
3
0
11%
65%
14%
12%
74%
6% 5%
6% 12%
15%
15%
26%
22%
49%
org. clean.
personnel
consolidated
good
63%
67%
term
bad
terrible
68%
fin. and legal
approved
82%
32%
18%
0%
Category
failed
LIKE BROOKLIN
SCENA LAGUNA
SMART VILA MASCOTE
NETWORK BUSINESS TOWER
MISTRAL
COLORATTO
ENERGY BROOKLIN
GOLDEN OFFICE
DUQUESA
PARQUE ARVOREDO
CENTRAL LIFE GARDEN
AMERICAS AVENUE BUSINESS SQUARE
MUNDI ESPAÇO CERÂMICA
VARANDAS GRAND PARK
CONDESSA - LORIAN BOULEVARD
ÉCLAT
STATUS
RISERVATTO
EASY VILA ROMANA
WEEKEND
IT STYLE HOME E OFFICE/ ZENITH
COSTA DO ARAÇAGY
ONE BROOKLIN
MARA VILLE
NEO SUPERQUADRA
SMART PERDIZES
KINO
ROYAL PARK
FANTASTIQUE CONDOMINIO CLUBE
PARQUE ECOVILLE
ALEGRIA
STATION PARADA INGLESA
VARANDA BERRINI
ALPHA GREEN
IT FLAMBOYANT
PARQUE BARUERI - PHASE 3 (ROUXINOL)
FLOR DO ANANI
ICON BUSINESS & MALL
SMART MARACÁ
STELLATO
VISION ANÁLIA FRANCO
GOLDEN RESIDENCE
VIVERDI
TOTAL:
AVERAGE
9,1
8,4
8,2
7,4
7,3
7,2
7,2
7
6,3
6,3
6,7
6,5
6,4
6,3
6,3
6
5,9
5,9
5,8
5,6
5,5
5,5
5,4
5,3
5,2
5,2
5,1
5,1
4,9
4,7
4,5
4,4
4,1
N/A
N/A
N/A
N/A
N/A
N/A
N/A
N/A
N/A
N/A
43
Supplier
negotiati
ons
2
3
2
2
1
1
5
2
2
1
4
1
3
3
4
5
3
PdA
Nº of
assessments
6
6
11
3
4
2
6
4
3
22
14
5
8
20
16
3
13
11
12
13
14
13
13
5
15
12
13
9
9
17
10
14
14
ADHERENCE
80%
70%
60%
50%
40%
30%
20%
10%
0%
jan
mar
mai
jul
set
nov
TOTAL ASSESSED AND AVERAGES
400
10
350
9
8
300
7
250
6
200
5
150
4
3
100
2
50
0
44
1
0
340
45
46. SSC – Shared Services Center
Scenarios
World
Brazil
• Concept created in the
60s and implemented in
the 80s by GE and HP.
• Nowadays approximately
900 SSCs operate in the
World in various
segments.
Industrial
21%
Other
27%
consumpt
ion
16%
Retail
10%
IT
Telecom
13%
Other
9%
• Since 2000, Brazil follows the
strong trend in the
implementation of SSCs in
various segments.
• In 2012 Brazil is home to
approximately 100 SSCs.
Telefônica,
Bradesco, Ambev,
Grupo CCR
Eastern
Europe
42%
USA
Canada
32%
BRF, Fiat, Gerdau, Telemar,
Pão de Açúcar, FEMSA,
Pernambucanas, Ipiranga,
MRV, WalMart, Odebrecht
Financial
13%
Segment
Latin
America
17%
PDG, Natura, GOL, EBX, Randon,
Marfrig, LUFT, Itapemirim,
GAFISA, Hospital São Camilo,
Vale, BRMALLS, ALL, Petrobras,
Endesa, Metodista, Estácio,
CPFL, Brasken, MRS
Camargo
Correa
1998
2003
2008
2013
Companies in the segment that have
implemented SSC : Camargo Correa, MRV,
Tecnisa, JHSF, Odebrecht, BR Malls, PDG.
Region
* Data extracted from Deloitte / TOTVS / Accenture consulting firms
46
47. SSC Gafisa
Management, Control and Innovation
Implementation
Stabilization
Maturing
Evolution
Sep/11
Oct/11
Aug/12
Feb/13
Oct/13
Registration
Accounts Payable
Bank Controls
Accounting
Fiscal
Accounts Receivable
Gafisa Credit
Tenda Credit
Gafisa Bookkeeping
Staff Adm.
Condominium/IPTU
Gafisa and Tenda CRC
Facilities
Tenda Collections
Contracts
Barueri Move
(R$2MM/year savings)
Administrative Legal Work
Tenda Collections CRC
Tenda scheduling CRC
Cost
KPIs
SSC Benefits:
Focus on activities
Volumetry *:
GENERAL
Volume
Headcount
Headcount productivity
Service Level
* 2012: Volume and ANS – Year
average; HC – Position Dec/12
Compliance
2012
33.000
242
136
96.90%
Target 2013
4.92
13.14
30.65
49.61
2012
5.22
15.71
32.03
66.47
Oct/13
33.660
172
196
99.44%
15.21
13.78
Cost per Transaction:
Target 2013:
Areas (example)
Accounts Receivable
Payments
Fiscal
Staff Adm.
SLA
12.84
SAVINGS: R$ 6 MM
Alphaville Challenge
Standardization
Growth in the
number of
activities with
Productivity
gains
Volumetry Driver:
write-offs in the SAP system
Payments made
Calculated / collected taxes
Collaborators
47
48. Next Challenges
Innovation
1
SPIN OFF OF
ALPHAVILLE BUSINESS UNIT
2
TURNOVER
• Impact already mapped
• Assimilation of new activities
• Higher productivity at lower cost
• Ensure there is no impact for Tenda and Gafisa
48
50. Highlights and Recent Developments
Paving the Way to Profitability
Strengthening the capital structure
Dividend / Interest on capital & Buyback Program
Alphaville
• Completion of the sale of 70% of
AUSA in December/2013
• Total sale value of R$ 1.54 billion
• Estimated result of the
transaction is R$ 458.6 million
New Capital
Structure
Gafisa
• Focus on SP + Rio
• Profitability track record in
strategic markets
• Solved Legacy (1H14)
• Generation of positive
operating cash flow in 9M13
R$ 69 million
Financial Flexibility
Tenda
• Resumption of launches under
the New Model.
• Closure of the legacy in 2013
• Generation of positive operating
cash flow in 9M13 R$ 355
million
Generating
Shareholder Value
50
51. Capital Structure
Level of indebtedness appropriate to operations
Net Debt
Net Debt / Equity (%)
3,245
2,858
2,519
2,396 2,456
96.2%
89.0% 93.0%
83.8%
1,247
2008
1,424
2009
1,423
1,201
2010
2011
2012
1Q13
2Q13
3Q13
126.0%
118.1%
3Q13
Pós
Post
Deal
Deal
2008
65.3%
59.8%
47.8%
2009
2010
2011
2012
1Q13
2Q13
3Q13
•
48% reduction in leverage level (net debt/equity)
•
The sharp drop in Gafisa’s indebtedness allows for a reduction in its financial costs
and a lower perception of risk, providing reduction in the Company’s funding costs.
3Q13
Pós
Post
Deal
Deal
52. Capital Structure
Indebtedness structure linked to projects
Debt Profile
2,171
1,845
Corporate Debt and Investor Obligations
Total Debt + Obligations
2,004
4,174
1,794
3,639
Project Finance (% of total debt)
52%
51%
Corporate Debt (% of total debt)
•
3Q13
Project Finance
Leverage fell from 126% in 3Q13
to 48% in Dec/13
3Q12
48%
49%
Partial use of AUSA resources for
amortization of corporate debt R$
700M
•
New indebtedness profile best suited
to the operating cycle of the
Company.
•
Reduction in the Projects/Corporate
Debt ratio estimated for 2014 58%
•
Perspective of reduction in the
capital cost before this lower risk
scenario
(R$ million)
Indebtedness Historical Breakdown
47.2%
45.3%
43.1%
48.5%
47.4%
52.8%
54.7%
56.9%
51.5%
52.6%
2011
2012
1Q13
1T13
2Q13
2T13
3Q13
3T13
Financiamento
Project Financing
Dívida Corporativa
Corporate Debt
52
53. Financial Flexibility
Operating Cash Generation and Liquidity
Receivables
Inventory at
market value
Total
Costs incurred
3,377
1,000
4,377
1,864
715
2,579
5,241
1,715
6,956
1,561
264
1,825
Gafisa
Tenda
Total
Solid operating cash
generation in the last 2
years → R$ 1.3 Billion
R$ milhões
Operating Cash Flow – Gafisa and Tenda
Gafisa and Tenda
1.000
877
900
800
700
600
500
400
300
200
100
0
-100
423
389
292
203
135
194
94
-7
1T12 2T12 3T12 4T12 2012 1T13 2T13 3T13 9M13
Inflows
Sales Revenue
Transfers
Land
Other
Outflows
Construction
Incorporation + Sales
Land
Taxes + G&A+ Other
Operating Cash Flow
2012
3,851
1,336
2,141
193
182
-2,975
-1,714
-422
-261
-578
877
9M13
2,439
863
1,386
21
168
-2,015
-1,041
-276
-261
-438
423
L21M
6,290
2,199
3,527
214
350
-4,990
-2,754
-698
-522
-1,016
1,300
53
54. Financial Flexibility
Costs & Expenses Structure
•
Final cycle of the turnaround process
•
Operational complexity reduction
Improved Performance
Operational Efficiency
•
Consolidation in strategic markets
•
Efficient processes and cost management
Cost Reduction
20%
16%
12%
8%
11%
12%
9%
8%
Gafisa Consolidated
9%
7% - 8%
Peers
4%
0%
2011
2012
3Q13
2014
2015/16
54
55. Profitability
Medium Term Expected profitability
Less Employed
Capital
Focus on Rio + SP
Higher Gross
Margin Segment
Long Cycle
Less Working Cap.
ROCE
14% – 16%
Lower Gross Margin
Segment
Short Cycle
Fast Working Cap.
55
56. Corporate Governance
True corporation listed in NY and Governance benchmark
•
•
Installed Fiscal Council
•
Senior officers with over 20 years experience in the
segment
•
100%
Audit, Compensation, Appointments and
Governance Committees are composed by
independent members of the Board of Directors
•
30%
Board of Directors mostly independent
(8 ouf of 9)
100% common shares (Novo Mercado)
•
100% free float
•
100% tag along
•
Only real Estate company listed in the New York
Stock Exchange (NYSE)
•
Principles and Guidelines on Corporate Governance
for the Management statutorily defined.
56
57. 2013
2013 Compliant Guidance
Consolidated Data
1Q13
2Q13
3Q13
9M13
Launches
307,553
461,043
498,348
1,266,943
Sales
218,281
553,639
428,994
1,200,914
1,300
3,373
3,106
7,779
Deliveries
4Q13*
YTD*
Launches
1,431.452
2,698,396
Sales
1,097,531
2,298,445
3,759
11,400
Deliveries
2013 expectation with
numbers aligned with the
Company’s expectation.
* Info until 12/15
57
58. Wrap Up – Market Target
Gafisa x Turnaround x Premium Peers
Leverage
P / BV Segment Historic
1.6x
118%
1.5x
1.4x
103%
96%
90%
82%
0.8x
51%
47%
P/BV Gafisa
1.5x
0.9x
48% 48%
0.7x 0.7x
0.6x
0.7x
0.7x
0.7x
0.8x
0.7x
0.6x
2011
2012
Turnaround Peers
3T13
Premium Peers
2011
Gafisa
Gross Margin
2012
Premium Peers
3T13
Turnaround Peers
Gafisa
Price to Book Value – Gafisa + Tenda
Market Cap Gafisa – 12/17
28%
28%
25%
30%
26%
Avaliação de 30% de Alphaville
24%
2011
2012
Gafisa
3T13
Média L24M
R$ Million
1,522
510
Market Cap Gafisa (Net of 30% of Alphaville)
1,012
Book Value Gafisa – 3Q13 Post Deal
2,978
19%
16%
9%
Book Value Stake Alphaville (30%)
160
Book Value w/out Alphaville
2011
Turnaround Peers
2012
Premium Peers
3T13
2,818
Price to Book Value / Gafisa + Tenda
0.36x
Gafisa
* 3Q13 pro forma post-deal (12/09 press release )
* Bloomberg, period average
58
60. Wrap Up
STRATEGIC
POSITIONING
LESS COMPLEXITY
•
Operation
Management and
Control
•
Legacy problems are
in the past
•
•
•
Focus on more
profitable markets
Profitability and
Capital Discipline
NEW CAPITAL
STRUCTURE
•
Proper leverage
•
Improved liquidity
and lower cost of
capital
New Tenda Model
60