Download to read offline


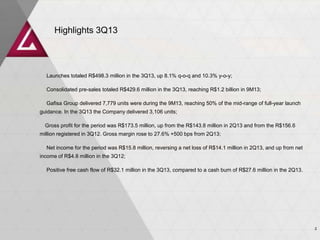
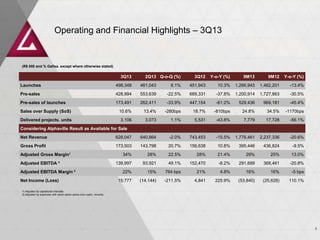
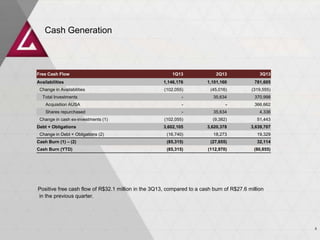
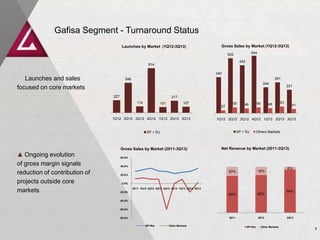

Gafisa reported financial and operating results for 3Q13. Key highlights included: - Launches totaled R$498 million in 3Q13, up 8.1% q-o-q and 10.3% y-o-y. - Consolidated pre-sales reached R$1.2 billion in 9M13. - Net income was R$15.8 million in 3Q13, reversing a net loss in 2Q13. - Positive free cash flow of R$32.1 million in 3Q13, compared to a cash burn in 2Q13.


