Download as PDF, PPTX


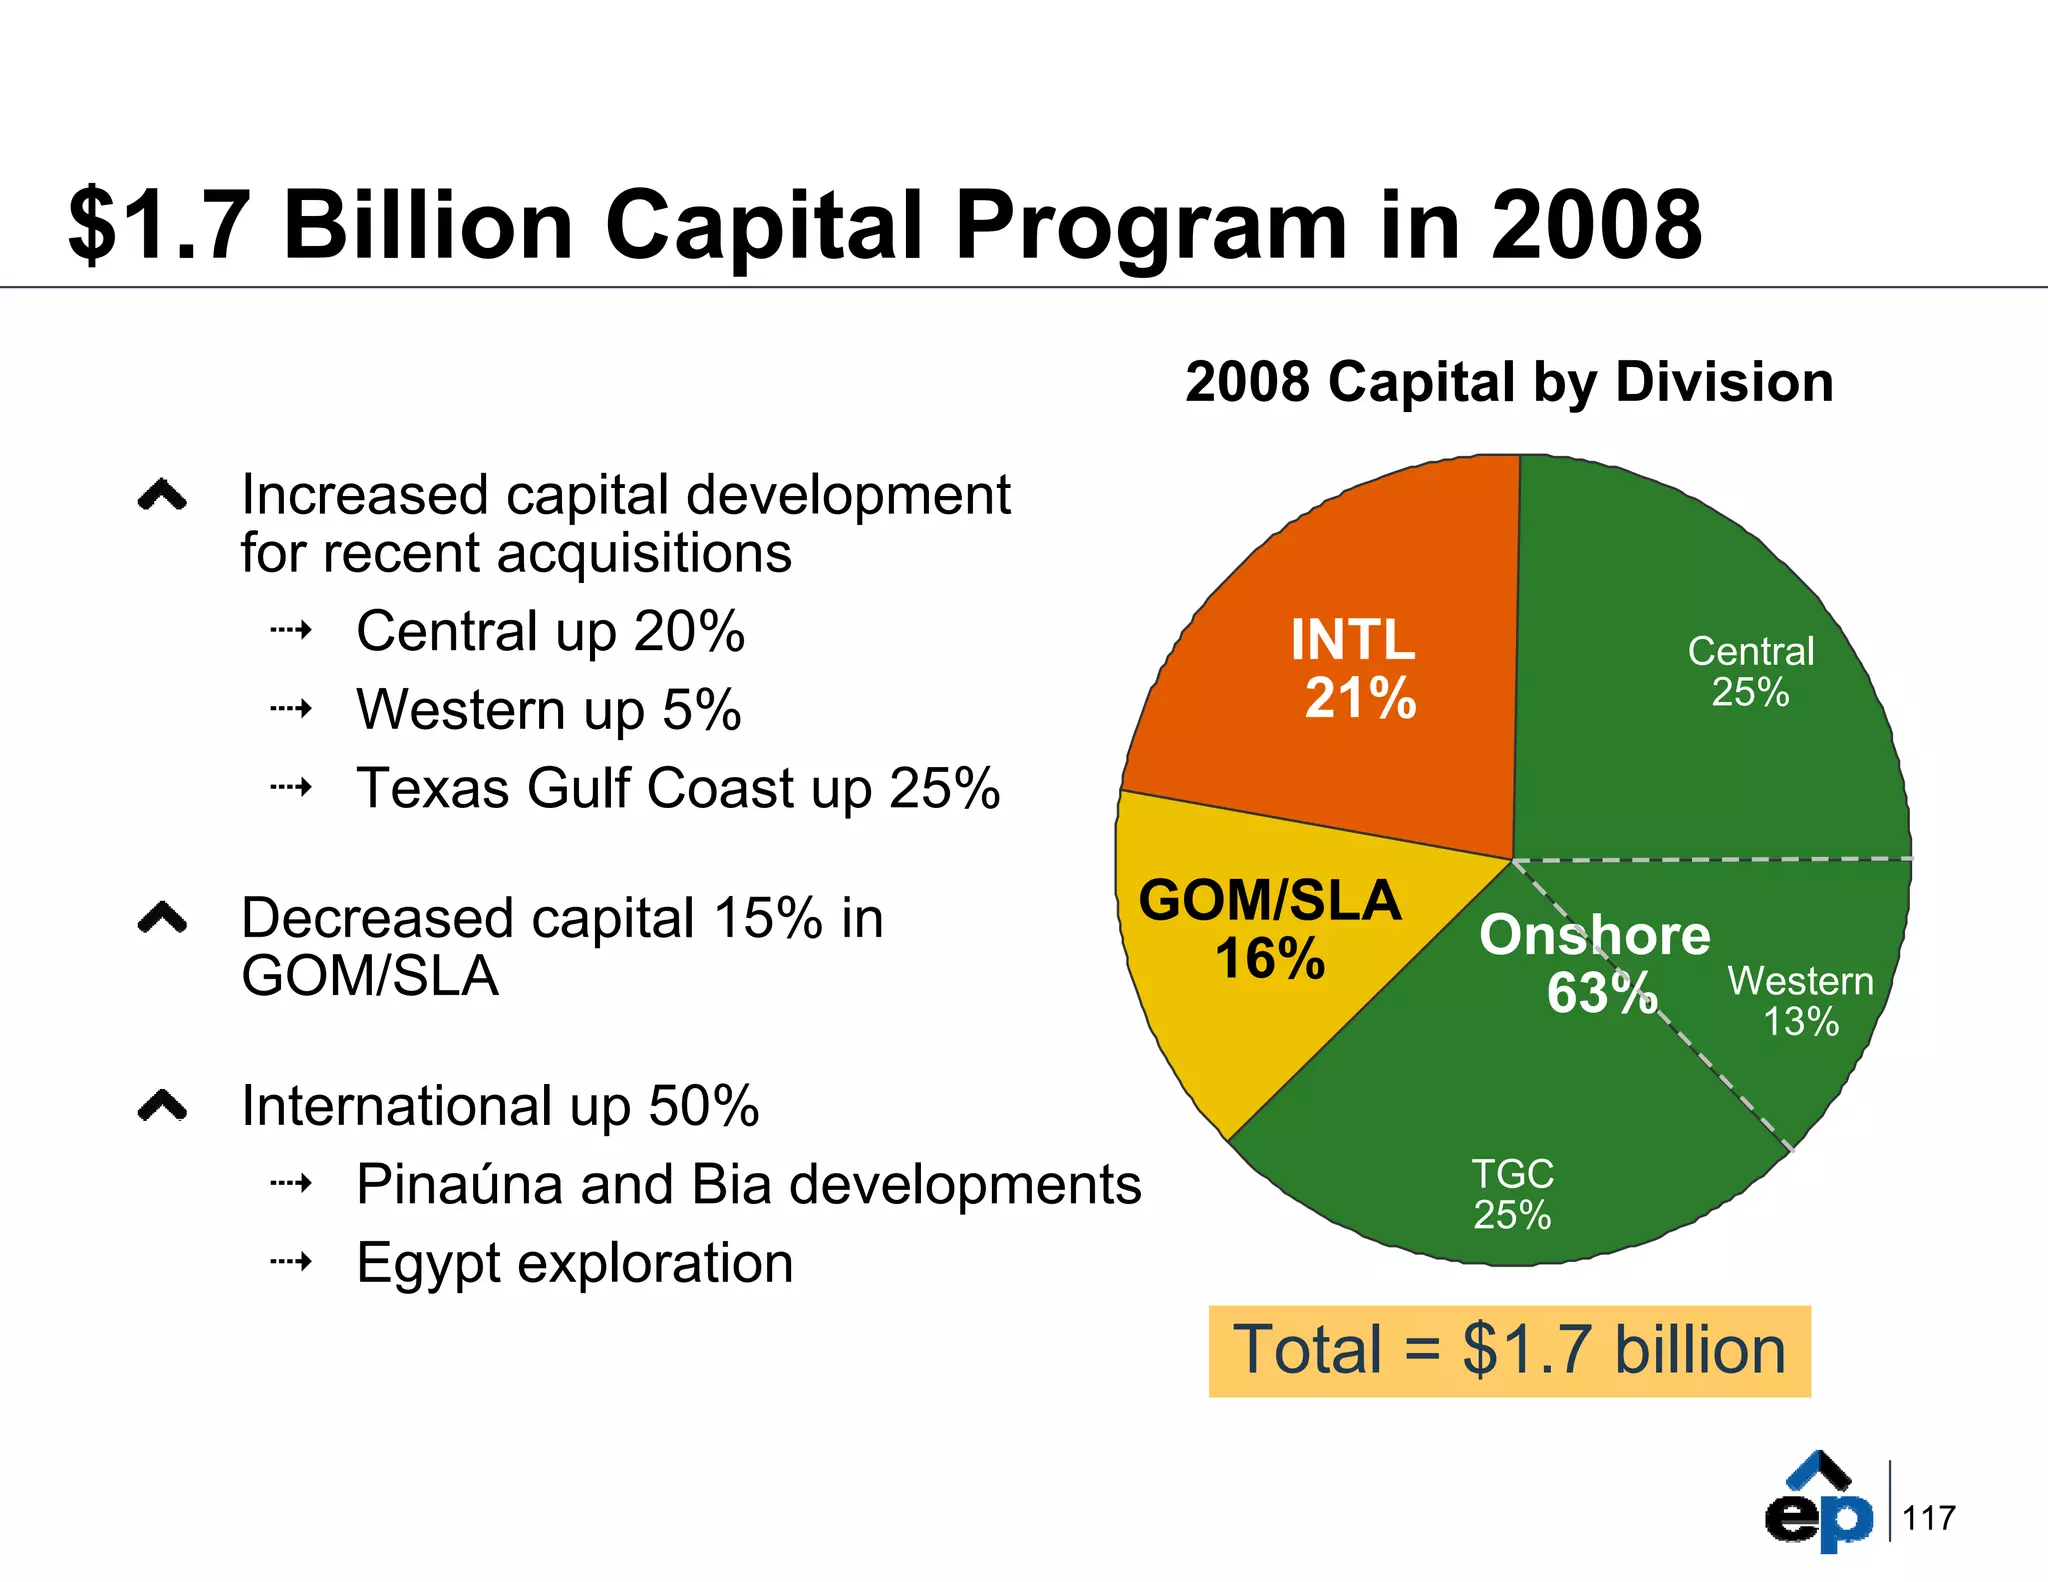
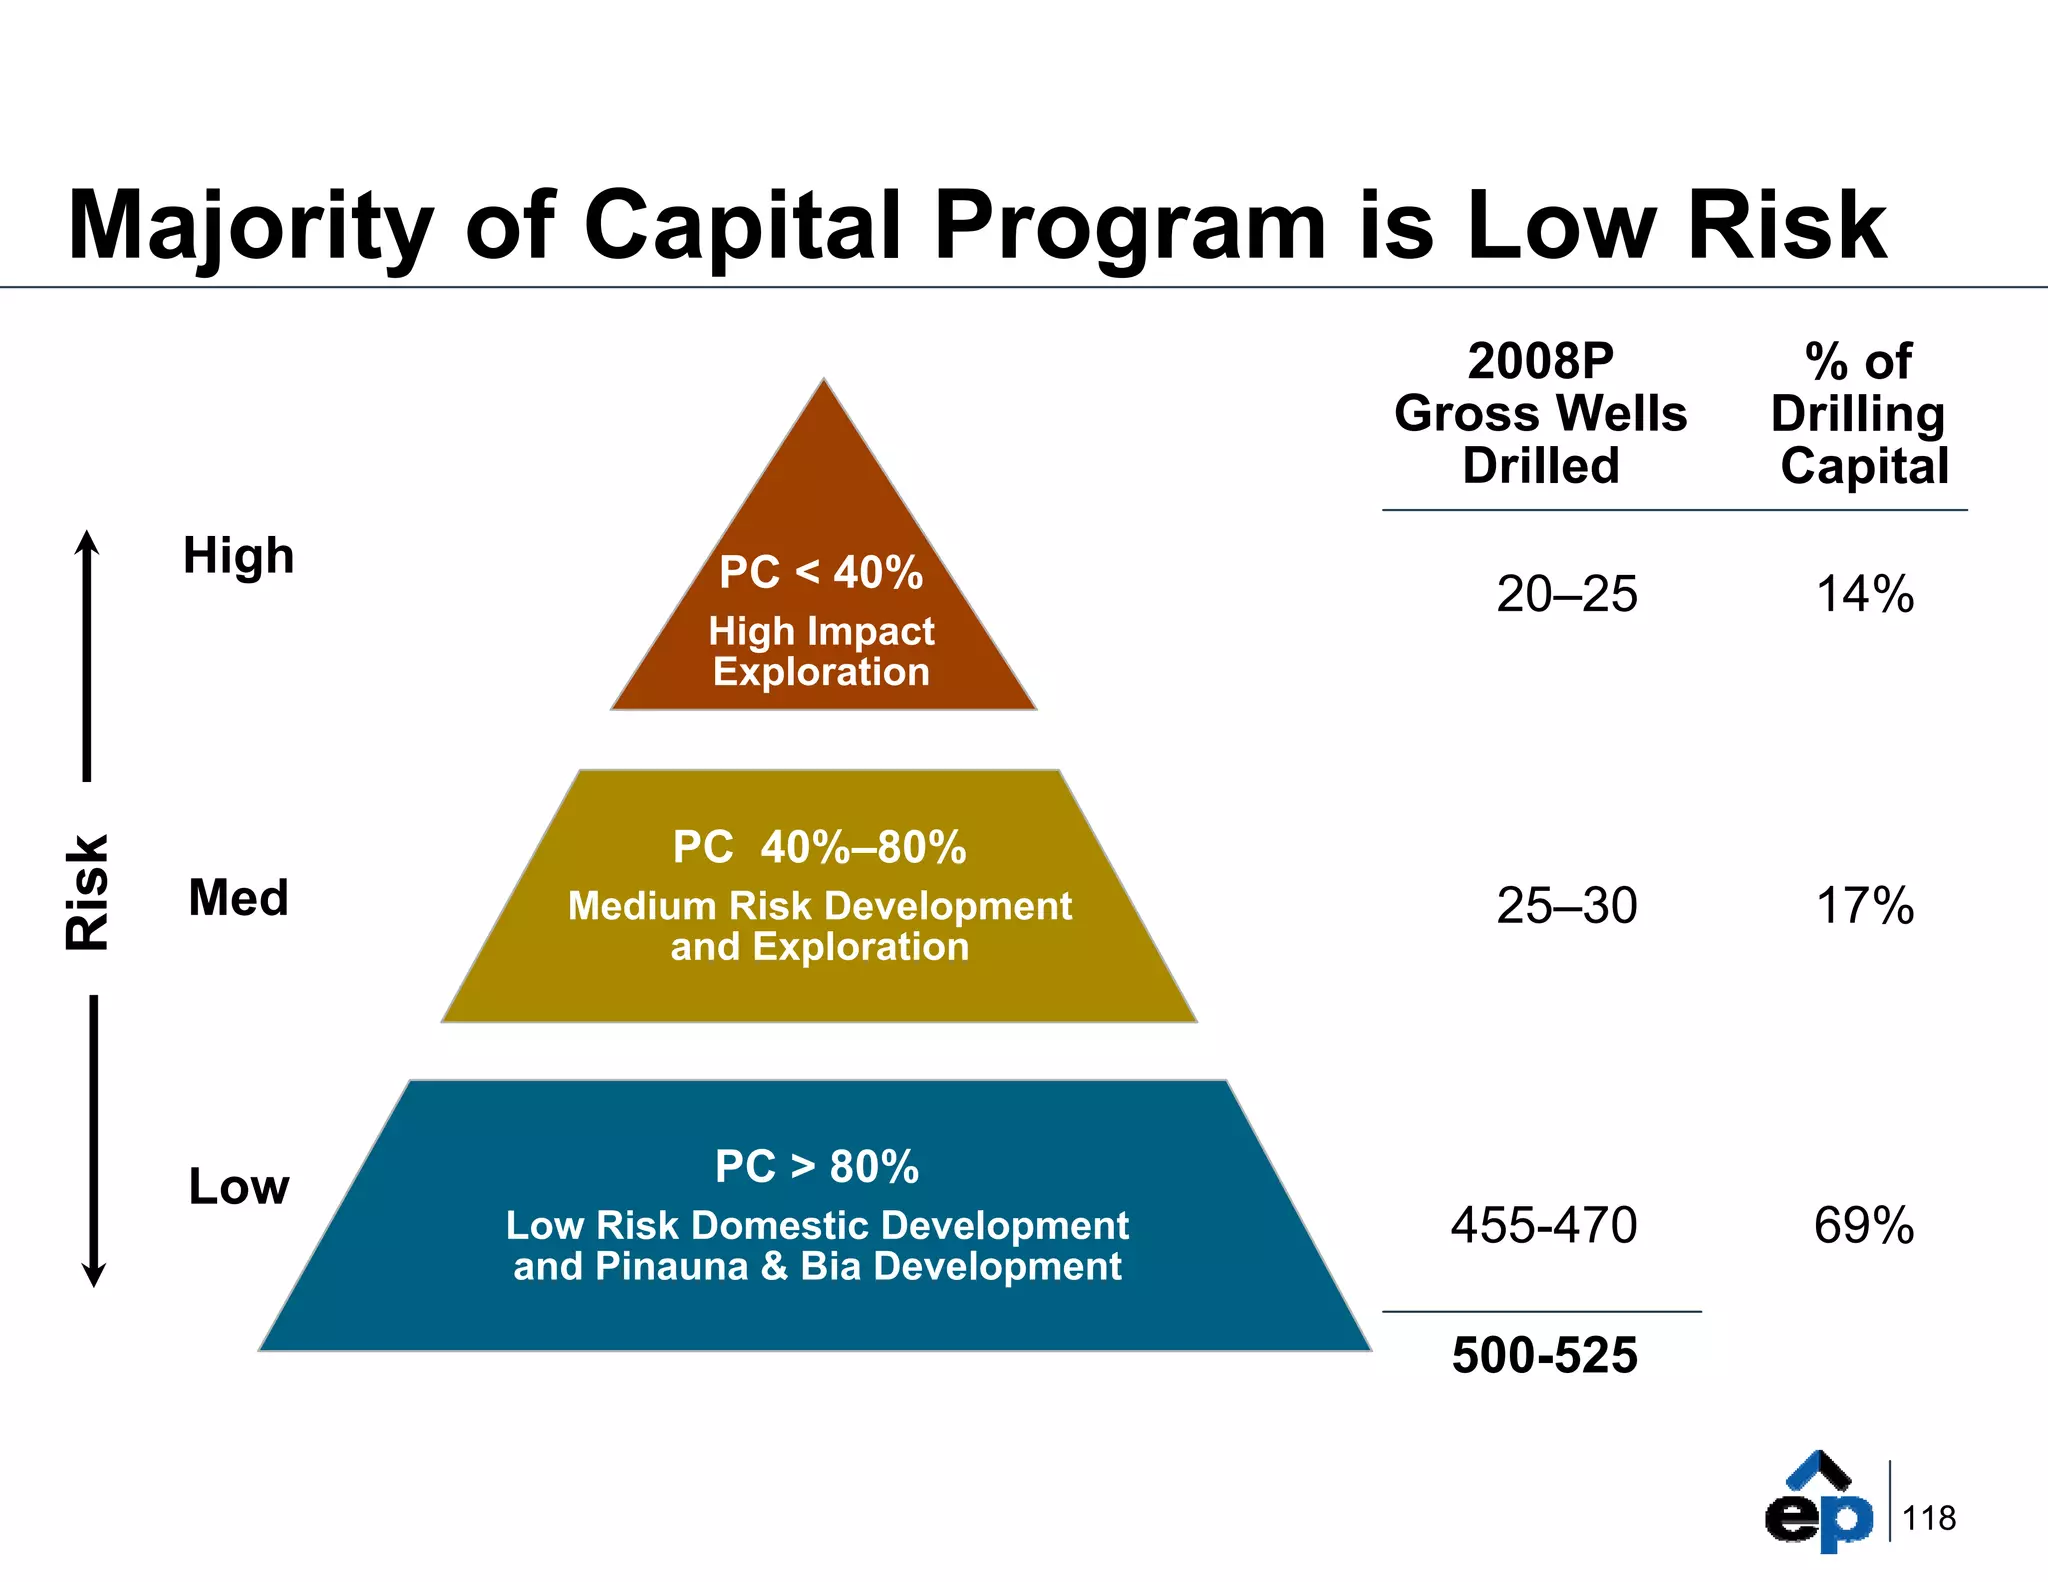
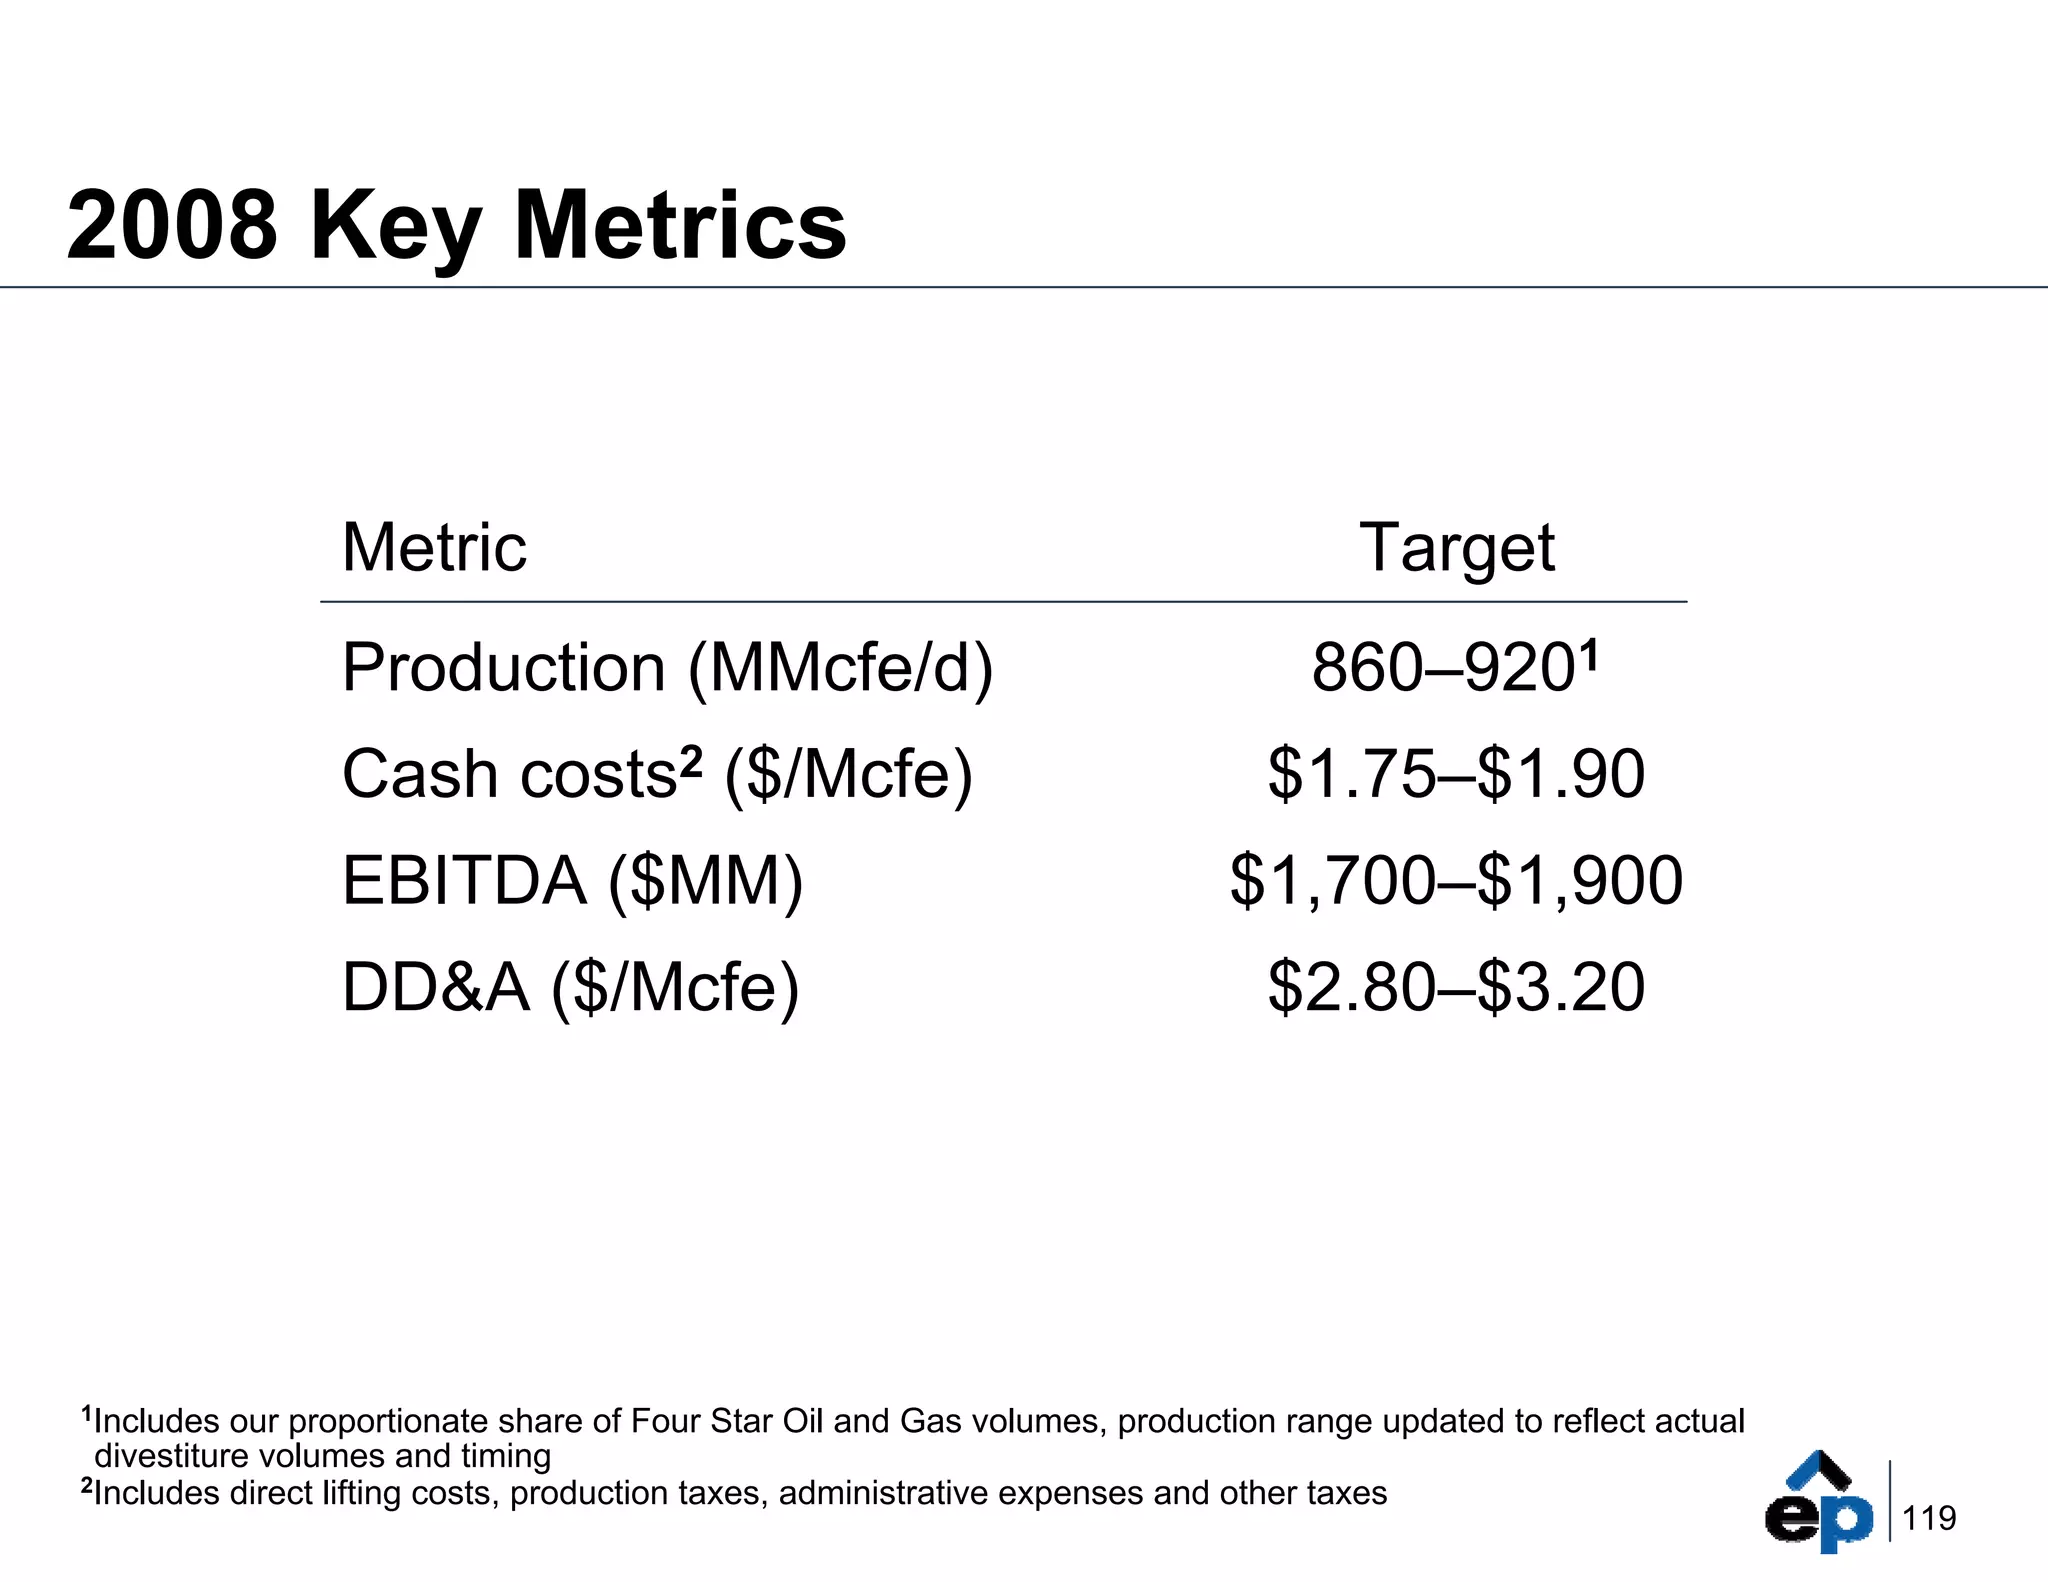
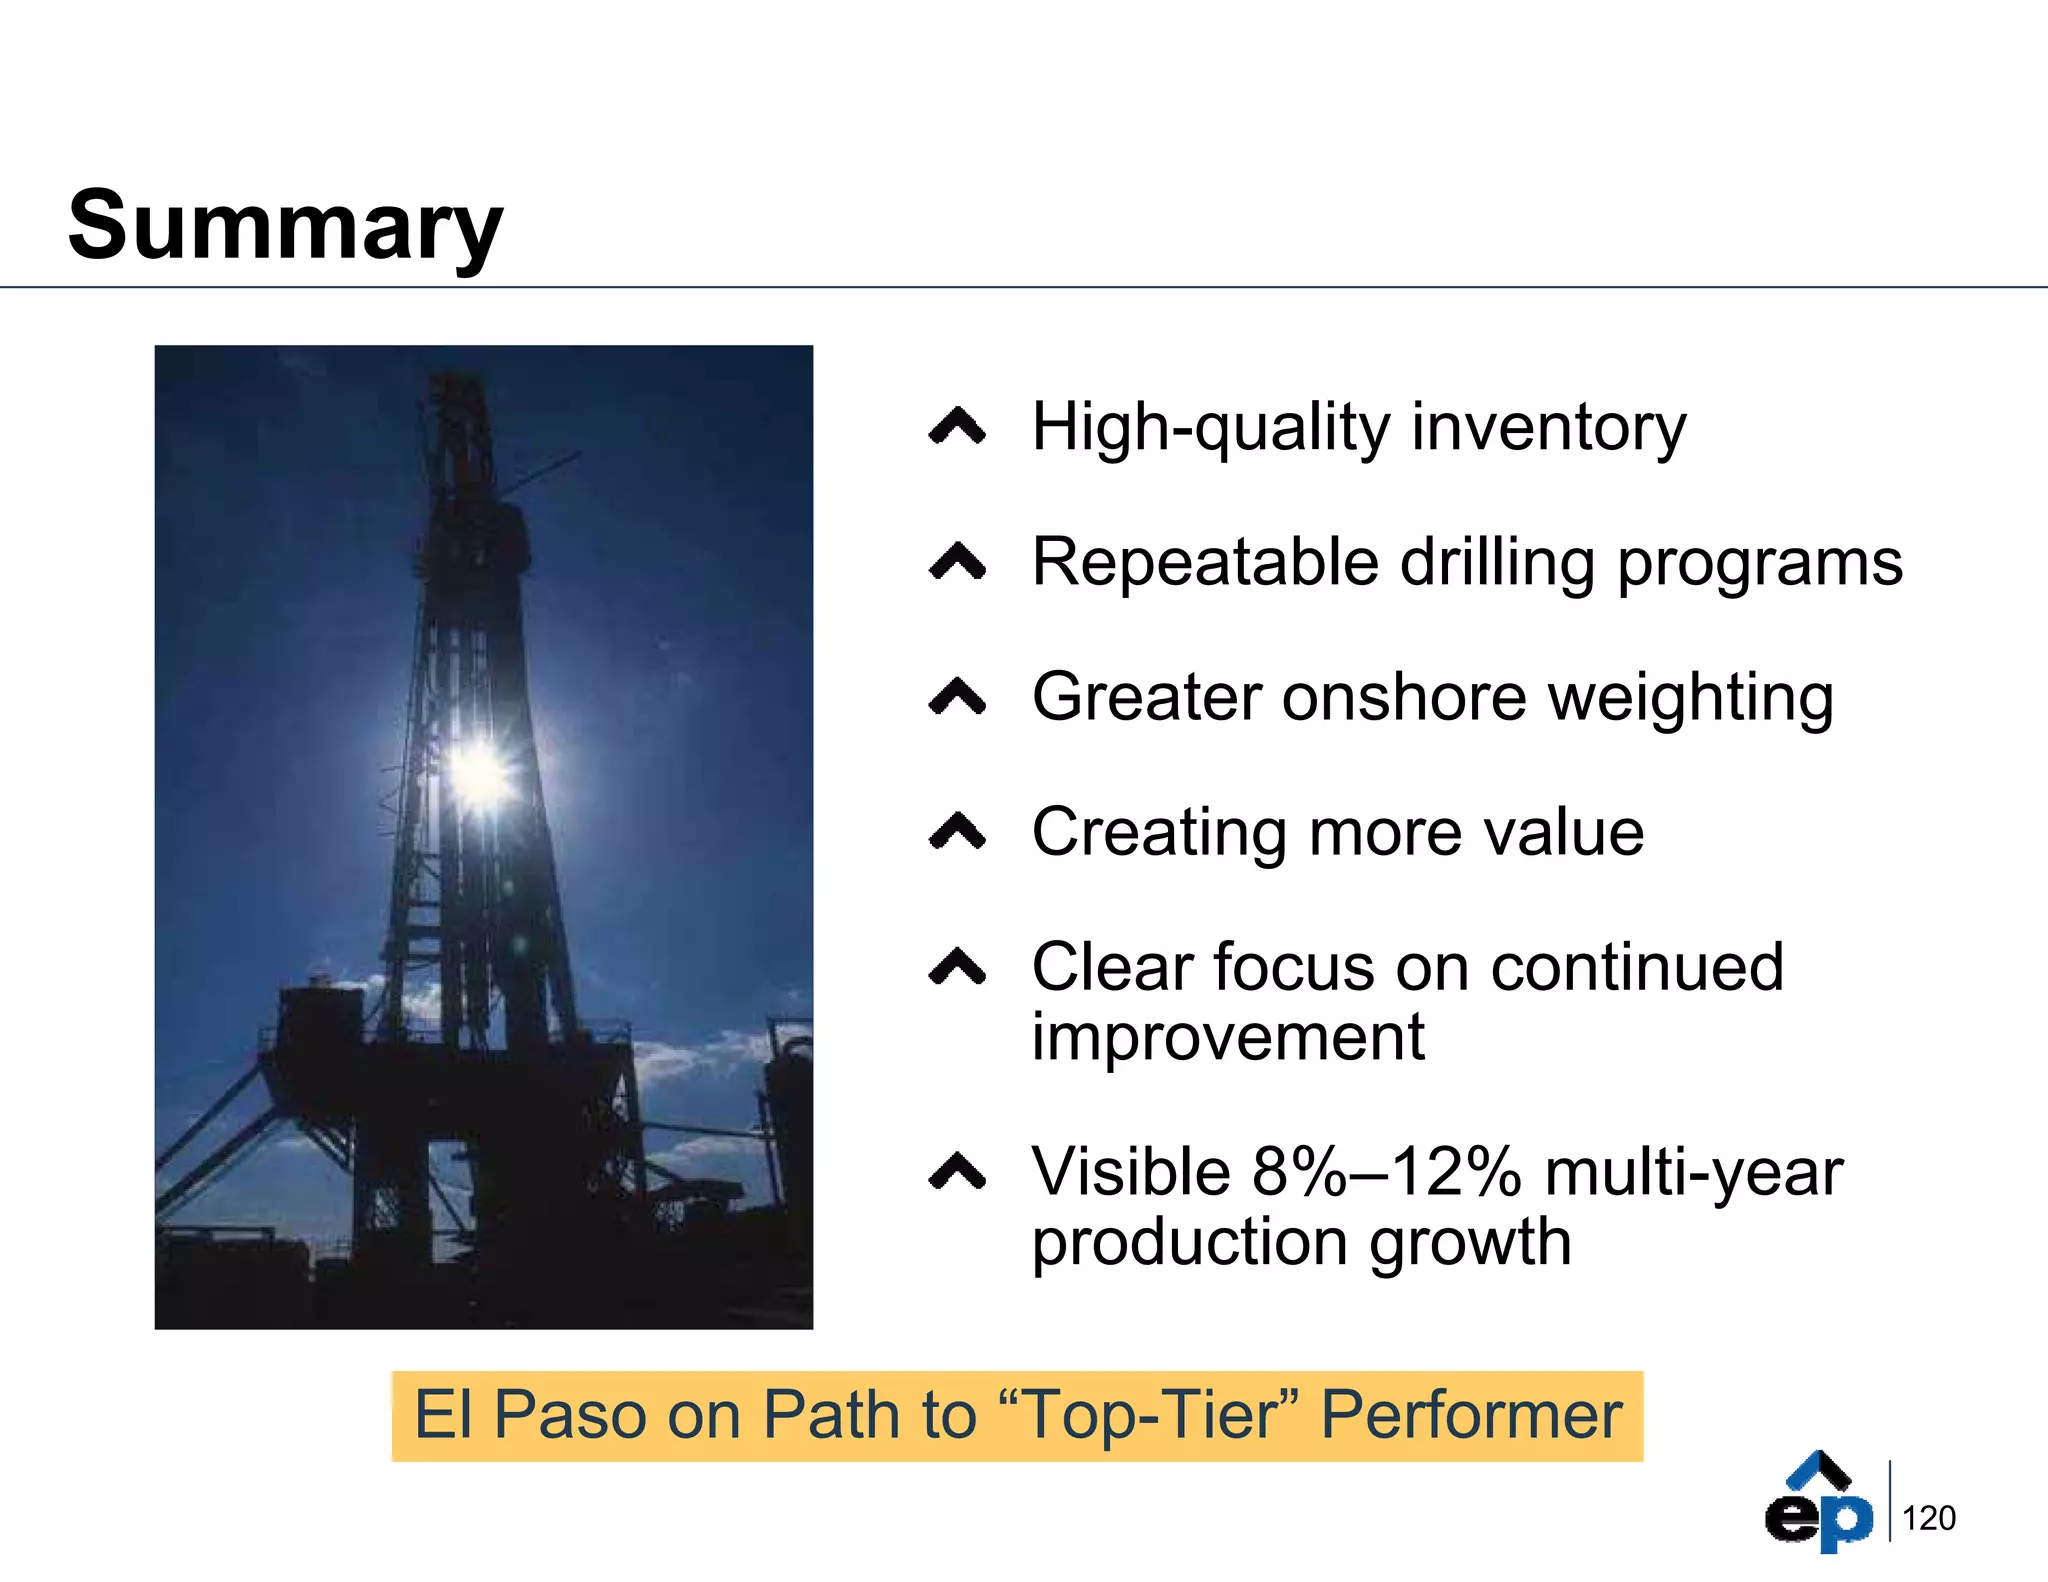


This document provides an outlook and strategic focus areas for El Paso Corporation in 2008. It aims to accelerate the company's progress toward becoming a "top tier" performer by completing divestitures, achieving production targets, growing non-proved inventory, and improving capital and expense efficiency. The majority of El Paso's $1.7 billion capital program is directed toward lower risk domestic development and international projects. Key metrics for 2008 include targeted production of 860-920 million cubic feet equivalent per day and EBITDA of $1.7-1.9 billion. The outlook emphasizes high-quality assets, repeatable drilling programs, greater onshore weighting, value creation, and continued operational improvement to enable visible multi-year production growth


