Download to read offline
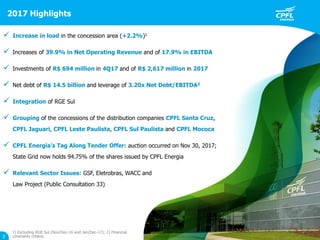
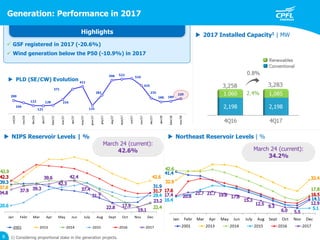
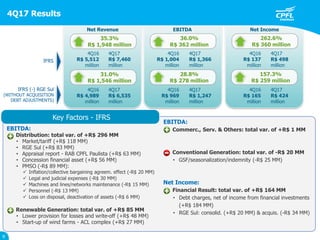
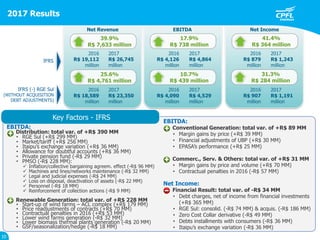
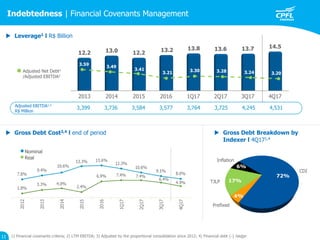

This document provides an overview of 4Q17/2017 results for an unnamed company. Some key highlights include: - Net income increased 35.3% in 4Q17 and 39.9% for 2017. EBITDA also increased significantly. - Sales increased in the company's concession area due to higher demand and acquisitions. - Investments totaled R$694 million in 4Q17 and R$2.6 billion in 2017 to expand and maintain infrastructure. - Generation performance was impacted by lower reservoir levels and wind generation below expectations.


![[ls머트리얼즈]LS Materials 417200 Algorithm Investment Report](https://cdn.slidesharecdn.com/ss_thumbnails/lsmaterials417200algorithminvestmentreport-260202182715-66072c7b-thumbnail.jpg?width=640&height=640&fit=bounds)


