
Downloaded 15 times


![Photoelectrochemical degradation of salicylic acid (C6H4(OH)COOH) in
single reactor
At working electrode
(Fe 2 O 3 )O + hν ⇒ e- + h+ + Fe O
1) Fe
2
3
2
3
2)
3)
e- + h+ ⇒ heat (recombination)
h+ + OH- ⇒ •OH
4)
C6H4(OH)COOH + •OH ⇒ [C6H4(OH)COOH ]*
5)
[C6H4(OH)COOH ]* + •OH ⇒ H2O + CO2 ↑
6)
HO• + HO• ⇒ H2O2
7)
H2O2+ 2h+ ⇒ O2 + 2H+
At counter electrode
1)
e - + O 2 ⇒ O 2-
2)
2 H + + O 2- ⇒ H2O
17](https://image.slidesharecdn.com/296mahadik-131210101055-phpapp02/75/296-mahadik-17-2048.jpg)
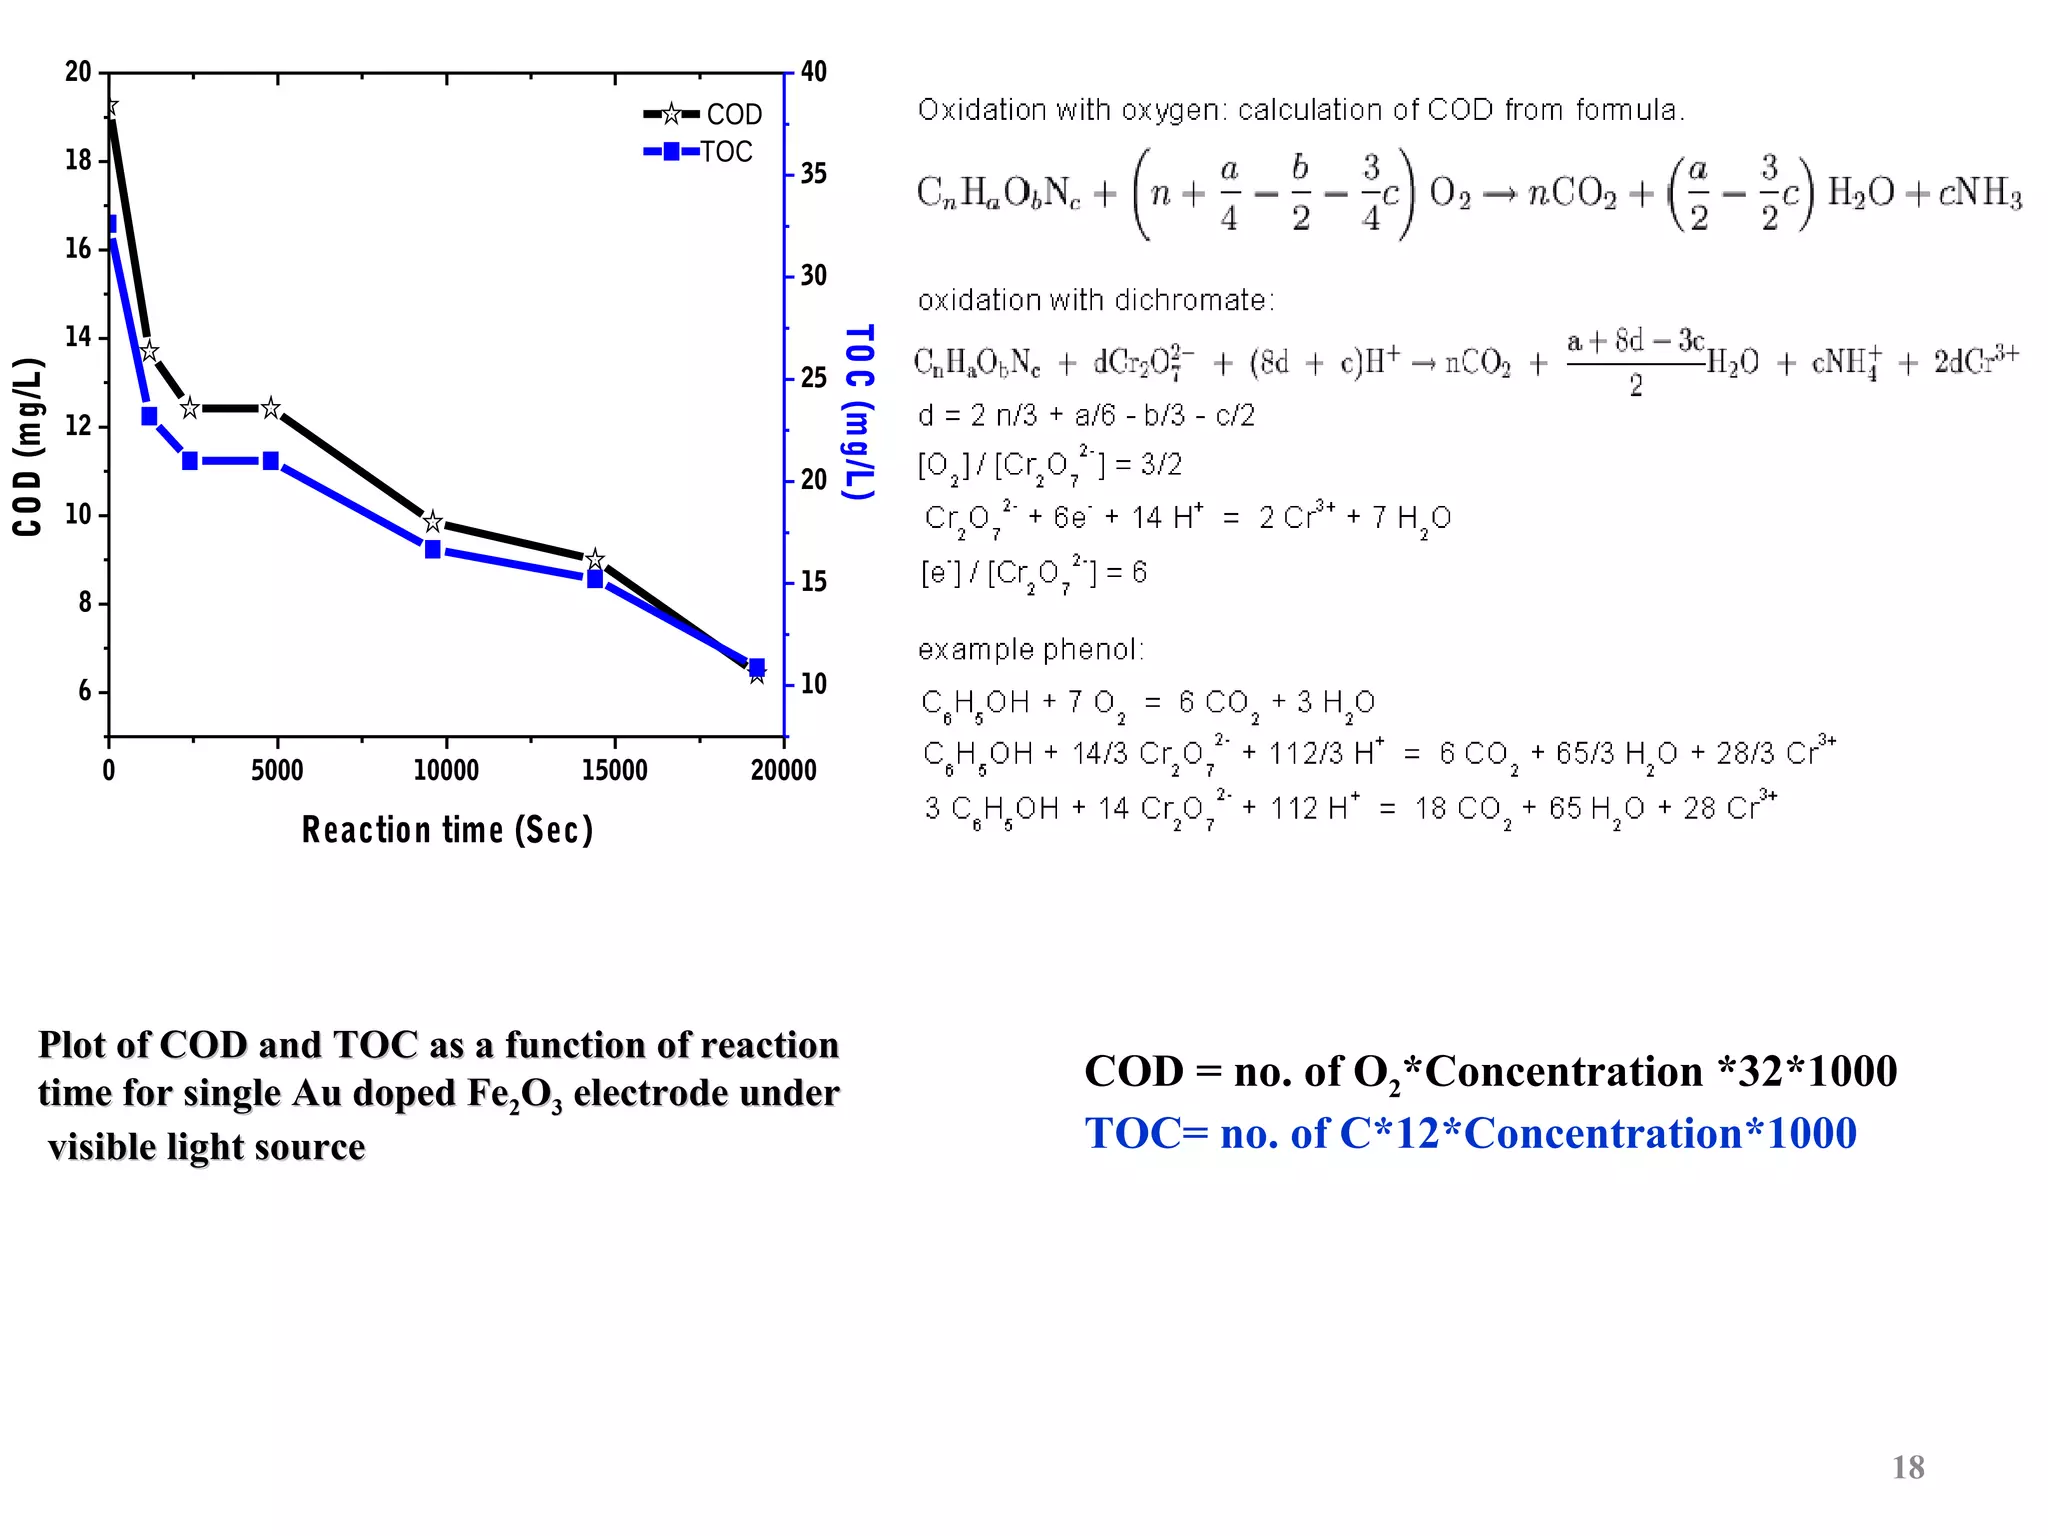
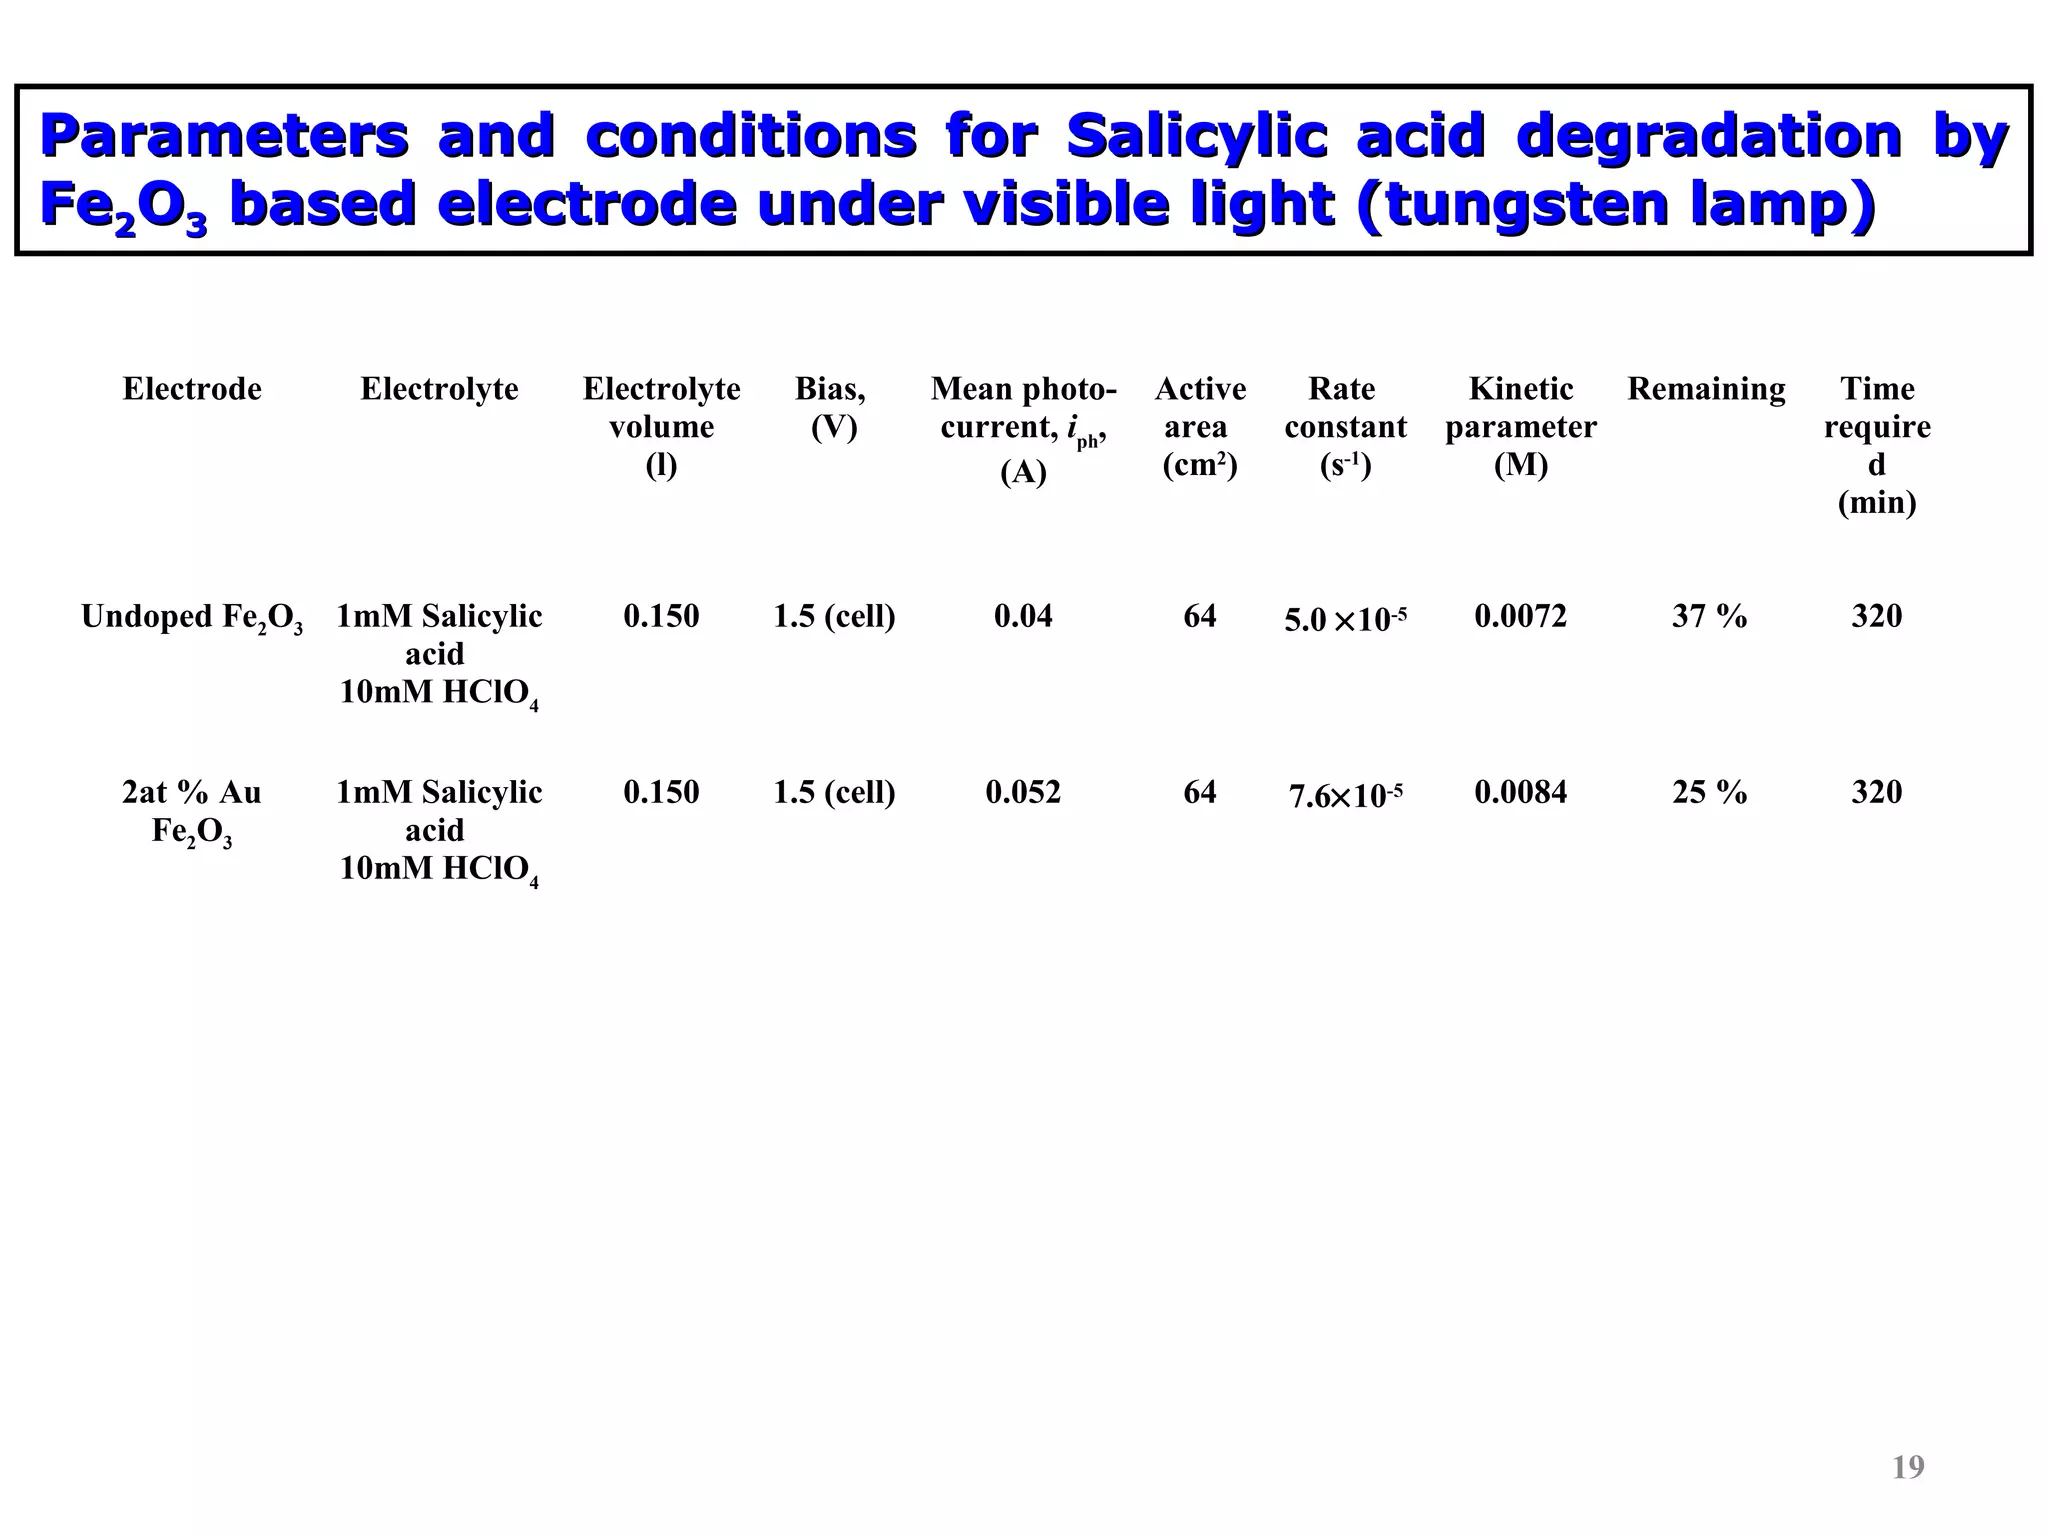


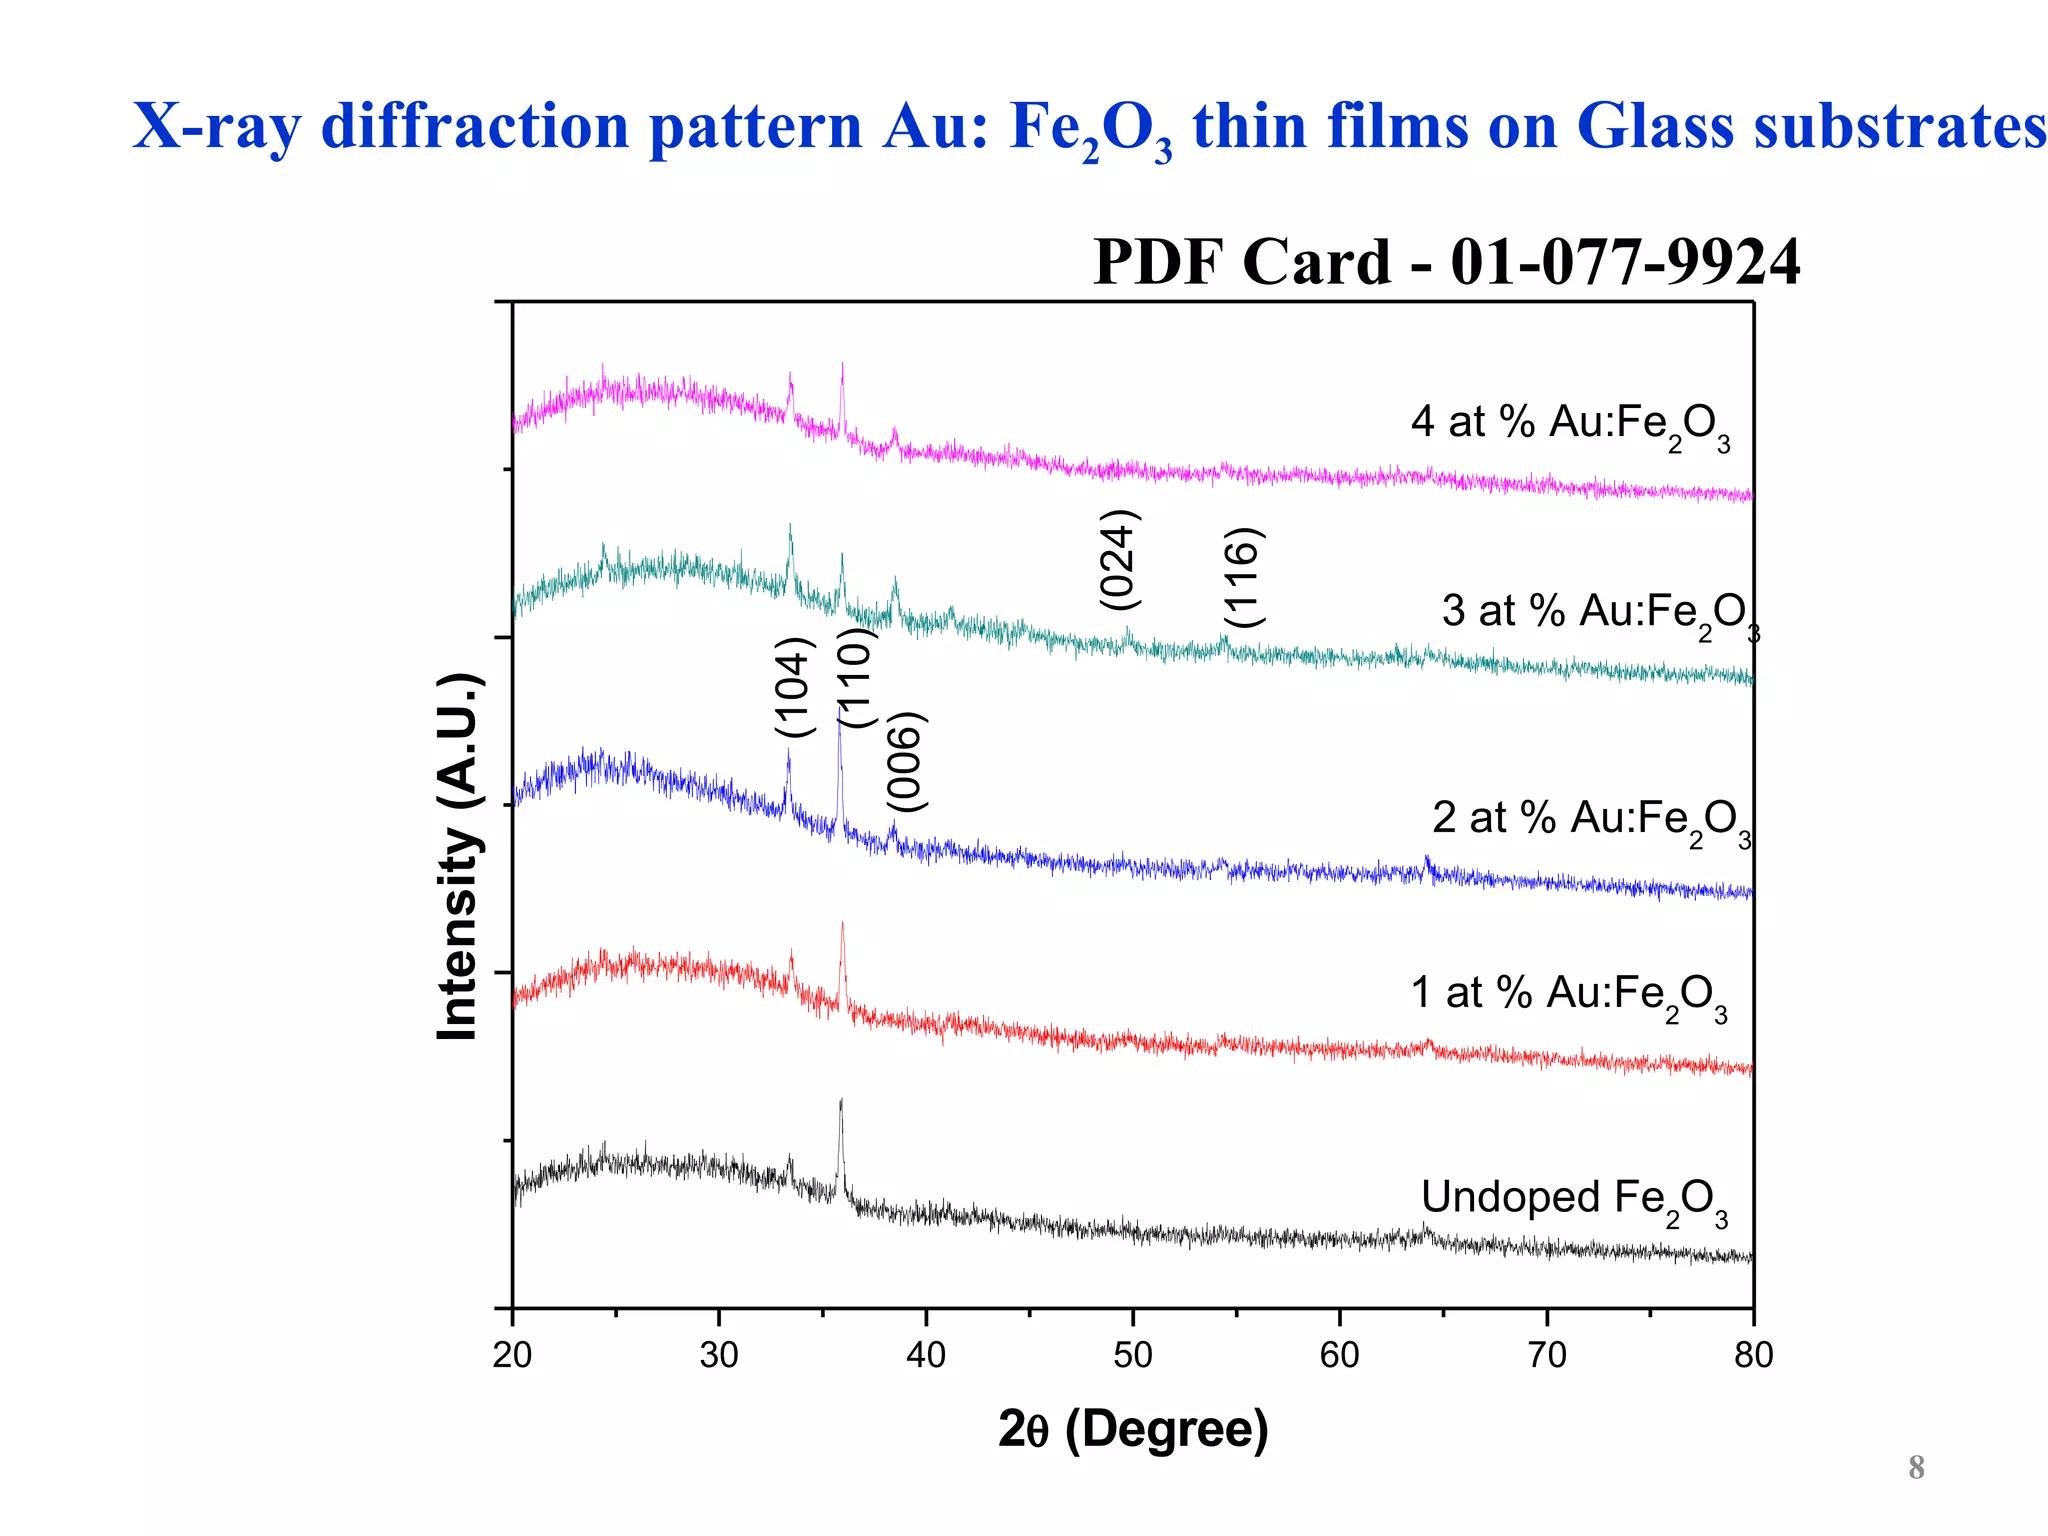
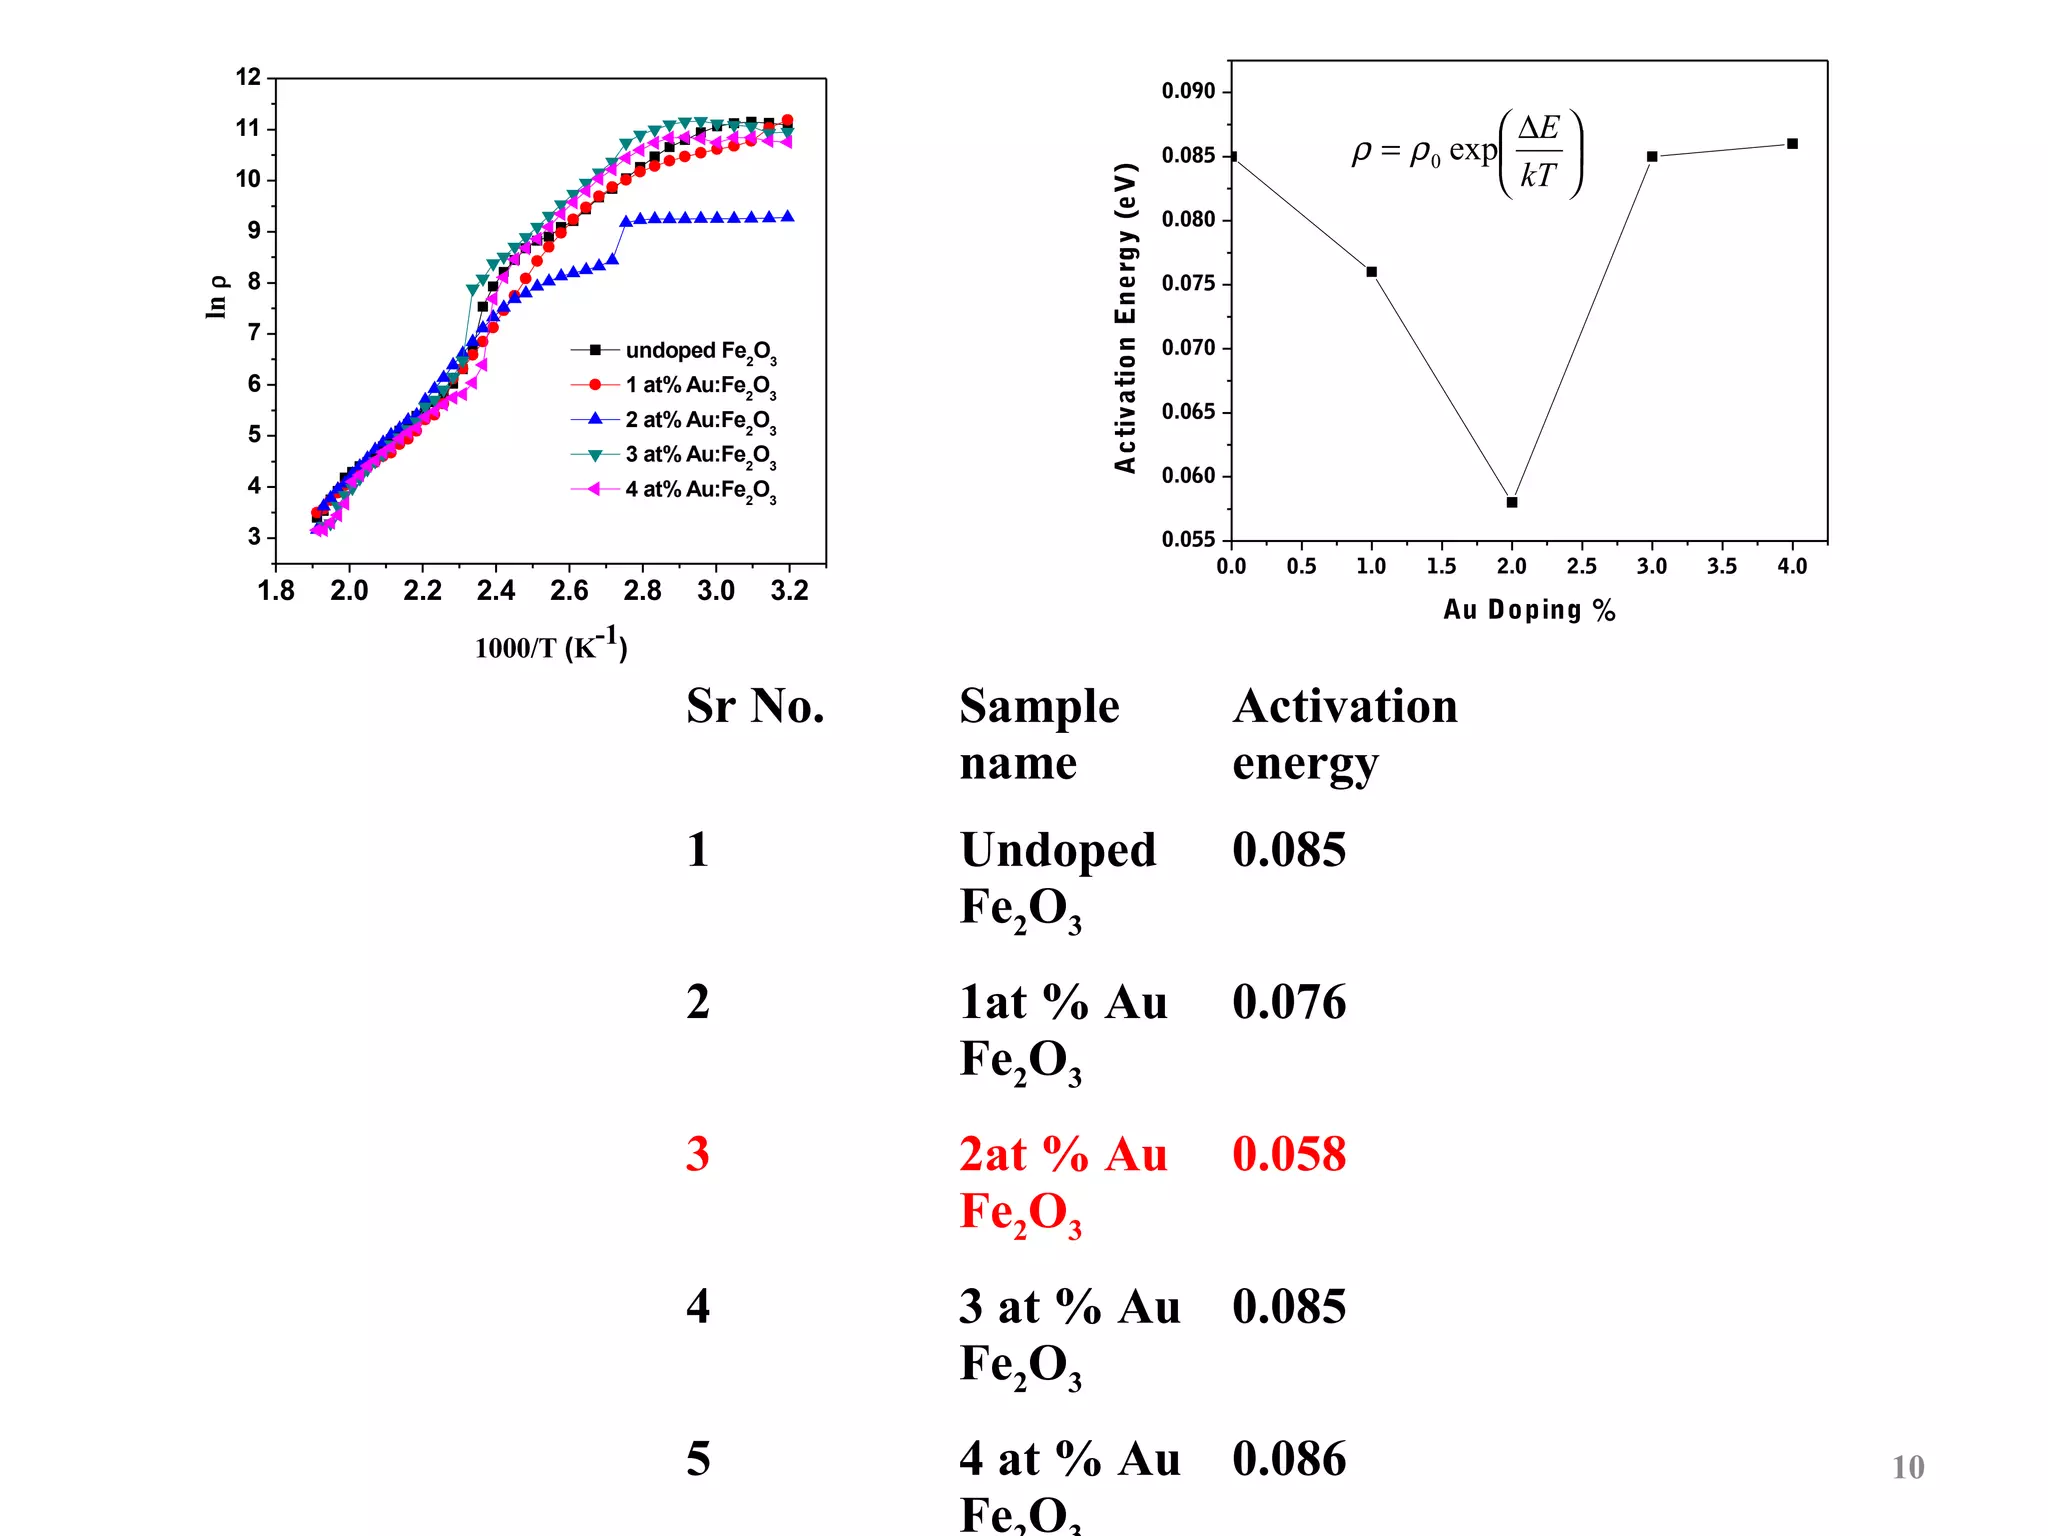
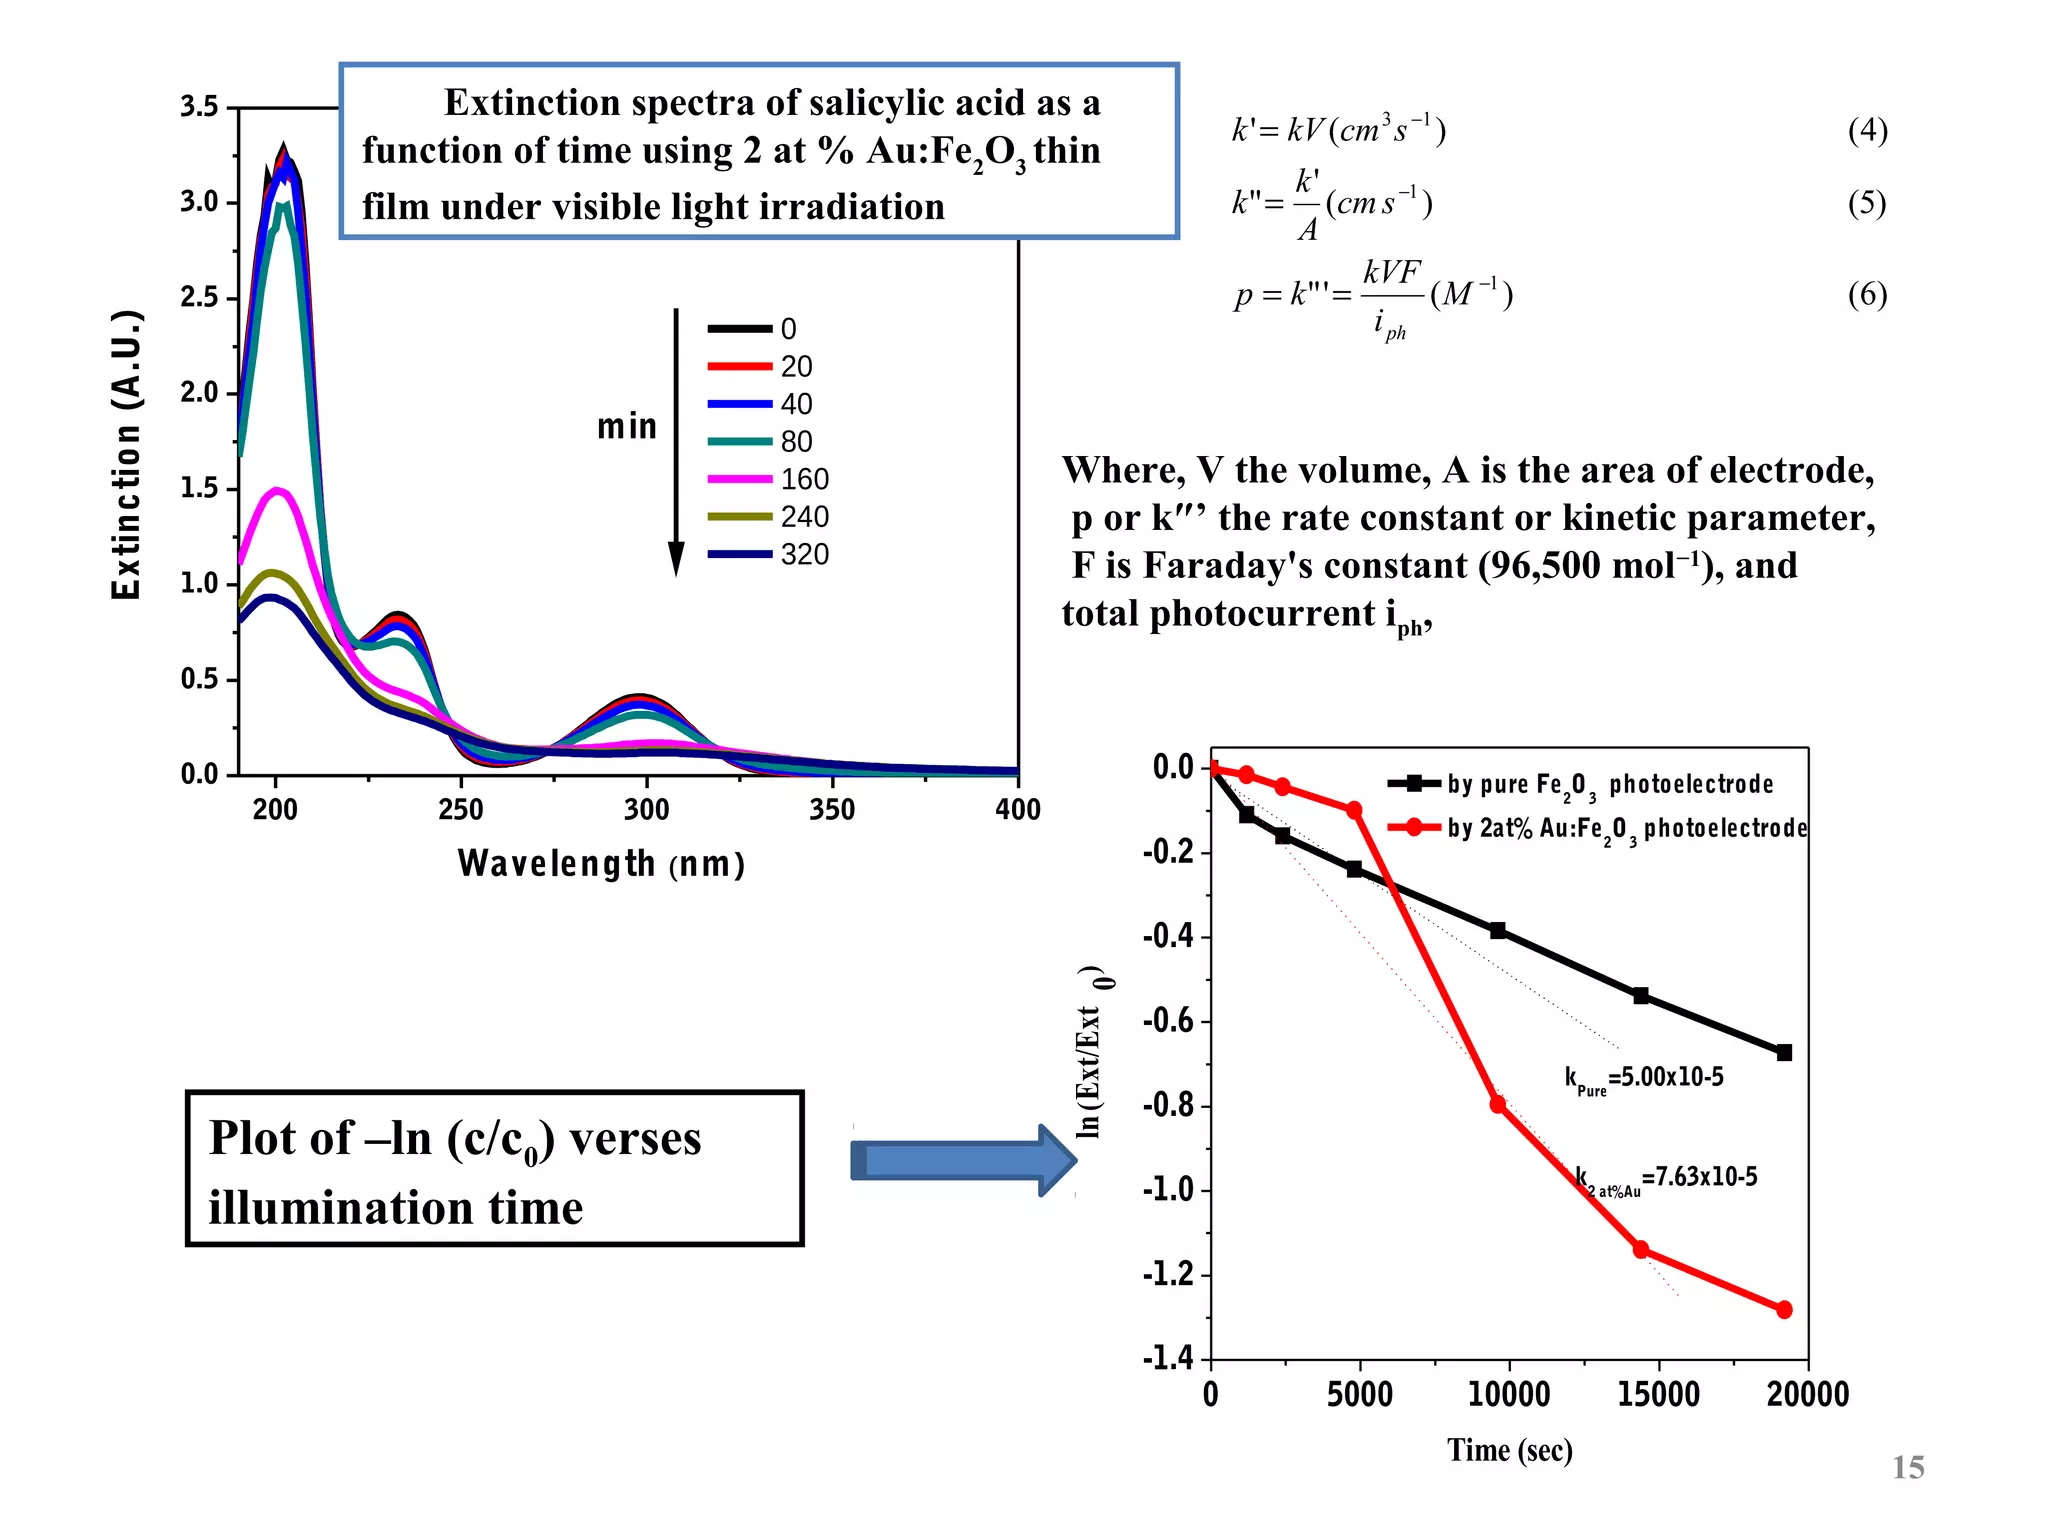
The document describes research on photoelectrocatalytic degradation of salicylic acid using sprayed gold doped iron oxide thin films. Gold doped iron oxide films were deposited via spray pyrolysis and characterized. XRD showed the films were polycrystalline hematite. SEM showed needle-shaped grains of 100-150nm. Electrical resistivity decreased with gold doping up to 2%. The 2% gold doped film had the highest photocurrent and degraded 75% of salicylic acid in 320 minutes under visible light irradiation, making it the best photoelectrode developed in the study.


![Coded Agents – with UiPath SDK + LangGraph [Virtual Hands-on Workshop]](https://cdn.slidesharecdn.com/ss_thumbnails/codedagentsdeck-251215155422-5497c599-thumbnail.jpg?width=640&height=640&fit=bounds)


