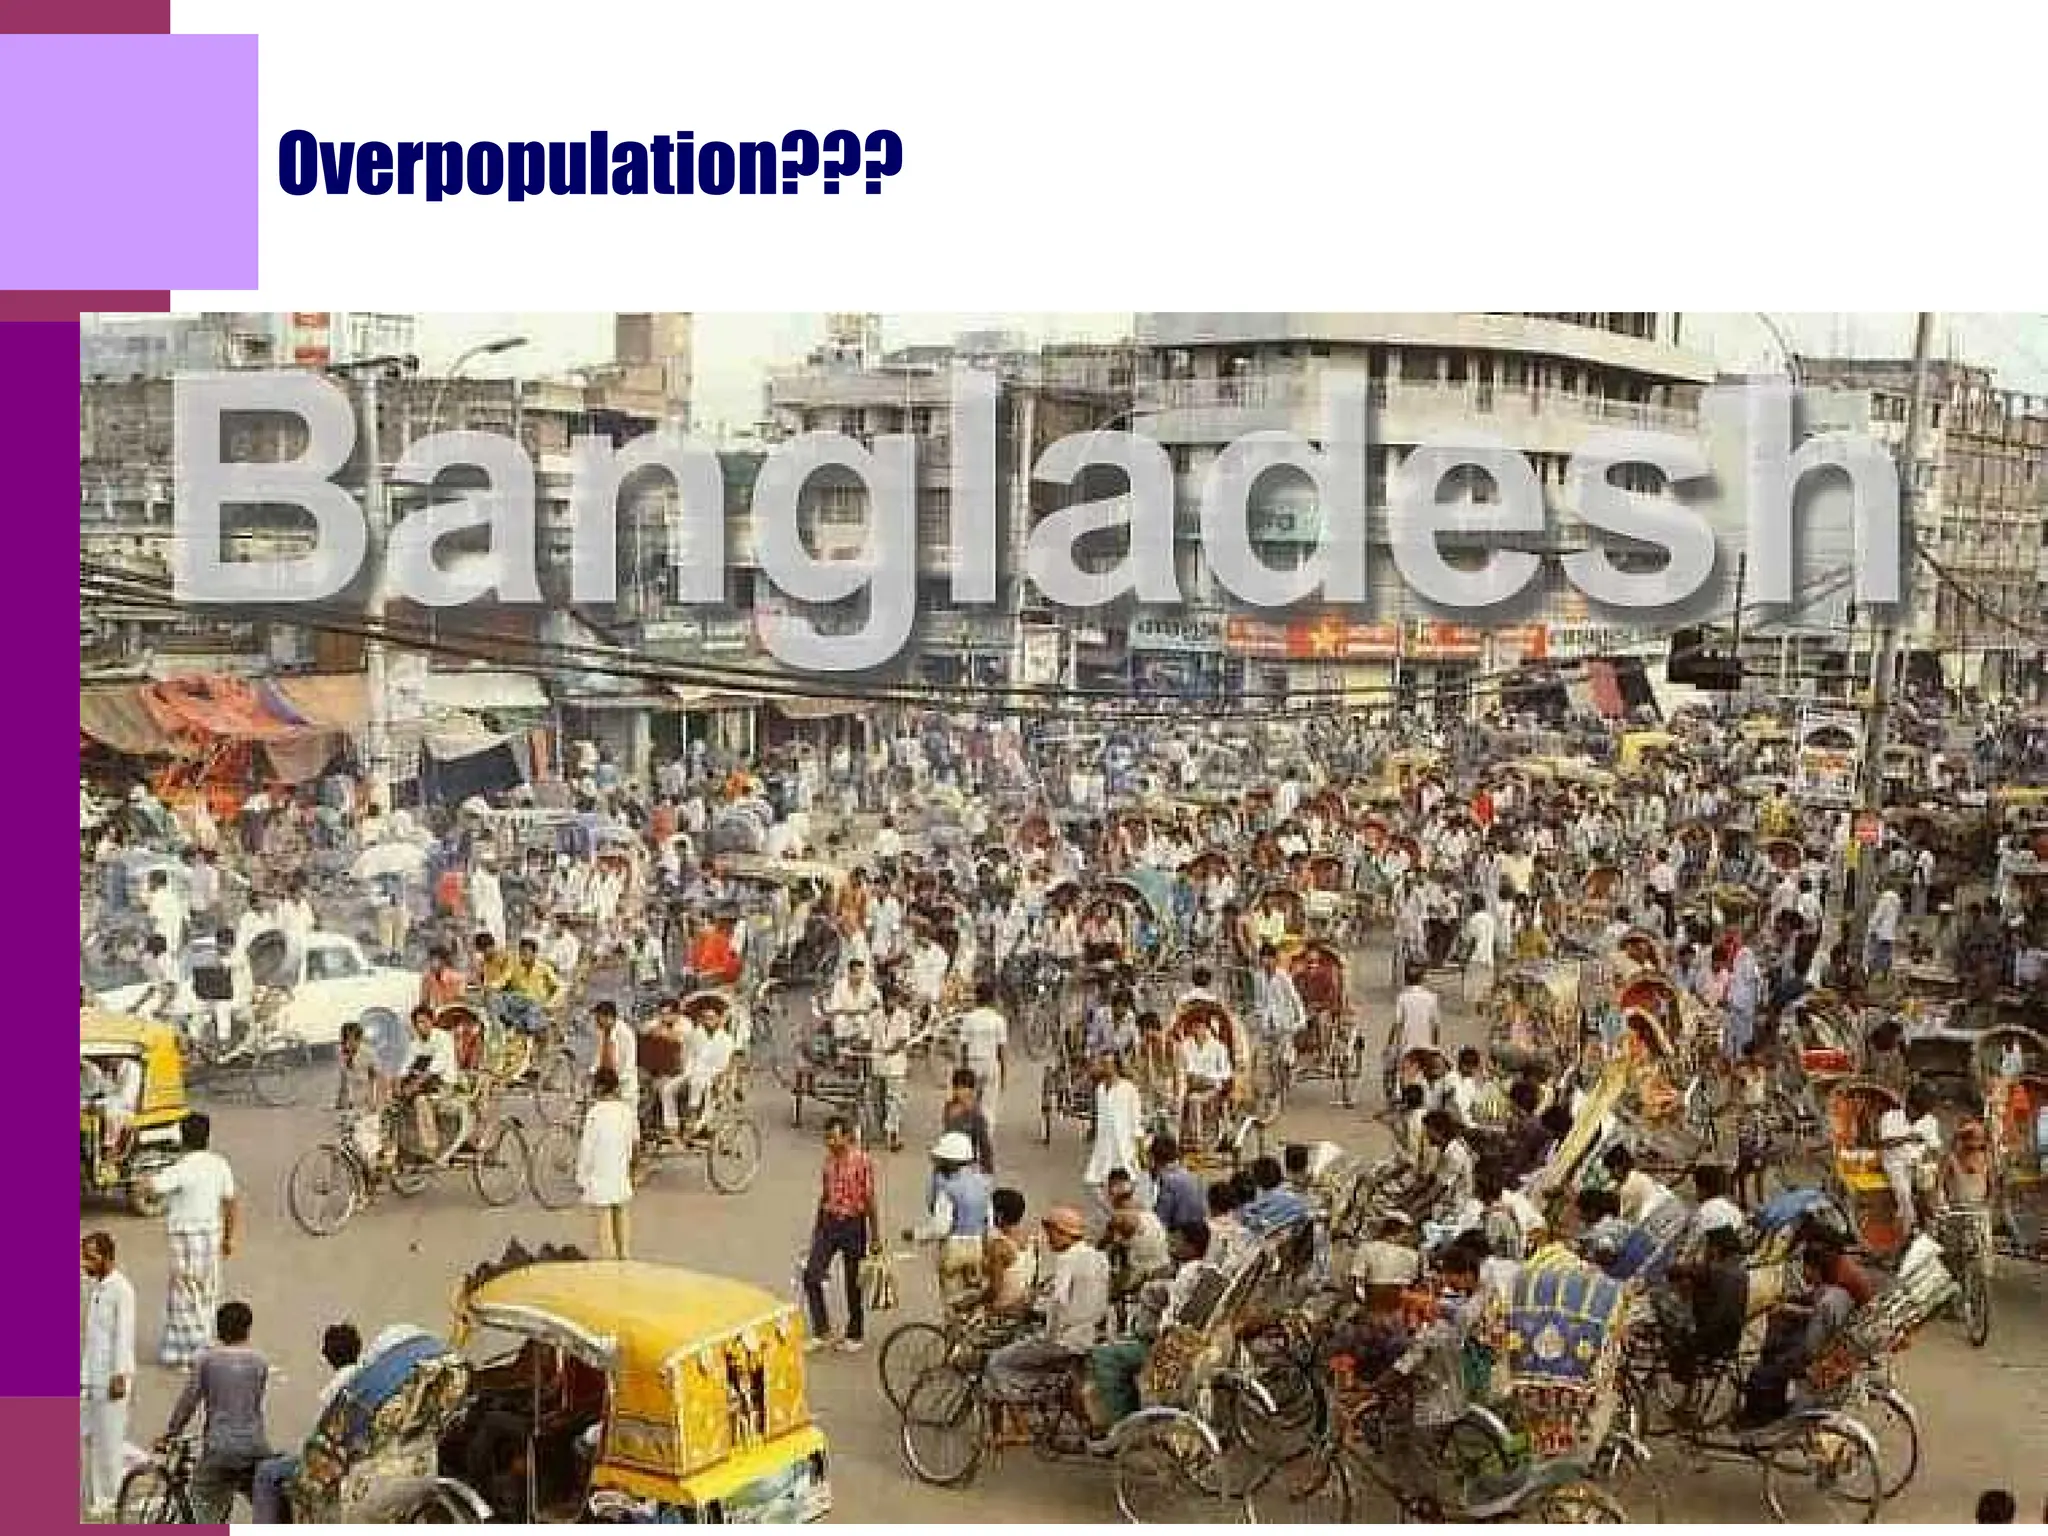
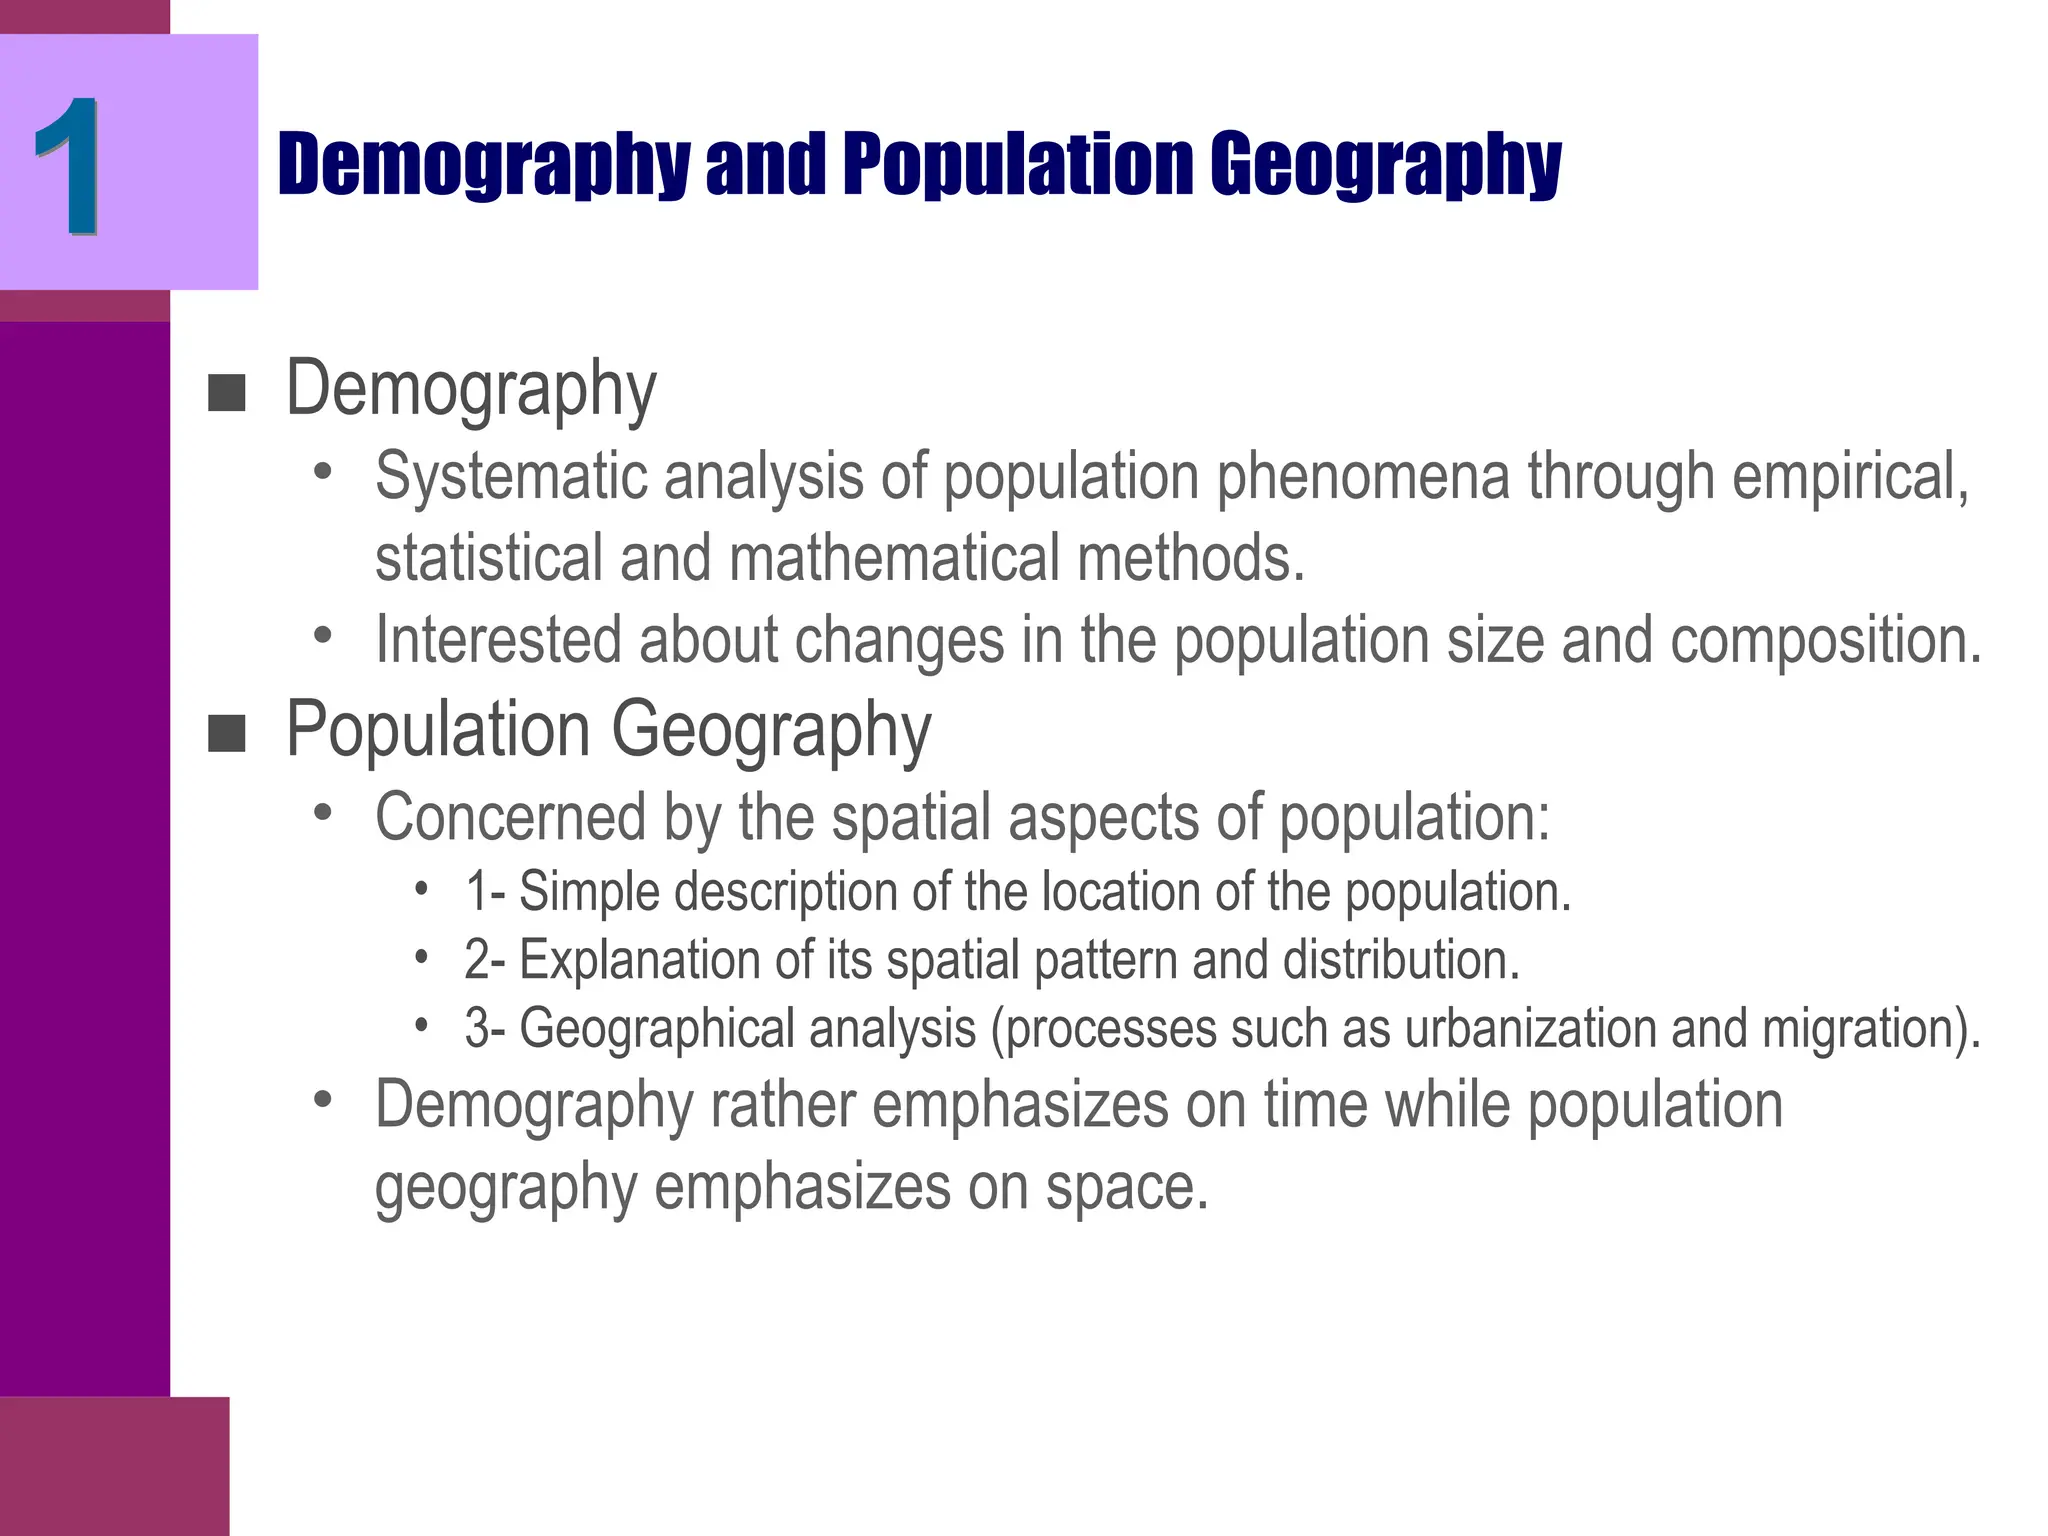
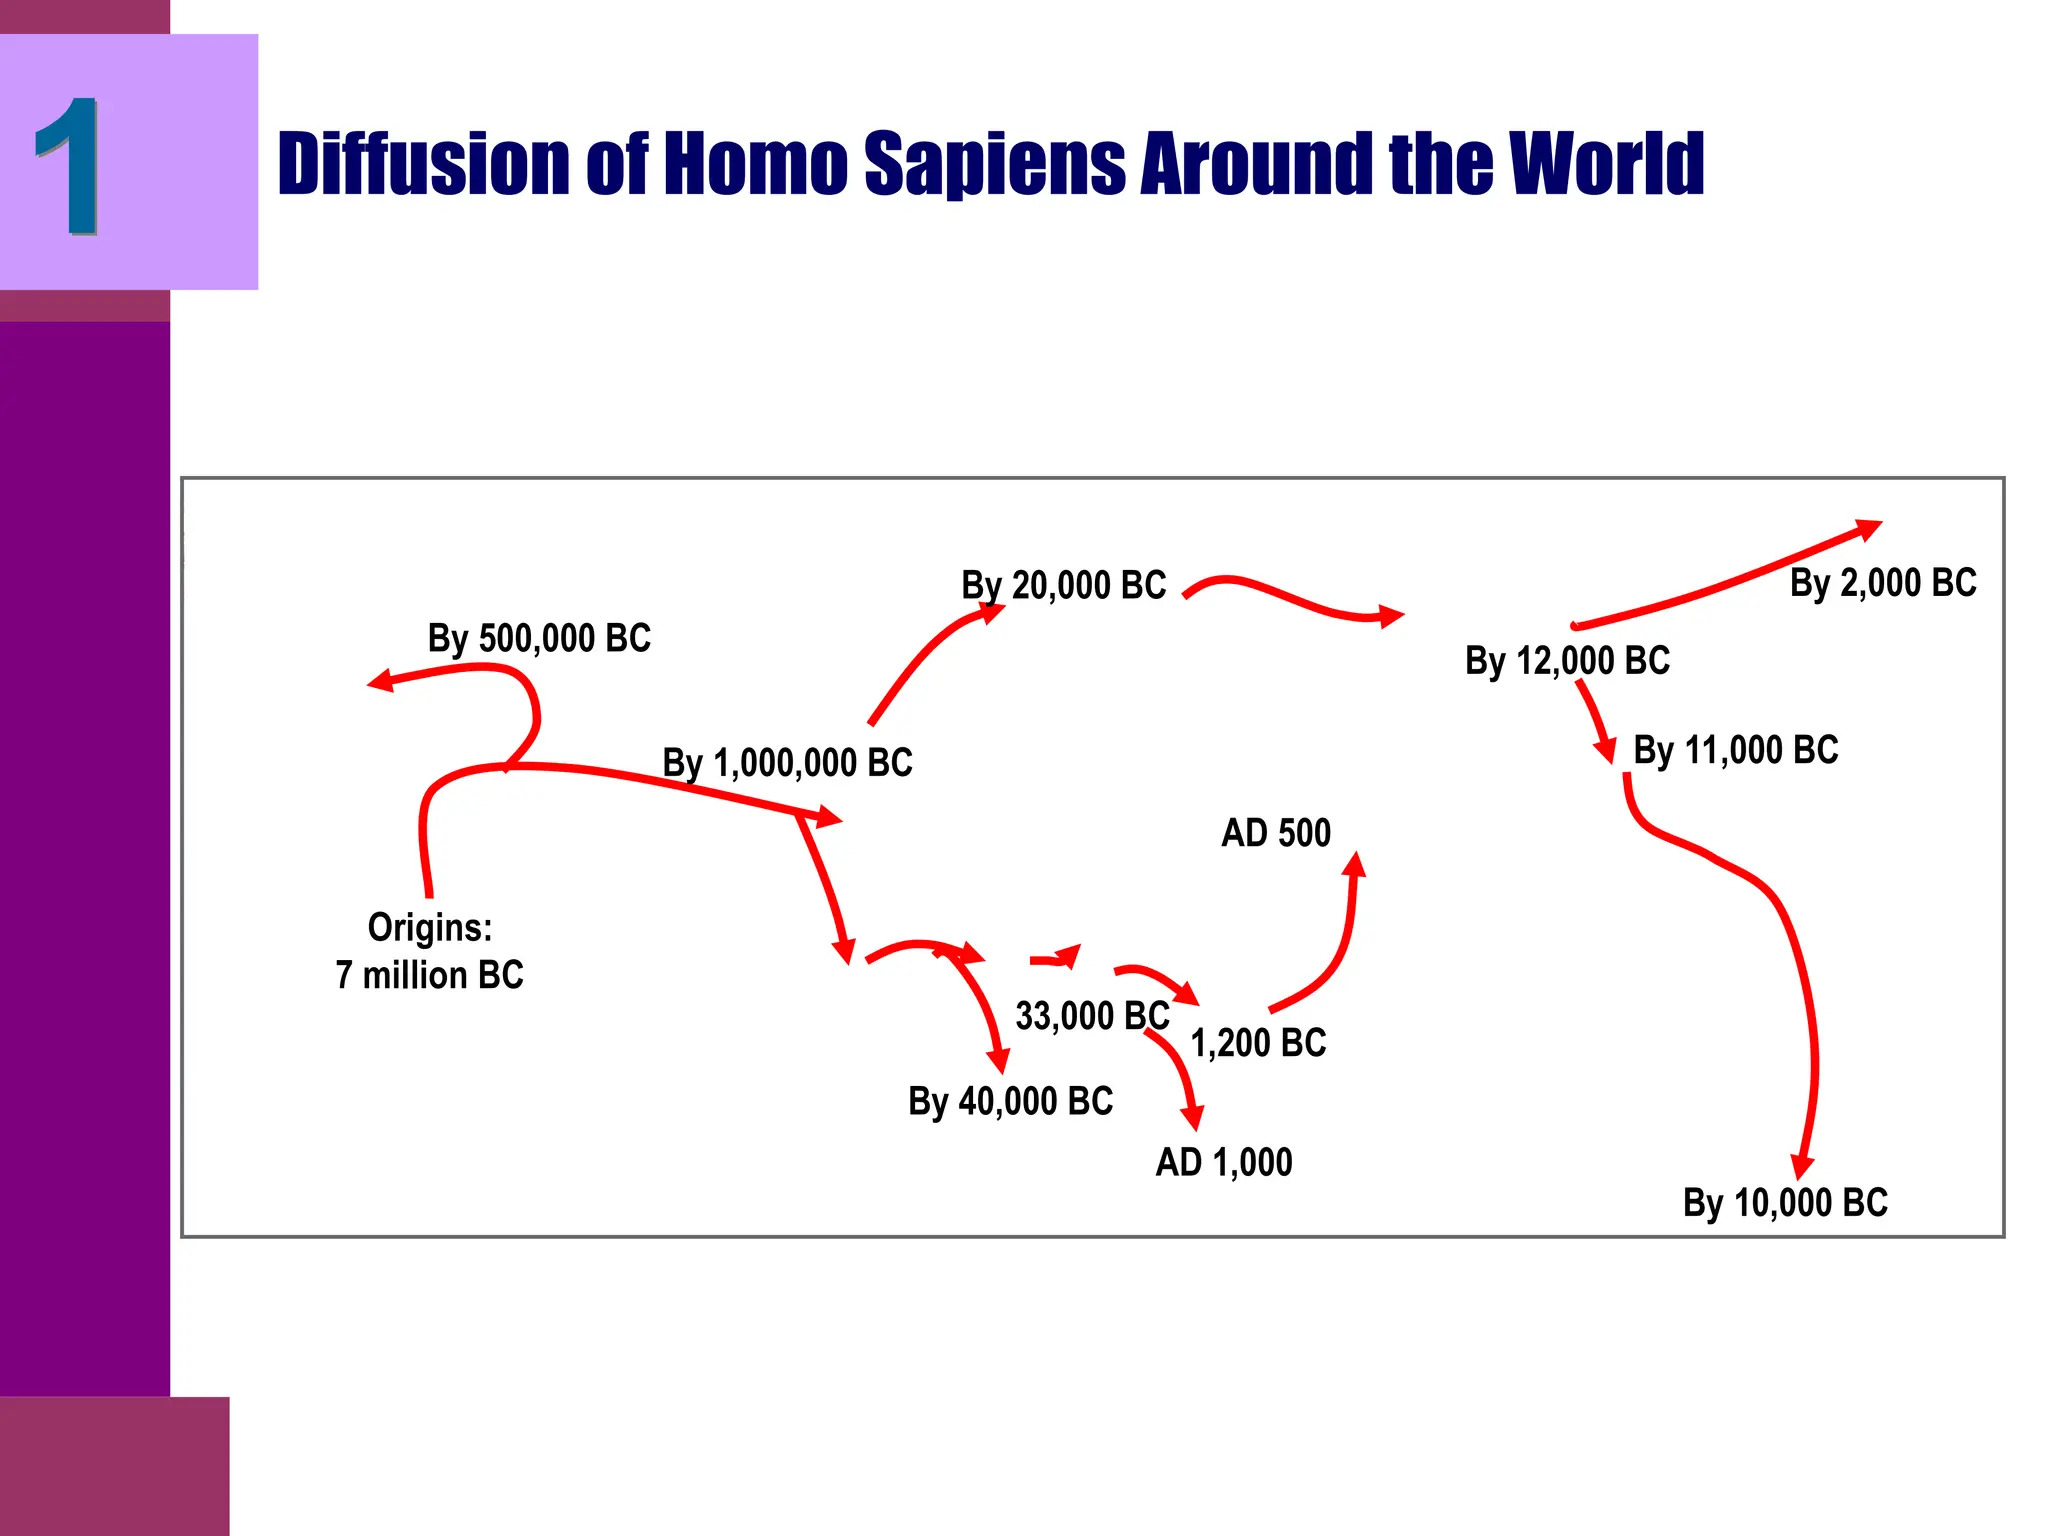
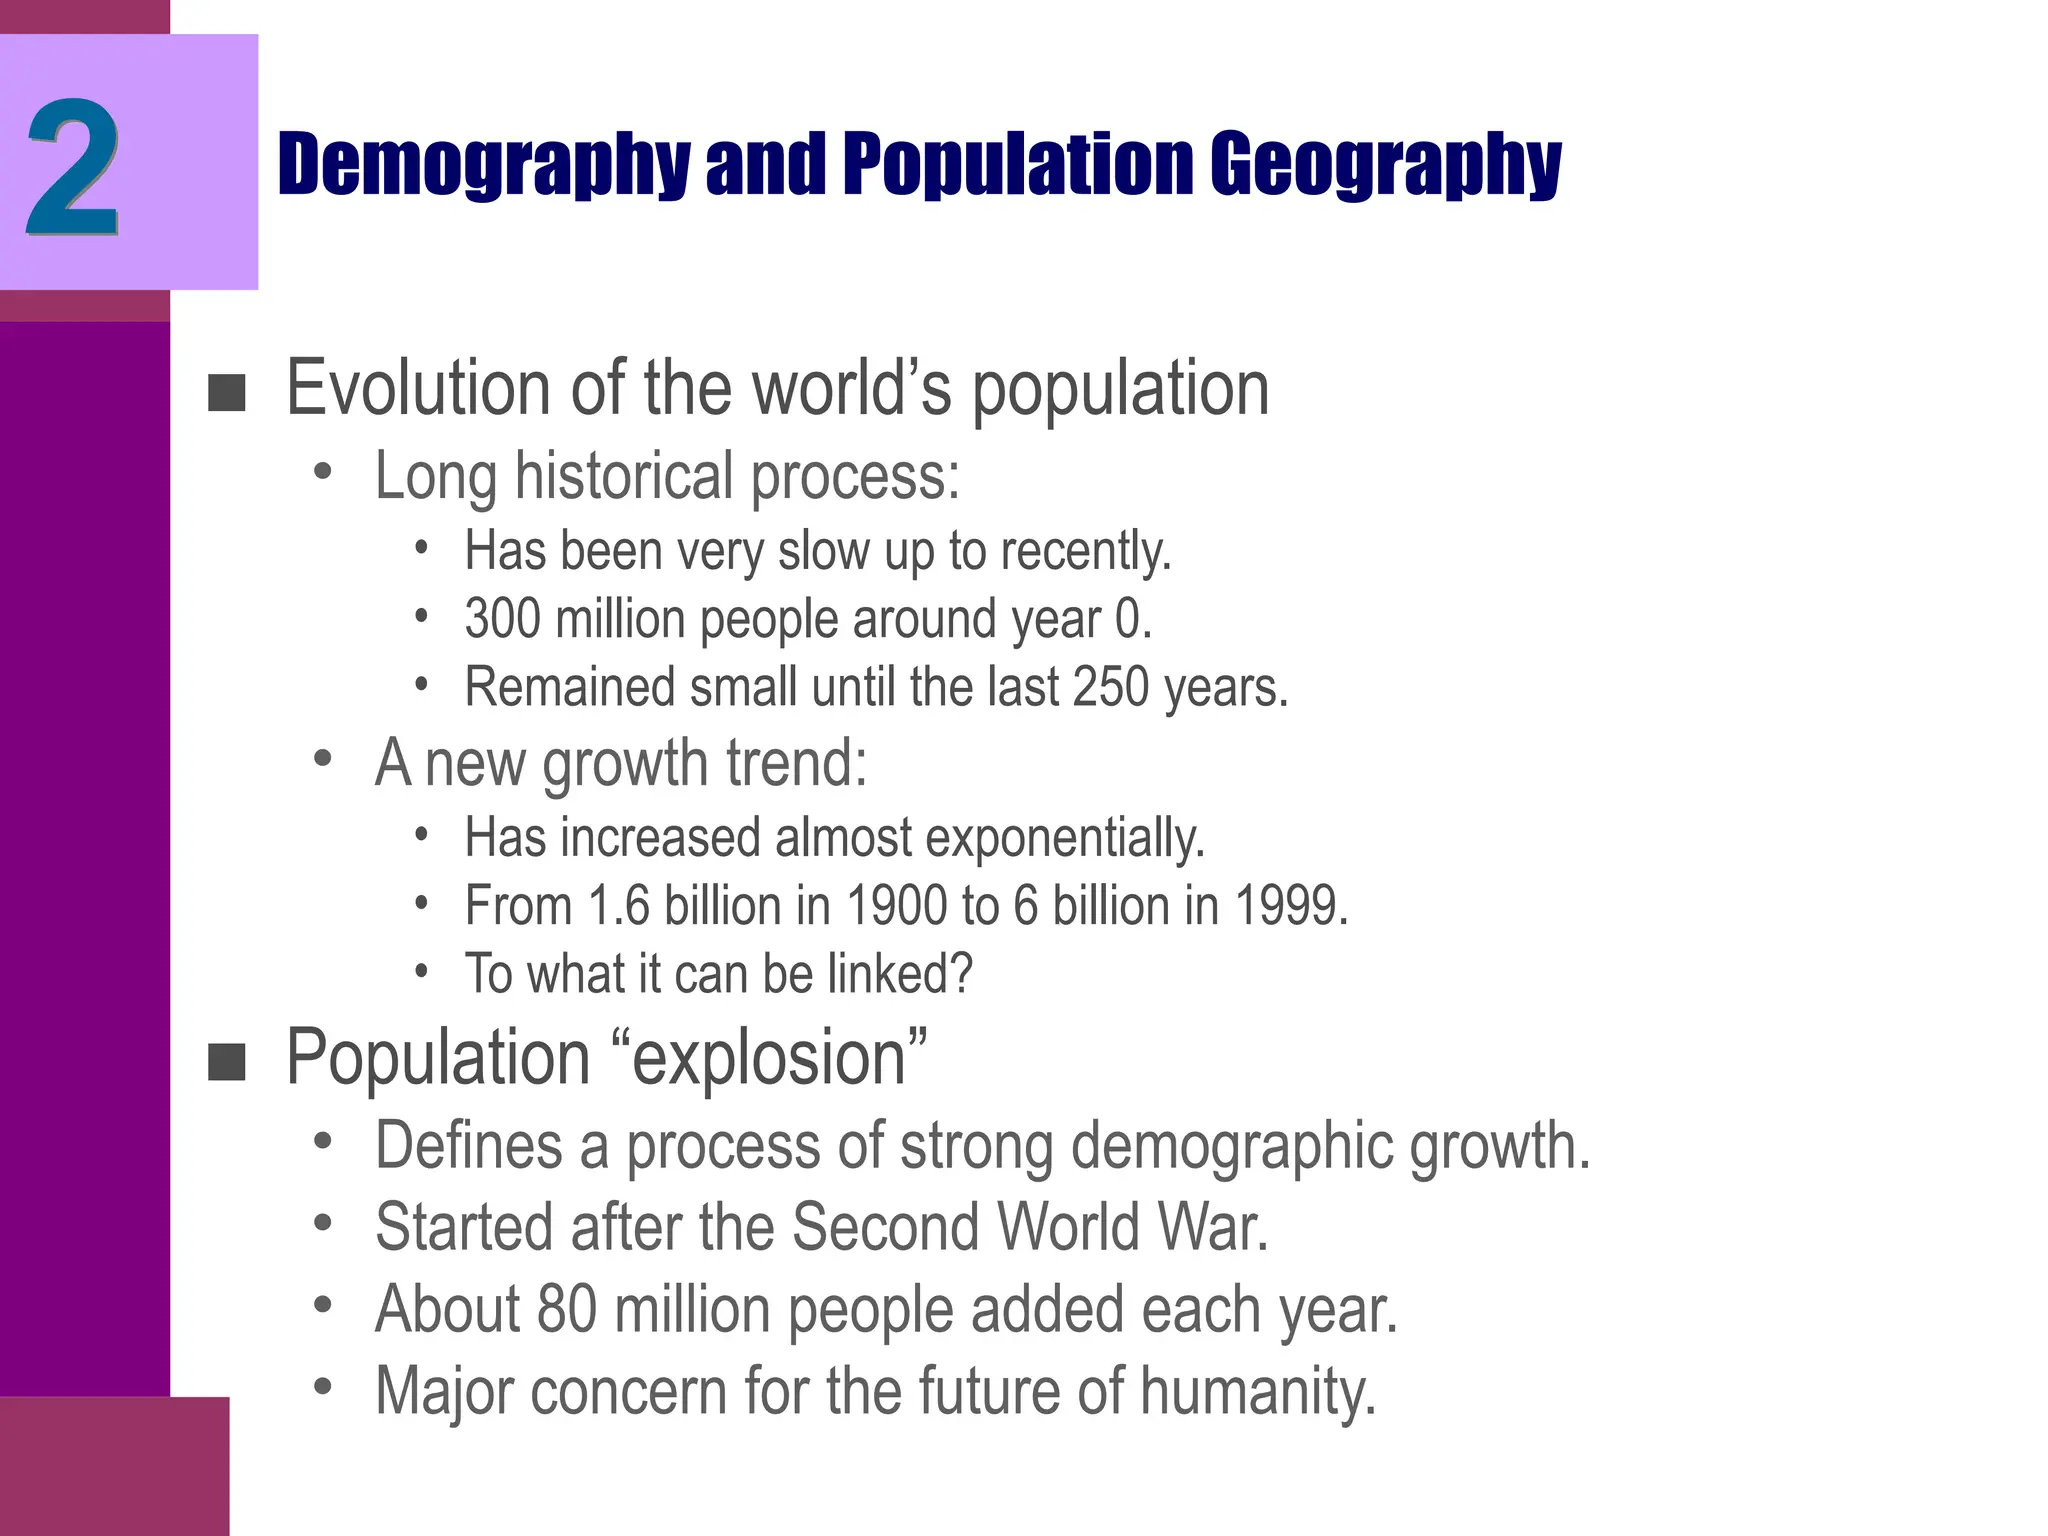
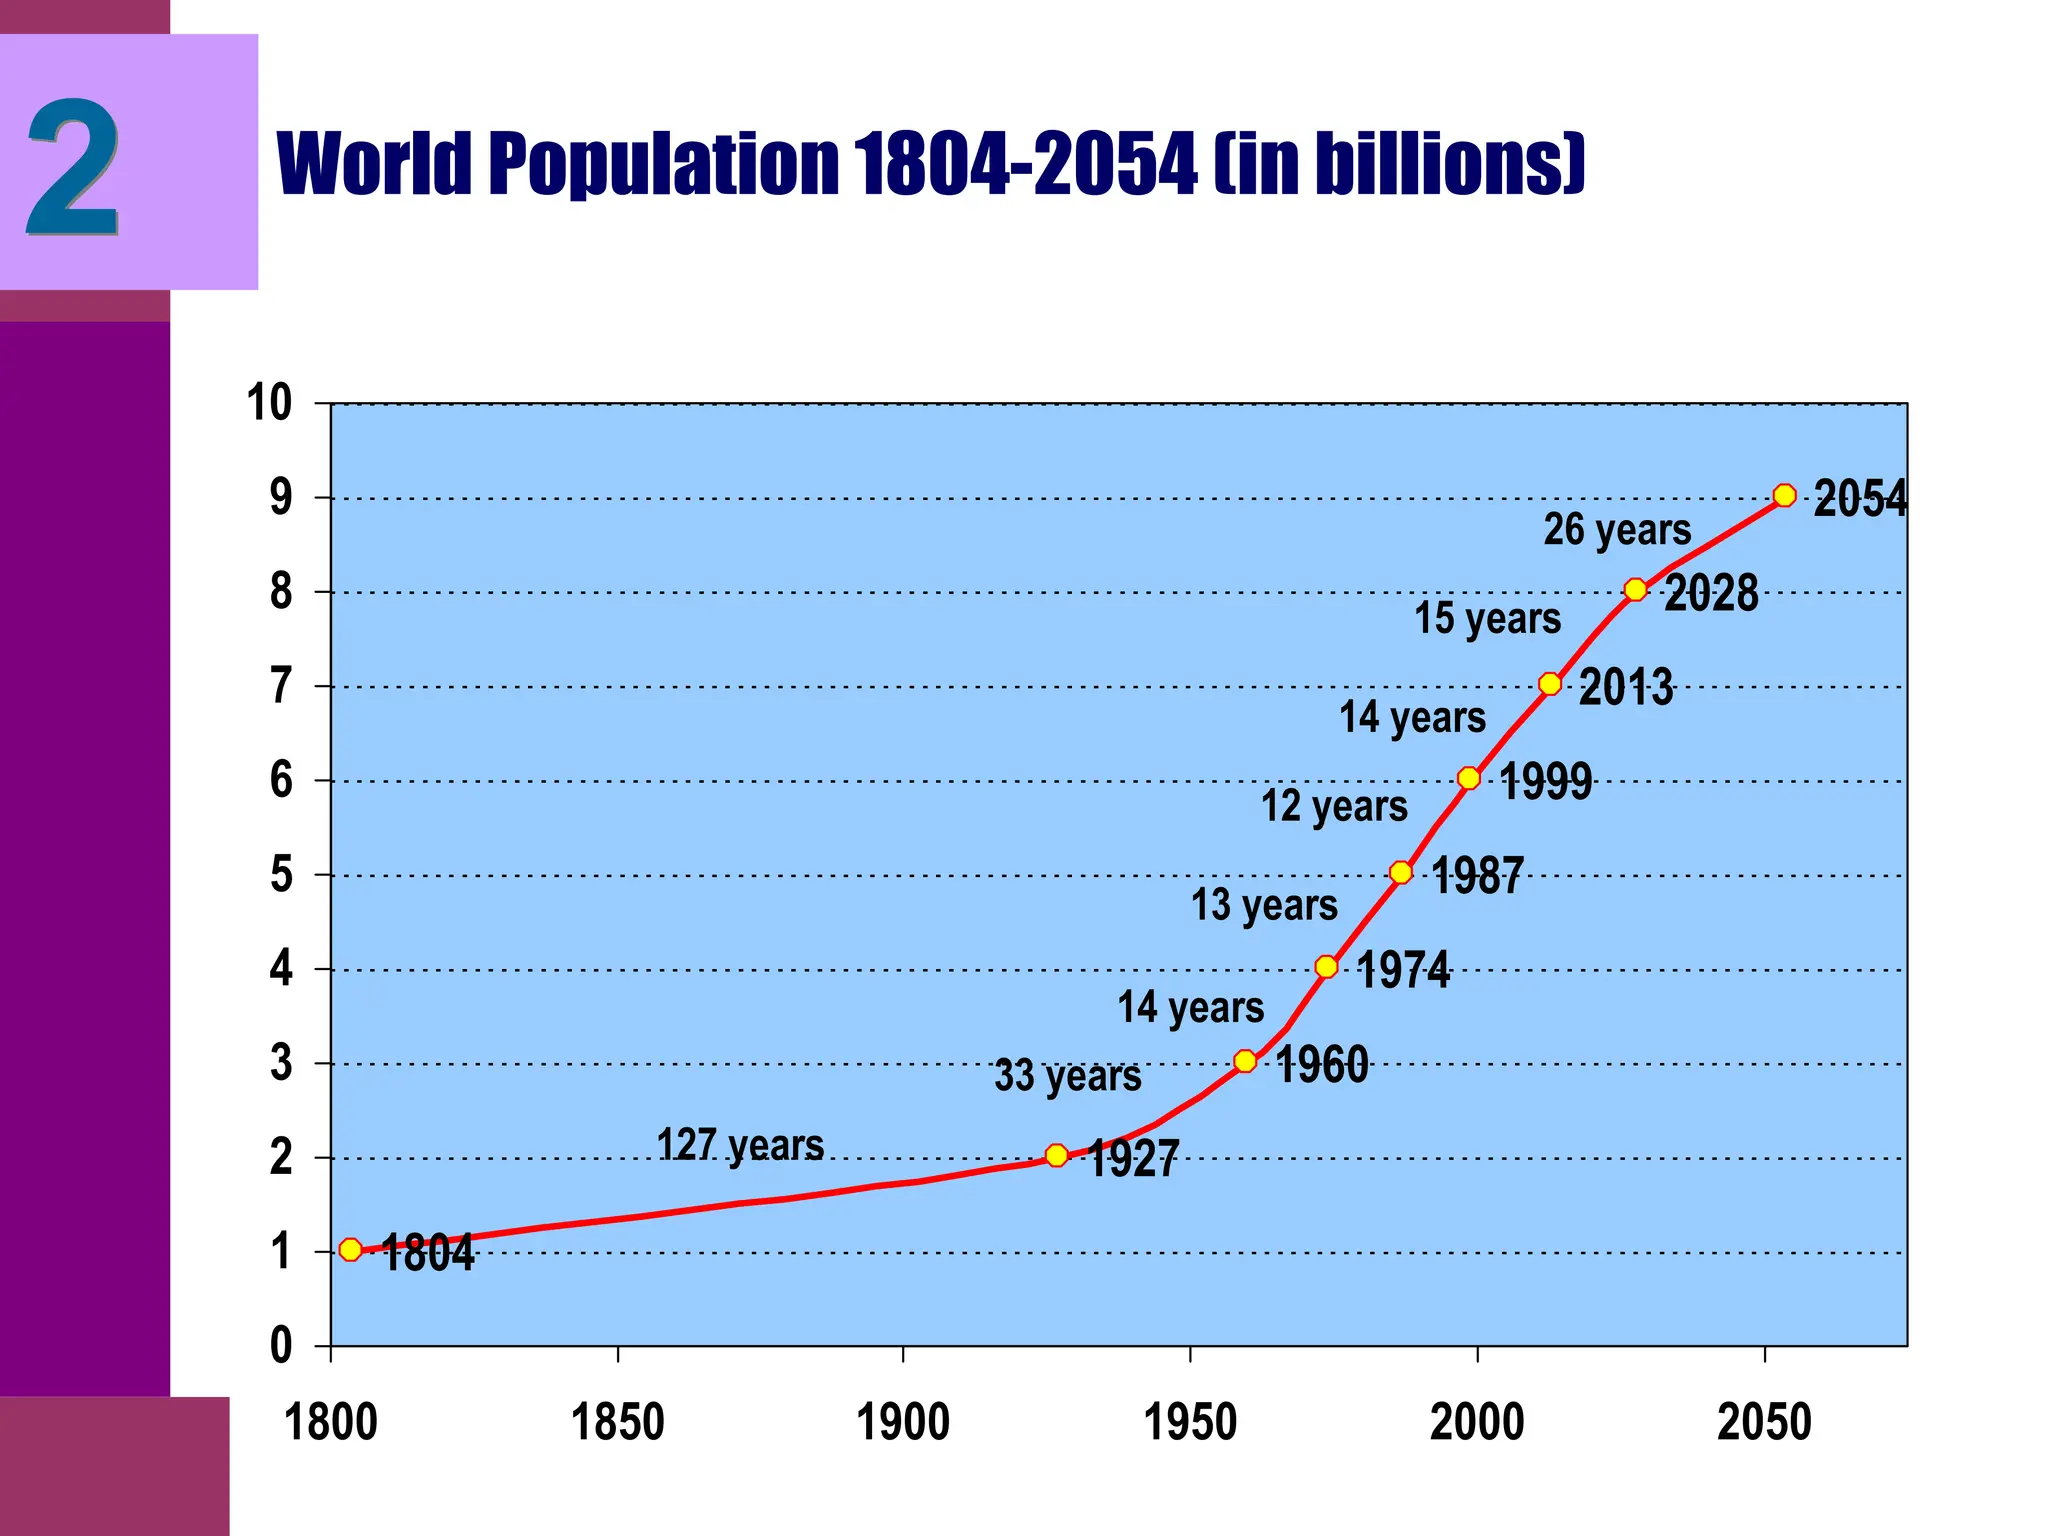
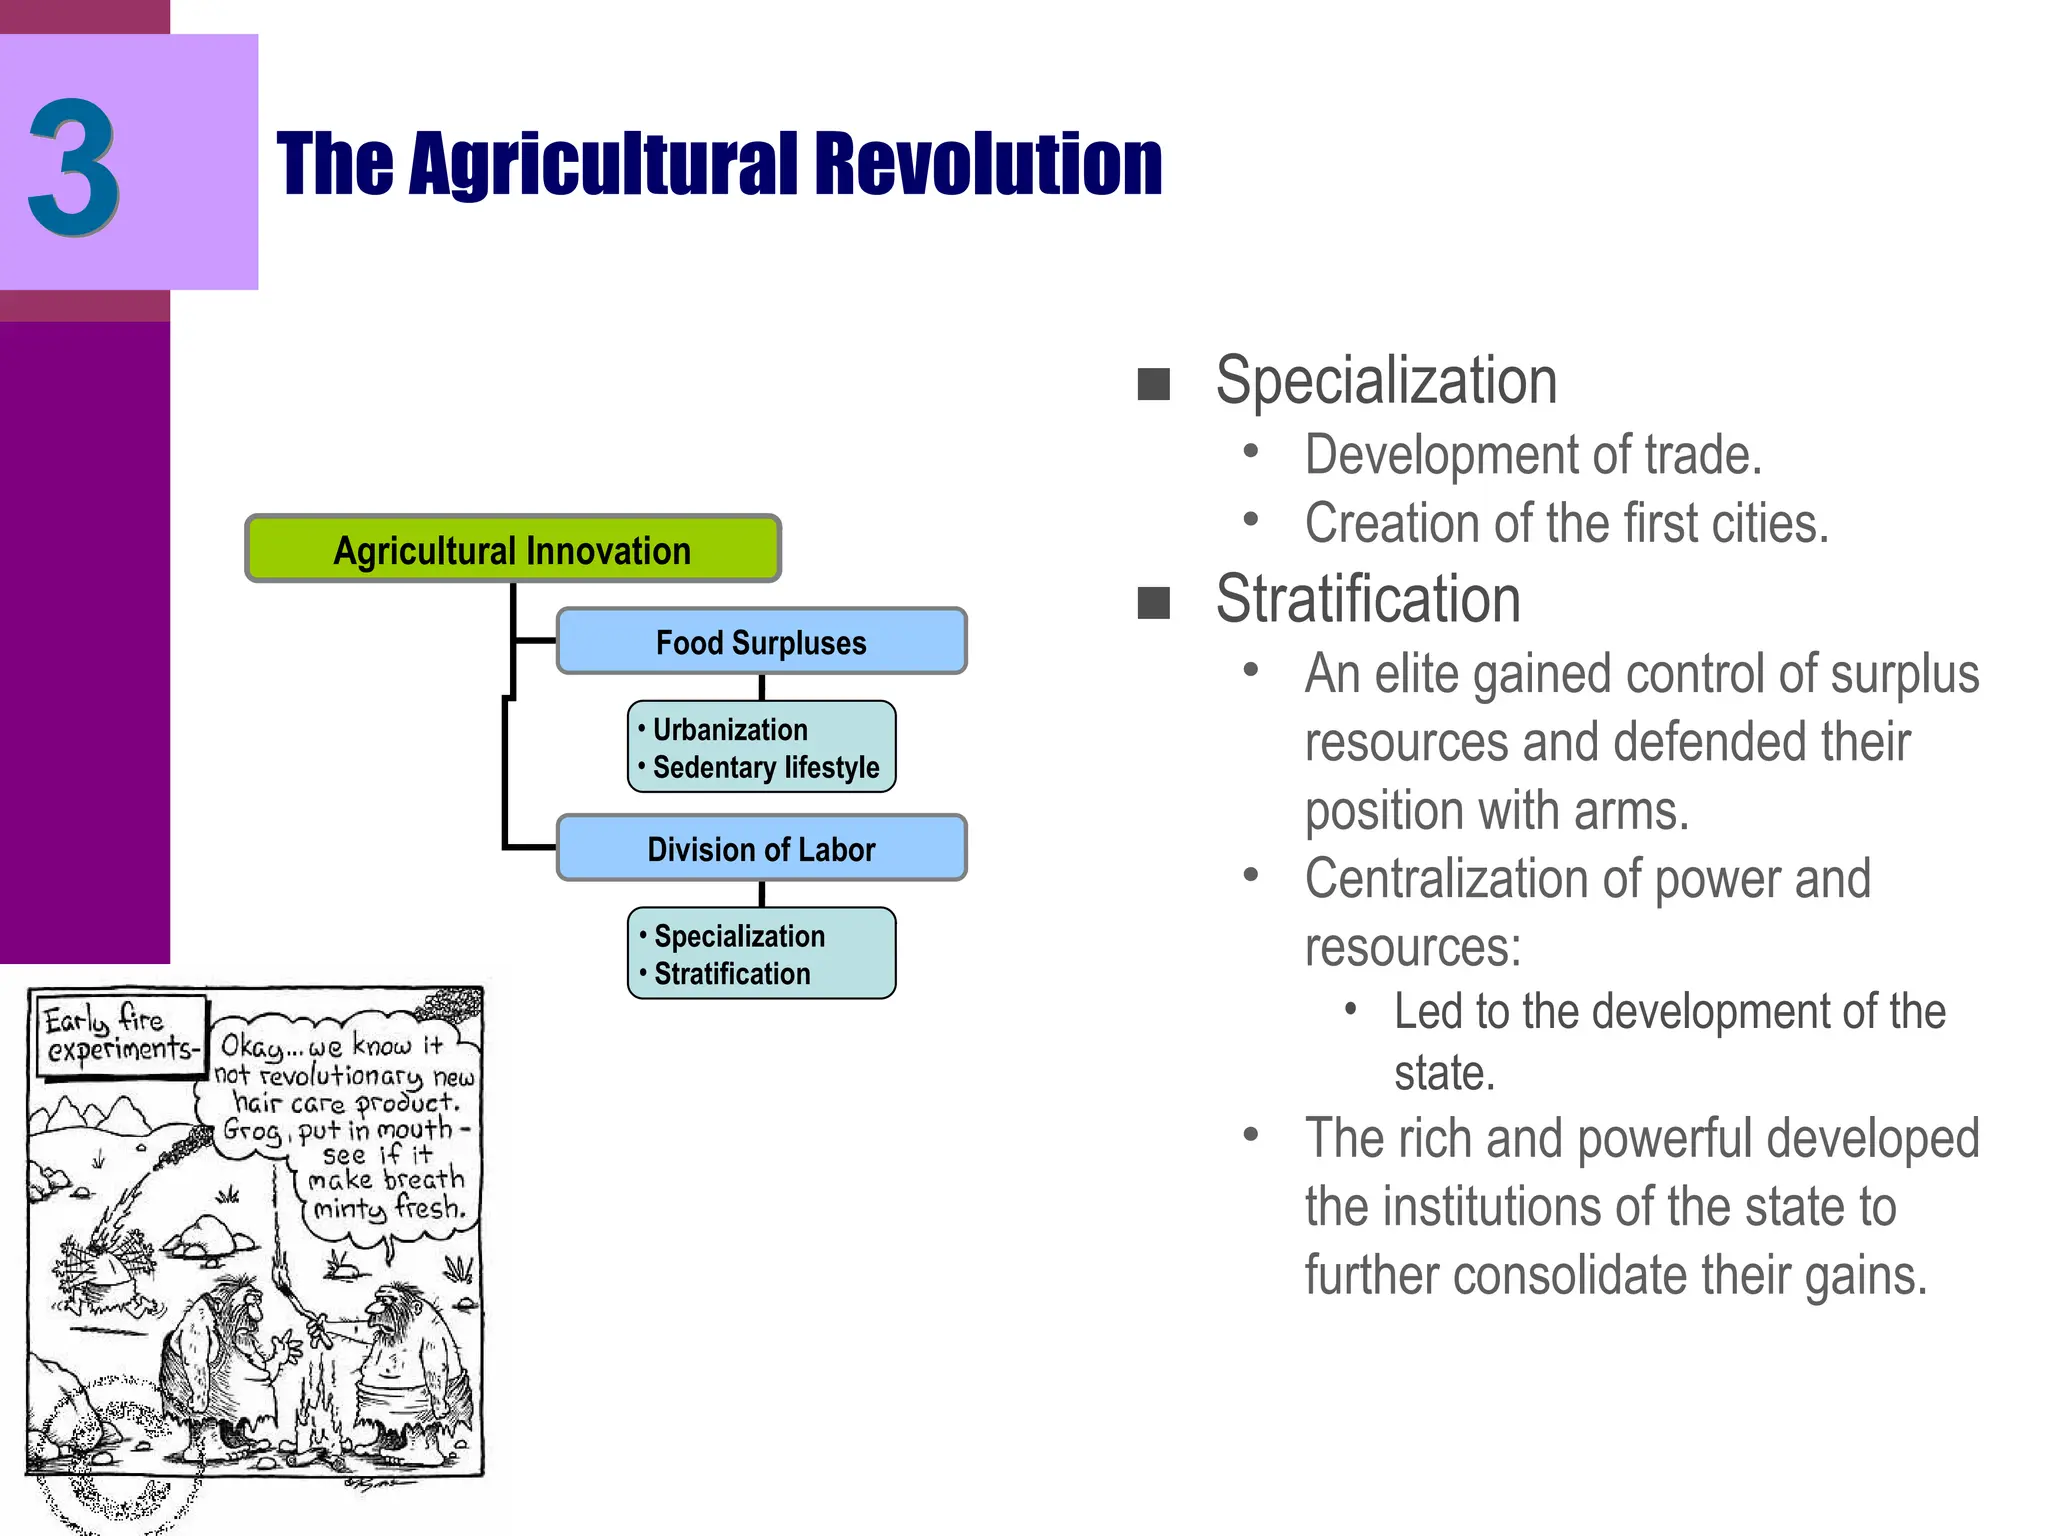
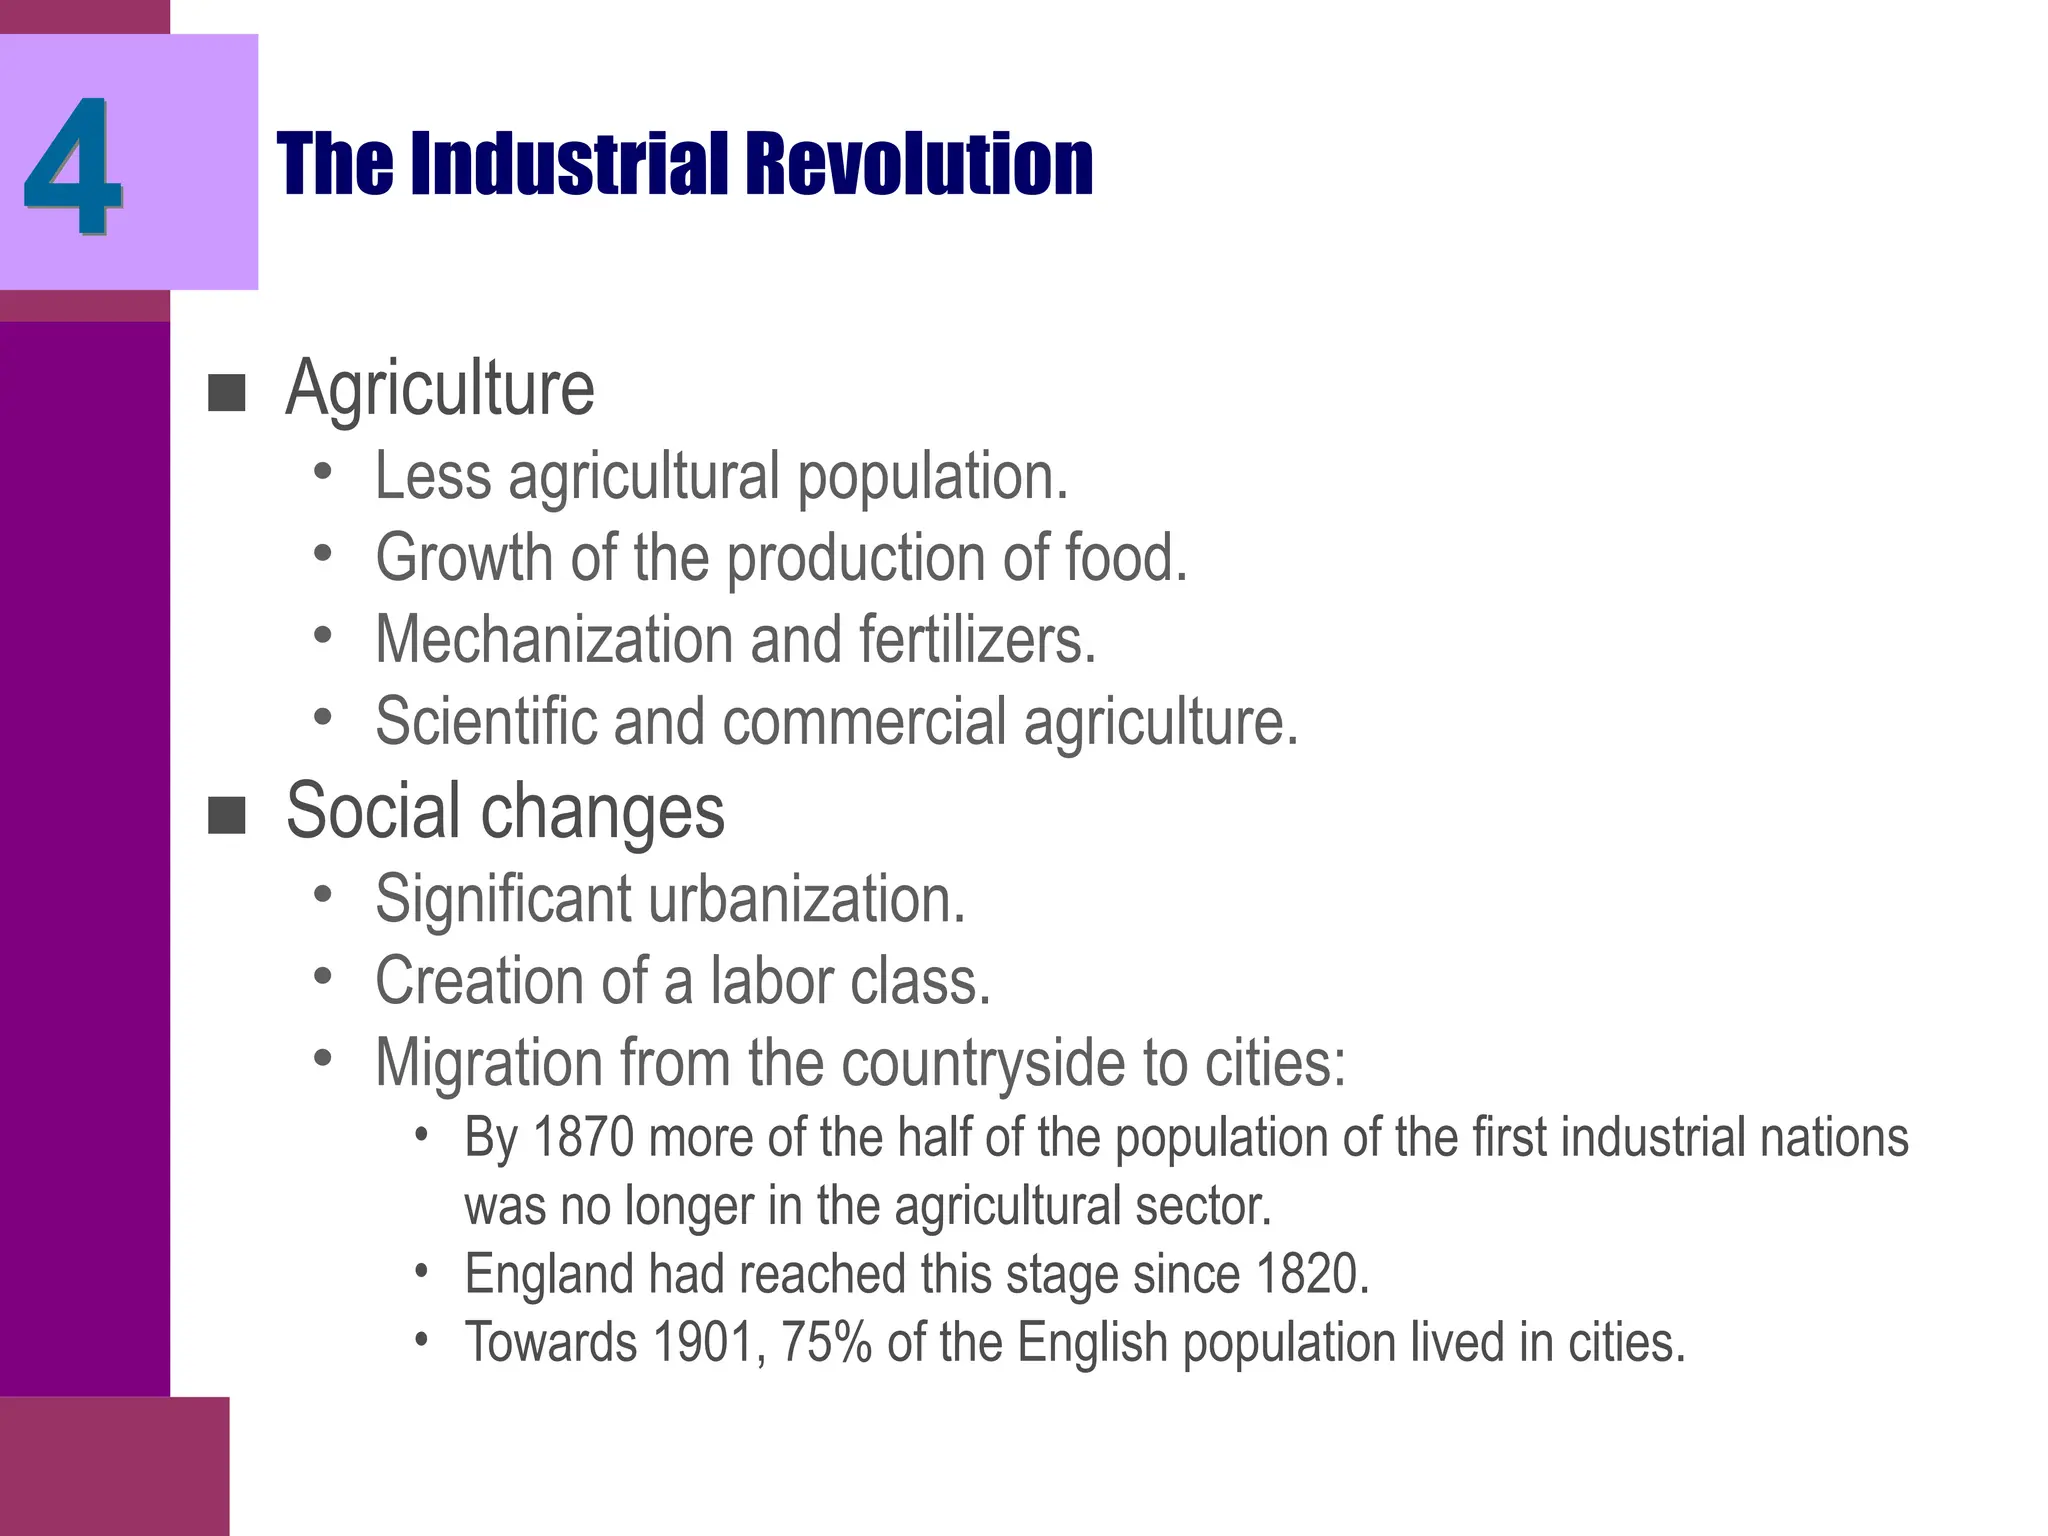
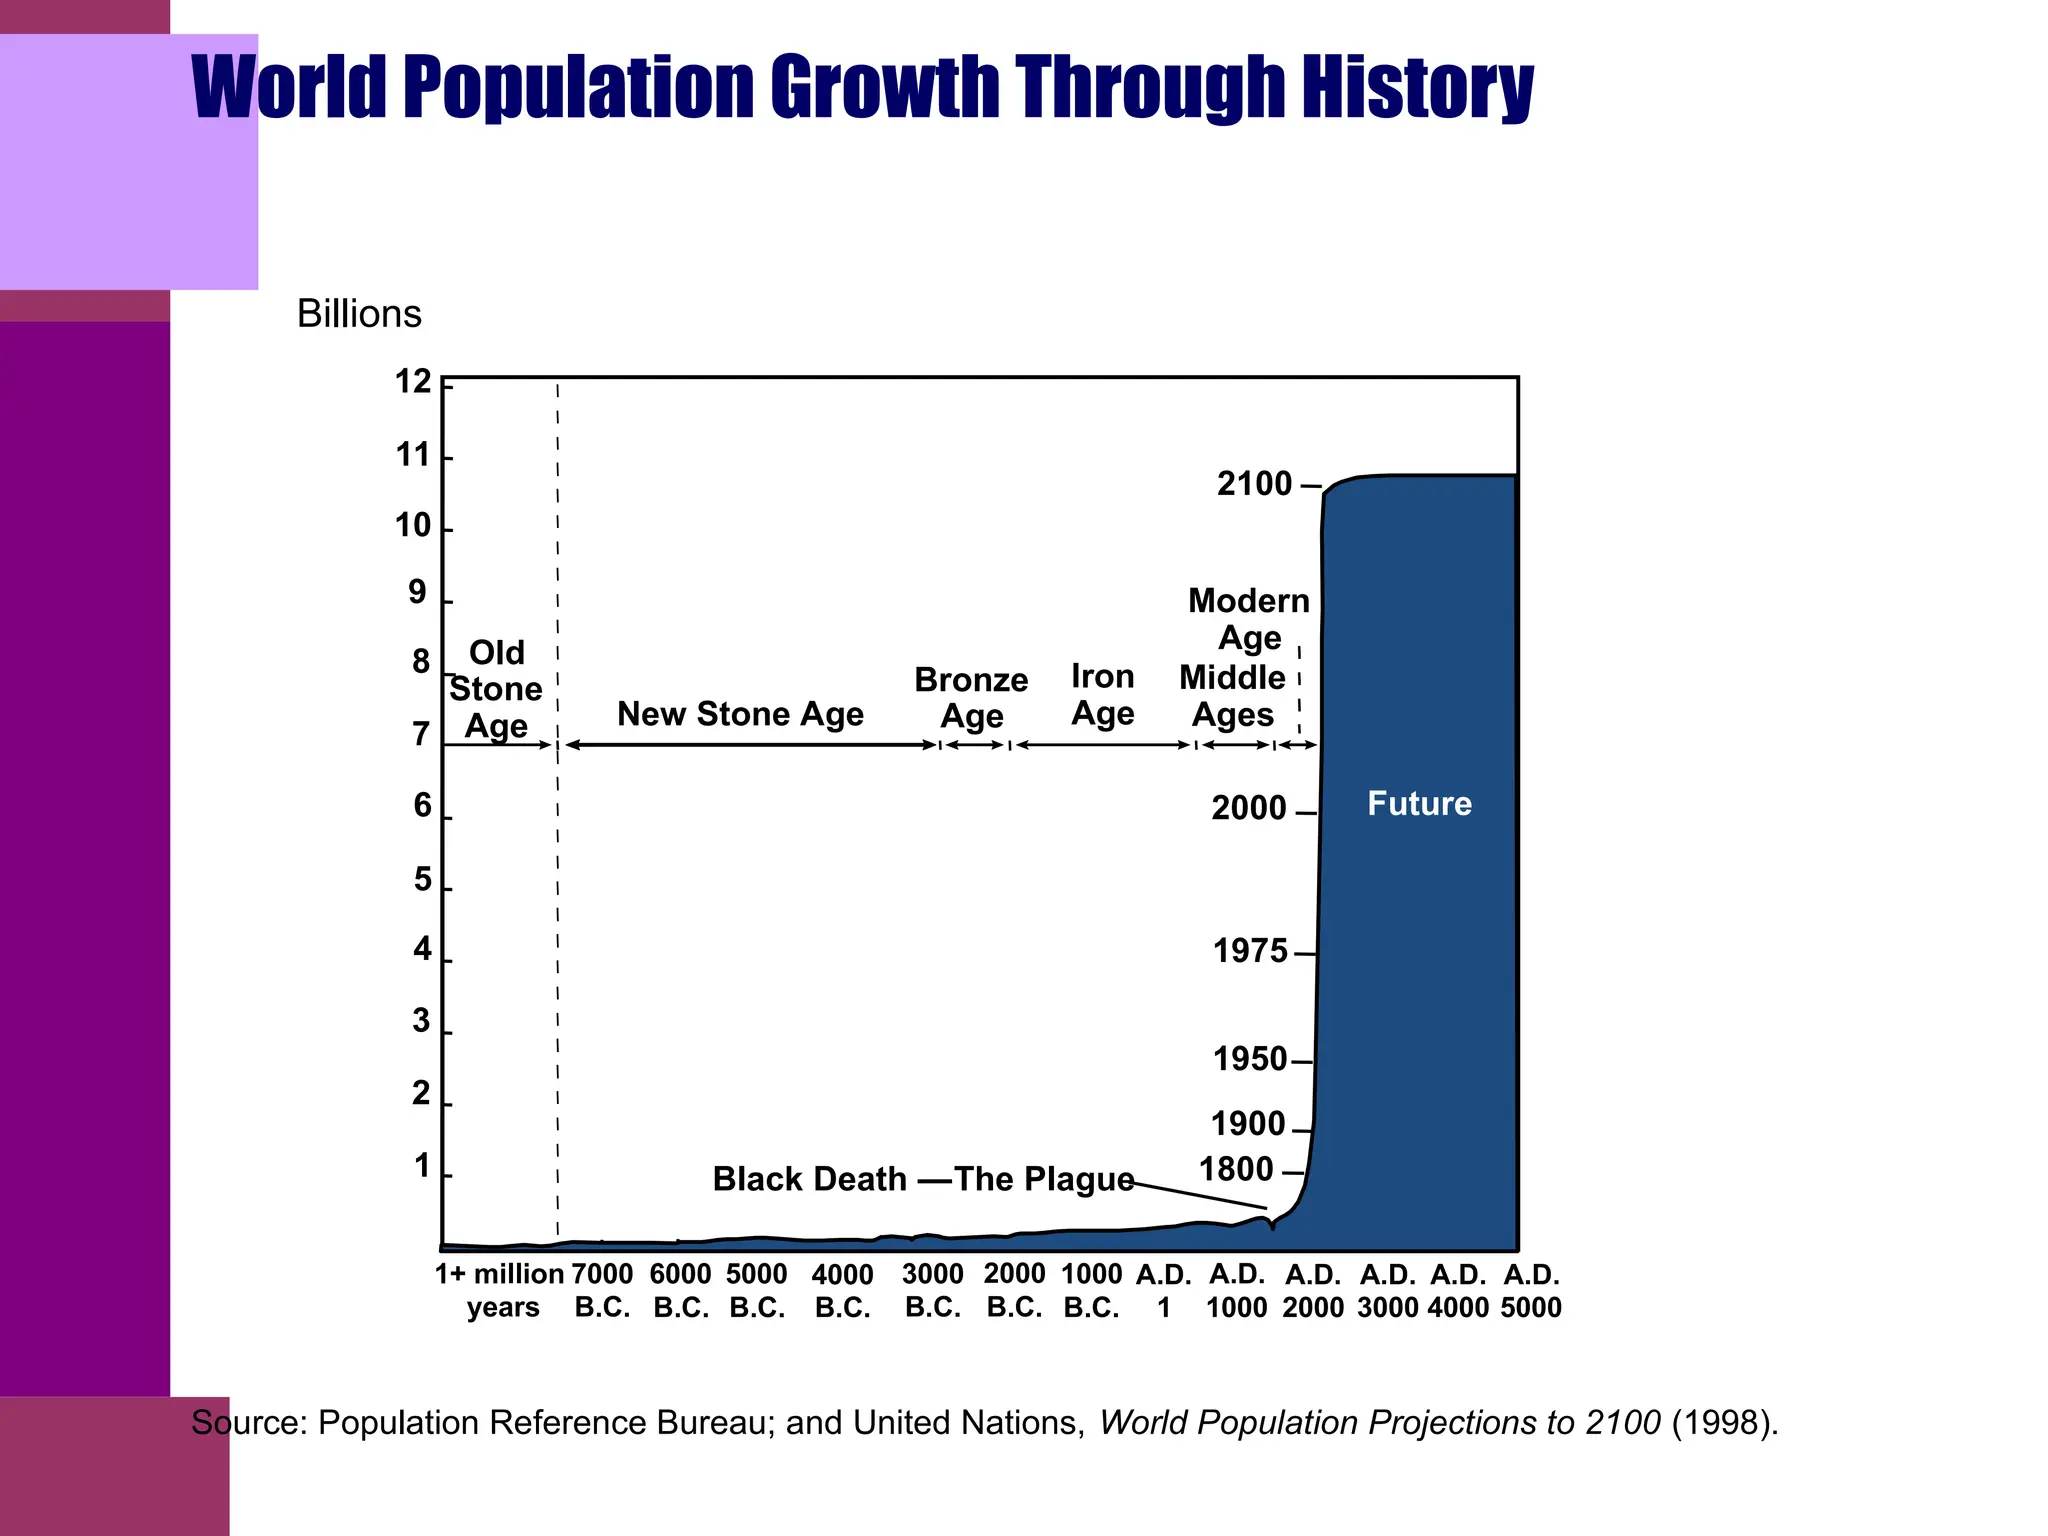
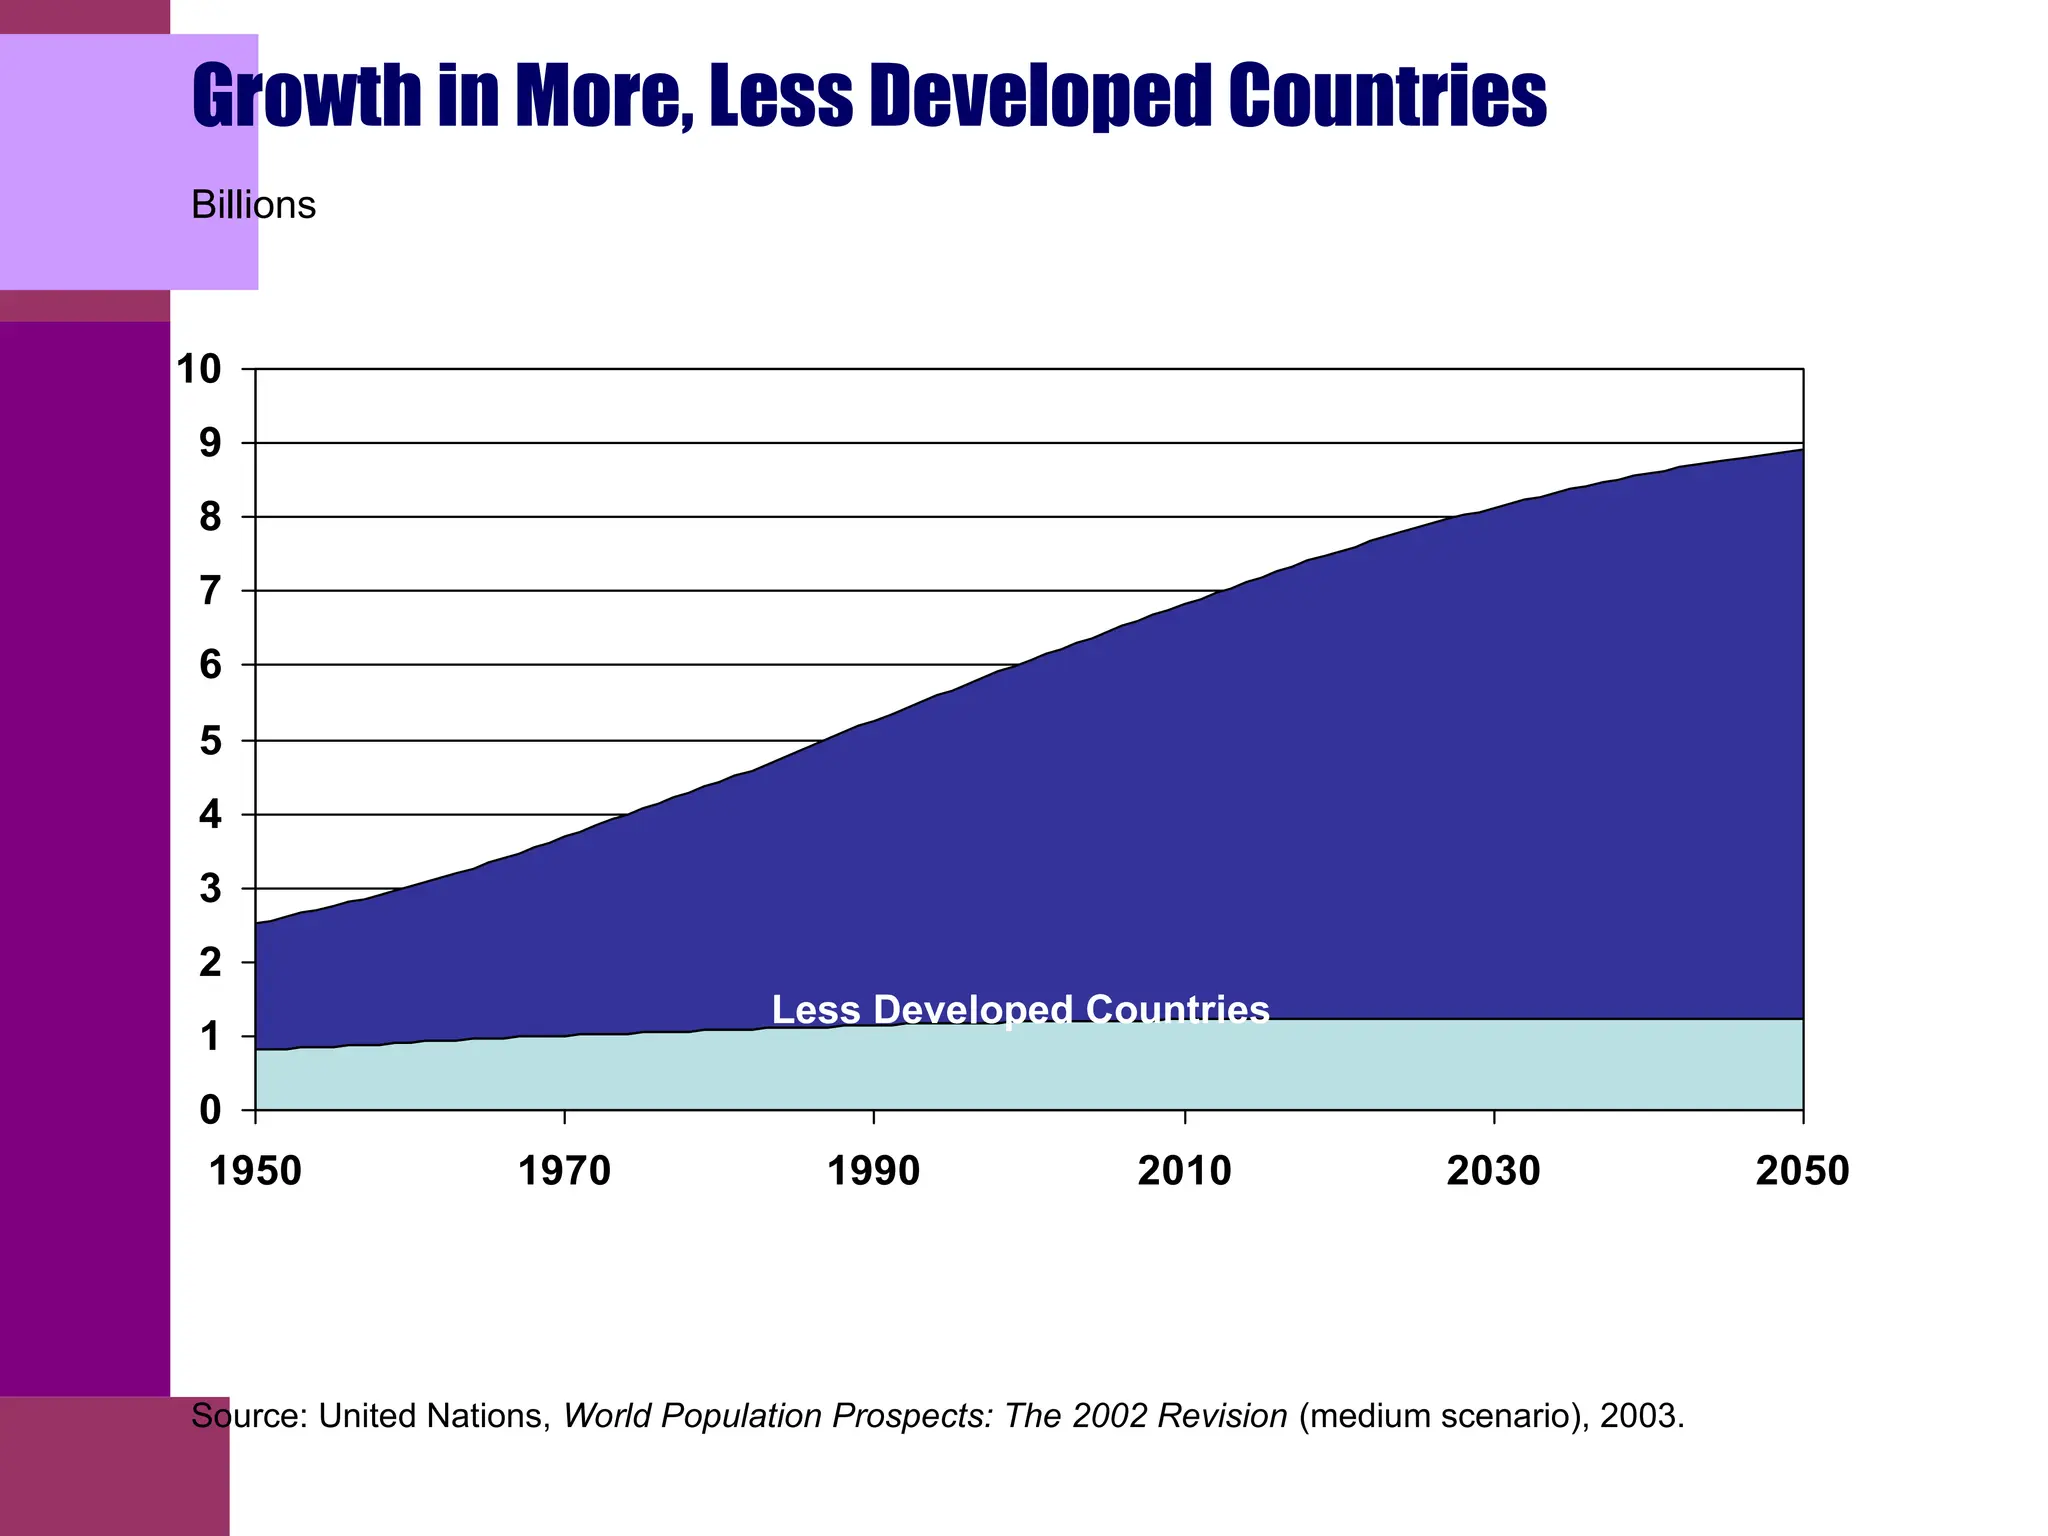
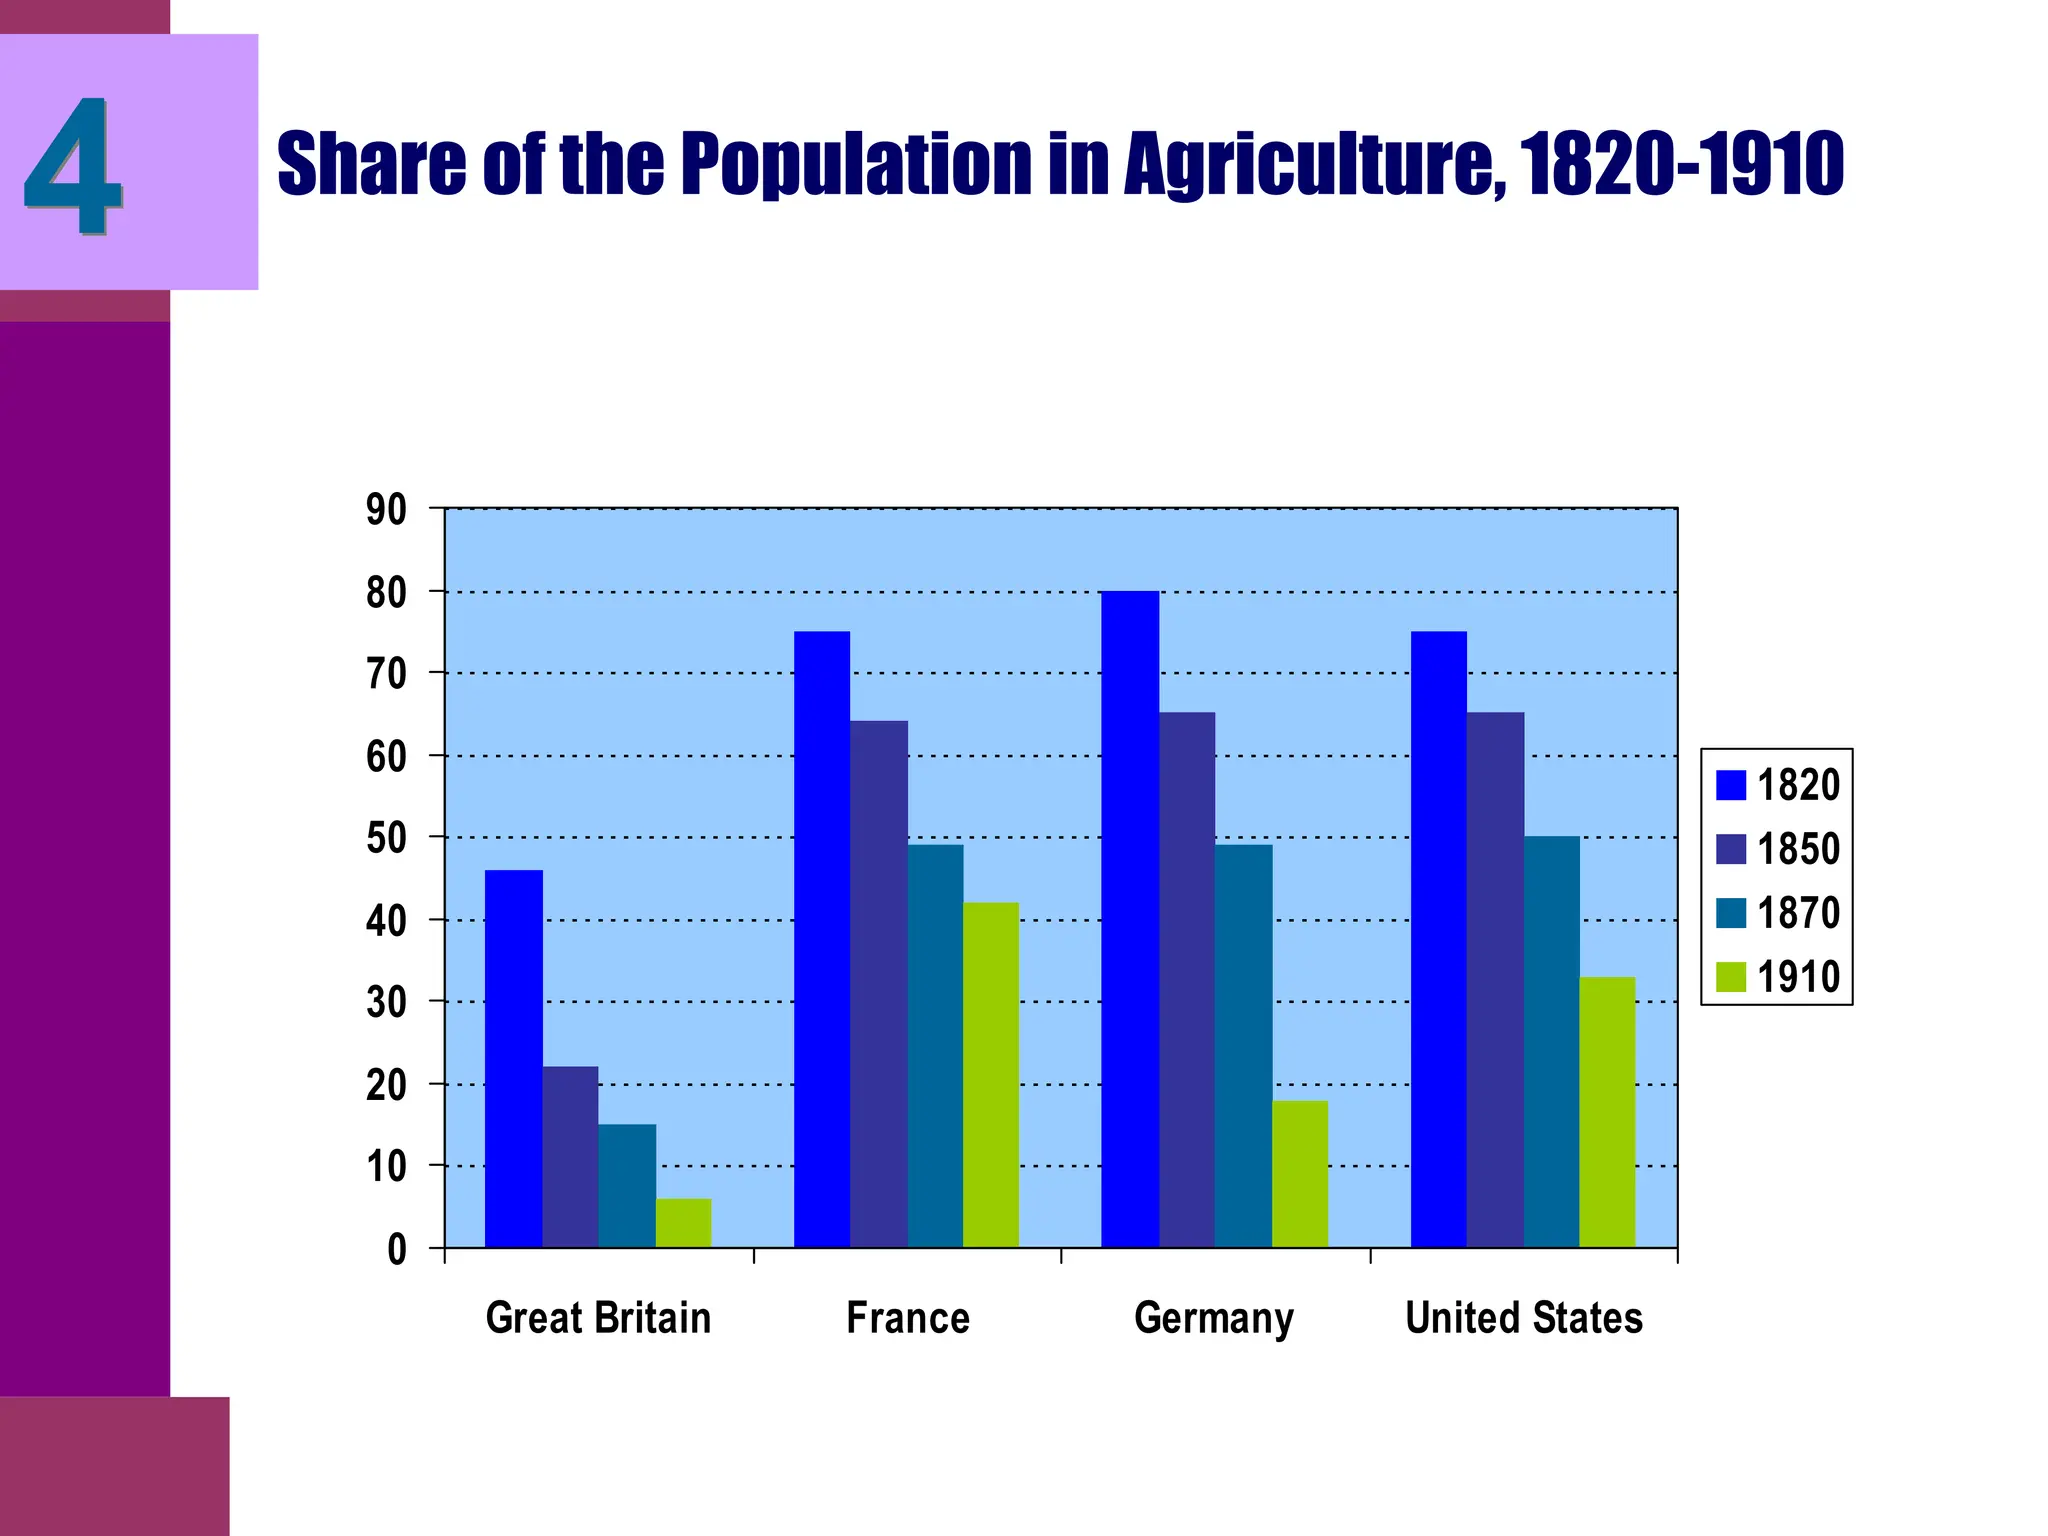
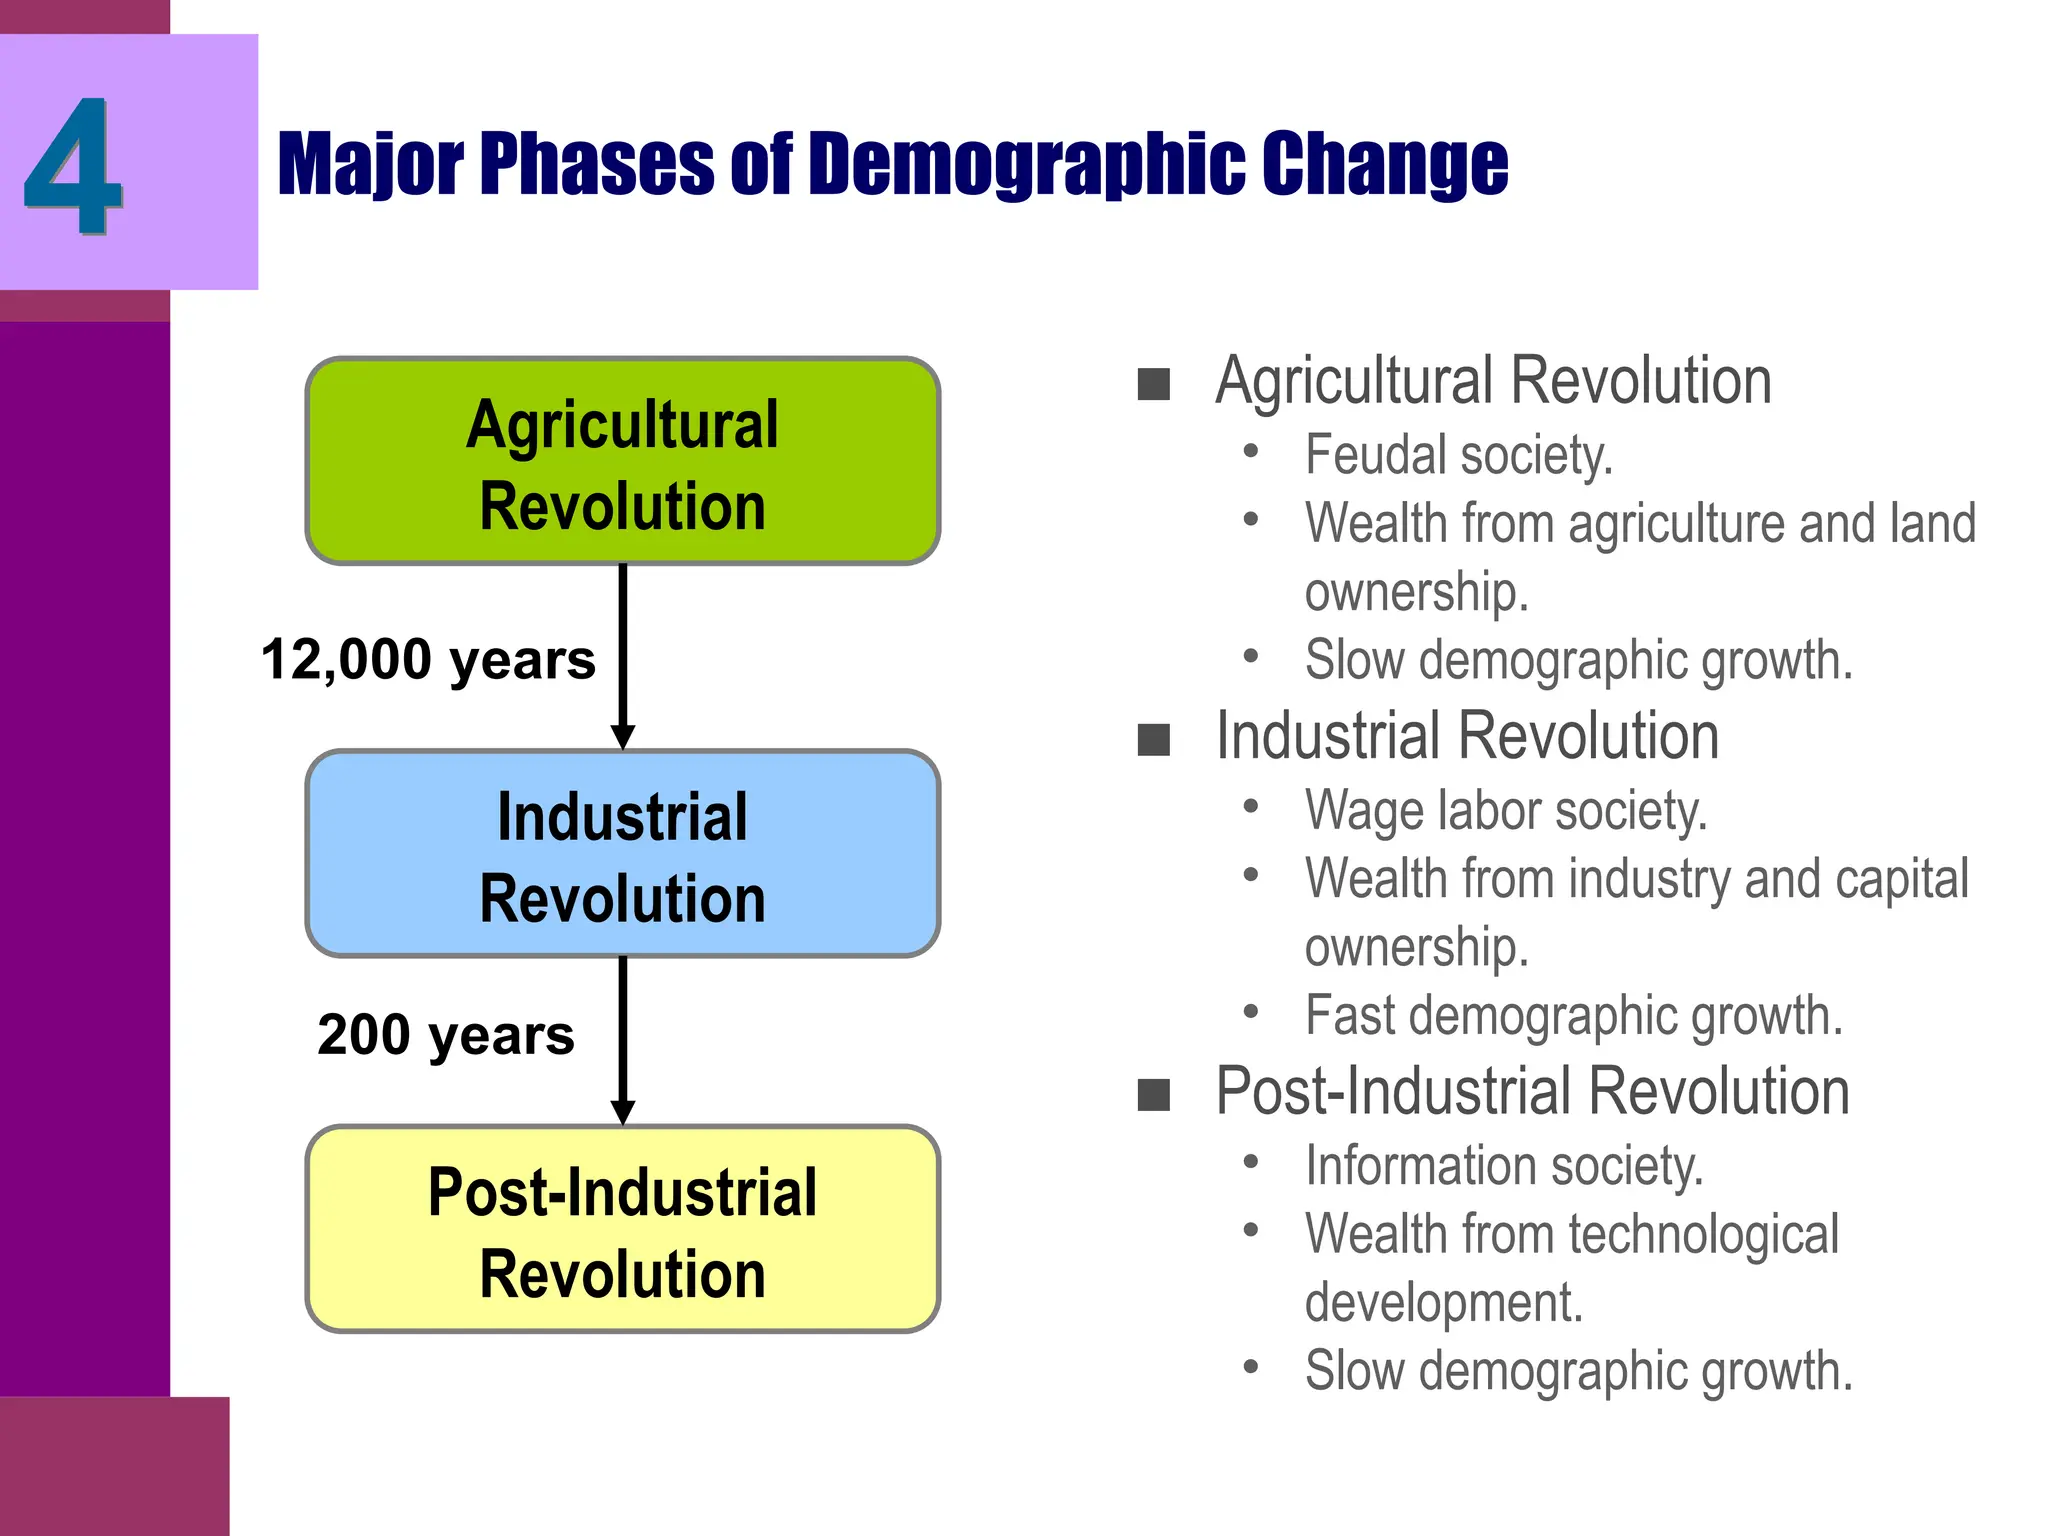
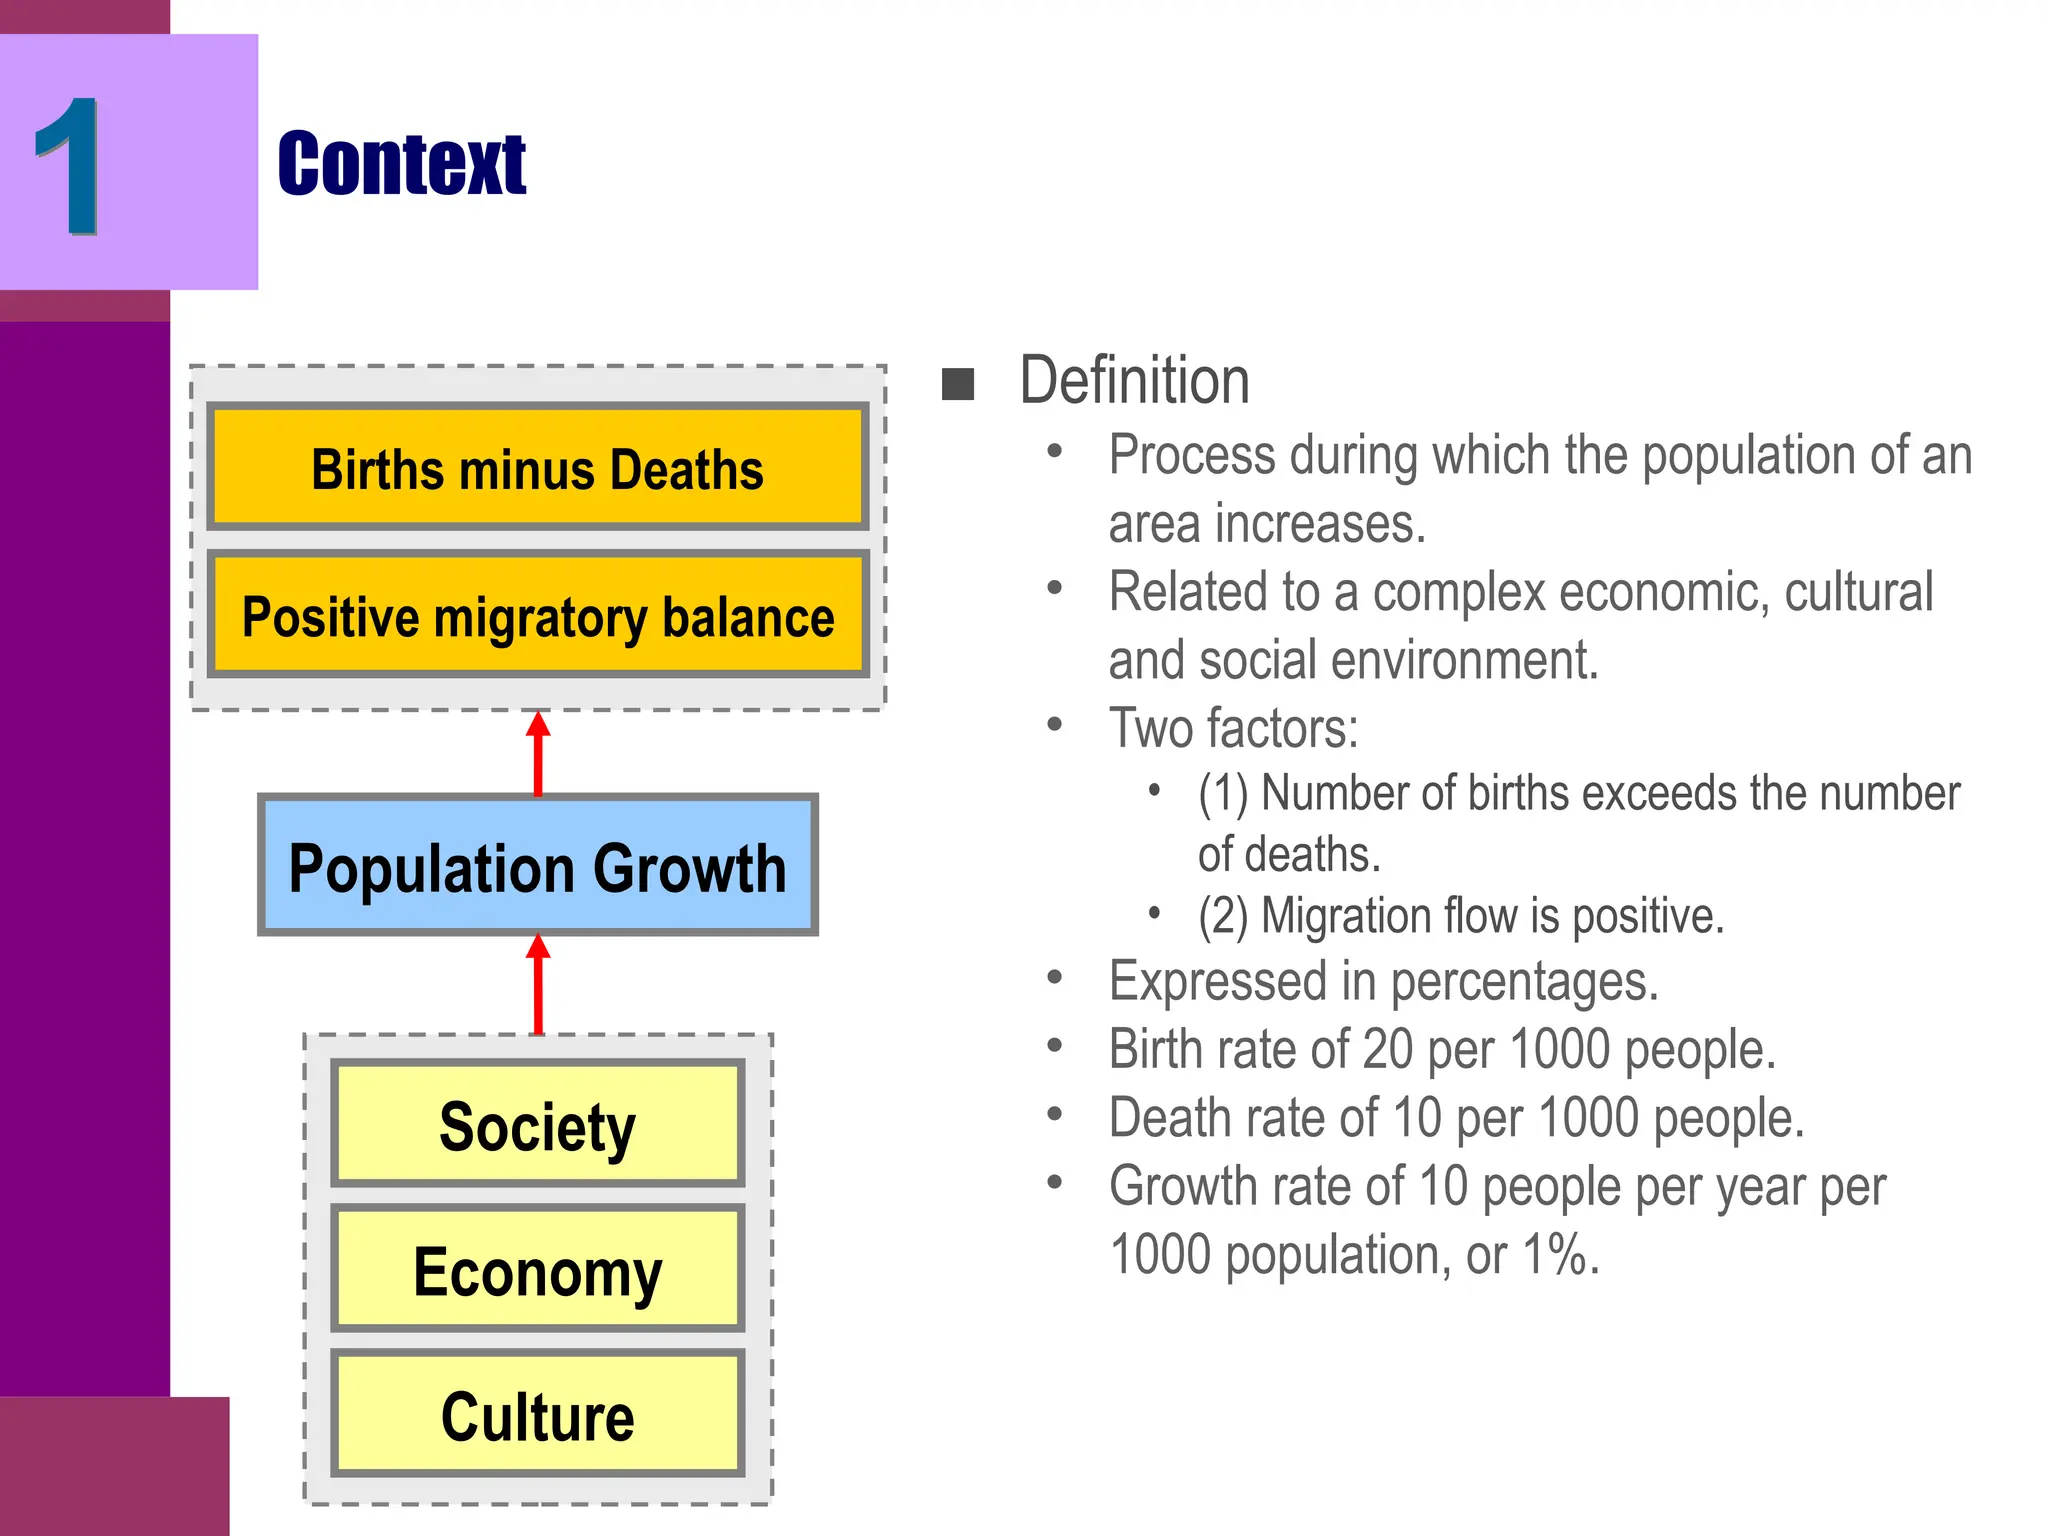
POPULATION GEOGRAPHY
Mdm Masayu Mahmud
Innova JC
Weeks 2-3 ( Human Geography Lecture 1-2)
The History of Population Attributes of Populations
1) Demography and Population Geography
A – Population Growth
B – Fertility
C – Mortality
D – Population Profiles
E – Population Capacity
What’s different about population geography at ‘A’
Levels
■ Facts
■ Focus
■ Explanations
F ( socio-cultural, economic, political, environmental,
historical)
■ Use of statistics
■ Case Study
■ Critique of policies
■ Use of theories
■ Models in population Geography
Overpopulation???
Population Geography
■ 1. Demography and Population Geography
• How population issues are investigated?
■ 2. Global Demographic Trends
• What are the major global demographic trends?
■ 3. The Agricultural Revolution
• What permitted the creation of the first civilizations?
■ 4. The Industrial Revolution
• How the modern society emerged?
A
Demography and Population Geography
■ Demography
• Systematic analysis of population phenomena through empirical,
statistical and mathematical methods.
• Interested about changes in the population size and composition.
■ Population Geography
• Concerned by the spatial aspects of population:
• 1- Simple description of the location of the population.
• 2- Explanation of its spatial pattern and distribution.
• 3- Geographical analysis (processes such as urbanization and migration).
• Demography rather emphasizes on time while population
geography emphasizes on space.
1
Diffusion of Homo Sapiens Around the World
Origins:
7 million BC
By 1,000,000 BC
By 500,000 BC
By 20,000 BC
By 12,000 BC
By 11,000 BC
By 10,000 BC
By 2,000 BC
1
By 40,000 BC
33,000 BC
AD 1,000
AD 500
1,200 BC
2 Demography and Population Geography
■ Evolution of the world’s population
• Long historical process:
• Has been very slow up to recently.
• 300 million people around year 0.
• Remained small until the last 250 years.
• A new growth trend:
• Has increased almost exponentially.
• From 1.6 billion in 1900 to 6 billion in 1999.
• To what it can be linked?
■ Population “explosion”
• Defines a process of strong demographic growth.
• Started after the Second World War.
• About 80 million people added each year.
• Major concern for the future of humanity.
World Population 1804-2054 (in billions)
1804
1927
1960
1974
1987
1999
2013
2028
2054
0
1
2
3
4
5
6
7
8
9
10
1800 1850 1900 1950 2000 2050
2
127 years
33 years
14 years
13 years
12 years
14 years
15 years
26 years
10 Largest Countries, 2001 and 2050 (in millions)
2
2001 2050
0 500 1000 1500
India
China
US
Pakistan
Indonesia
Nigeria
Bangladesh
Brazil
Congo
Ethiopia
0 500 1000 1500
China
India
US
Indonesia
Brazil
Russia
Pakistan
Bangladesh
Japan
Nigeria
3 The Agricultural Revolution
■ Nature
• Started around 10,000 BC (12,000 years ago).
• First major demographic change in human history.
• World’s population was around 5-10 million of mostly nomadic
tribes.
• Likely occurred around the Fertile Crescent (Mesopotamia):
• Tigris and Euphrates rivers in today’s Iraq.
• Domestication of crops and animals:
• Large-scale agricultural production possible and leading to agrarian
societies.
• “Dawn of civilization”.
• Invention of the plow, the wheel, writing, and numbers.
Agricultural Hearths
3
Nile
(5,000 B.C.)
Mesopotamia
(6,500 B.C.)
Indus
(4,700 B.C.)
Ganges
(4,700 B.C.)
Huang He
(4,500 B.C.)
3 The Agricultural Revolution
■ Change of lifestyles
• Population went from nomadic to sedentary lifestyle.
• Created private property, tools and the accumulation of wealth.
• Subsequently the creation of the state.
• By 1500, 20% of the world was composed of statehoods.
■ Agricultural surpluses
• Farming allowed greater population densities and the generation
of an agricultural surplus.
• A growing share of the population was able to engage in non-
agricultural activities.
• Induced all sorts of innovations such as irrigation, craftsmanship,
and metallurgy.
The Agricultural Revolution
Agricultural Innovation
Food Surpluses
Division of Labor
• Urbanization
• Sedentary lifestyle
• Specialization
• Stratification
■ Specialization
• Development of trade.
• Creation of the first cities.
■ Stratification
• An elite gained control of surplus
resources and defended their
position with arms.
• Centralization of power and
resources:
• Led to the development of the
state.
• The rich and powerful developed
the institutions of the state to
further consolidate their gains.
3
The Agricultural Revolution
■ The Feudal society
• A system of bonds and obligations:
• Royalties from the serf to the lord of a share of the agricultural production.
• Highly constraining system:
• Administrative/legal (Lord) and religious (Church) control.
• Fixation of the productive forces (tools and labor) in agricultural
production.
• Economy:
• Low levels of productivity (subsistence level).
• Profits taken away by the lord/church, inhibiting any increases in
agricultural productivity.
• 80 to 90% of the population was in agriculture while the other share were
artisans and landowners.
• Different types of feudal societies (China, Japan, Europe).
3
The Agricultural Revolution
■ Demographic consequences
• High birth rates:
• A feudal society required large families.
• Help agricultural activities that were very labor intensive.
• No contraceptives.
• High death rates:
• Wars between competing city-states.
• Frequent disruption of food supplies.
• Medicine almost non-existent.
• Epidemics: One famous plague, the Black Death, reduced European
population by 25% between 1346 and 1348.
• Life expectancy around 30-35 years.
• The population growth rate remained low.
• Small cities of at most 25,000 people.
3
4 The Industrial Revolution
■ Nature
• Started at the end of the eighteenth century (1750-1780).
• Transformations first observed in England.
• Demographic transition of the population:
• Fast growth rate.
• This demographic theory is discussed in a subsequent chapter.
• Economic and social transformations.
■ Technological innovations
• Use of new materials (steel, iron, chemicals).
• Usage of thermal energy to produce mechanical energy.
• Substitution of machines to human and animal labor.
• Production (factory).
• Transportation (rail).
• Health (medicine).
The Industrial Revolution
■ Agriculture
• Less agricultural population.
• Growth of the production of food.
• Mechanization and fertilizers.
• Scientific and commercial agriculture.
■ Social changes
• Significant urbanization.
• Creation of a labor class.
• Migration from the countryside to cities:
• By 1870 more of the half of the population of the first industrial nations
was no longer in the agricultural sector.
• England had reached this stage since 1820.
• Towards 1901, 75% of the English population lived in cities.
4
A.D.
2000
A.D.
1000
A.D.
1
1000
B.C.
2000
B.C.
3000
B.C.
4000
B.C.
5000
B.C.
6000
B.C.
7000
B.C.
1+ million
years
8
7
6
5
2
1
4
3
Old
Stone
Age New Stone Age
Bronze
Age
Iron
Age
Middle
Ages
Modern
Age
Black Death —The Plague
9
10
11
12
A.D.
3000
A.D.
4000
A.D.
5000
1800
1900
1950
1975
2000
2100
Future
Billions
Source: Population Reference Bureau; and United Nations, World Population Projections to 2100 (1998).
World Population Growth Through History
Billions
0
1
2
3
4
5
6
7
8
9
10
1950 1970 1990 2010 2030 2050
Less Developed Countries
More Developed Countries
Source: United Nations, World Population Prospects: The 2002 Revision (medium scenario), 2003.
Growth in More, Less Developed Countries
Share of the Population in Agriculture, 1820-1910
0
10
20
30
40
50
60
70
80
90
Great Britain France Germany United States
1820
1850
1870
1910
4
Major Phases of Demographic Change
■ Agricultural Revolution
• Feudal society.
• Wealth from agriculture and land
ownership.
• Slow demographic growth.
■ Industrial Revolution
• Wage labor society.
• Wealth from industry and capital
ownership.
• Fast demographic growth.
■ Post-Industrial Revolution
• Information society.
• Wealth from technological
development.
• Slow demographic growth.
4
Agricultural
Revolution
Industrial
Revolution
Post-Industrial
Revolution
12,000 years
200 years
Major Phases of Socioeconomic Change
Stone Age Feudalism Industrial Planetary
Organization Tribe / Village
City-state,
Kingdom
Nation-state
Global
governance
Economy
Hunting and
gathering
Settled
agriculture
Industrial
system
Globalization
Communications Language Writing Printing Internet
4
Fertility
■ 1. Context
■ 2. Growth Rates
■ 3. Doubling Time
A
Distribution of population across regions?
http://www.newint.org/issue309/Images/population.gif
Context
■ Definition
• Process during which the population of an
area increases.
• Related to a complex economic, cultural
and social environment.
• Two factors:
• (1) Number of births exceeds the number
of deaths.
• (2) Migration flow is positive.
• Expressed in percentages.
• Birth rate of 20 per 1000 people.
• Death rate of 10 per 1000 people.
• Growth rate of 10 people per year per
1000 population, or 1%.
1
Population Growth
Society
Economy
Culture
Births minus Deaths
Positive migratory balance
World Population Clock
Natural Increase
per World
More Developed
Countries
Less Developed
Countries
Less Developed
Countries (less
China)
Year 80,903,481 916,337 79,987,144 71,675,164
Day 221,653 2,511 219,143 196,370
Minute 154 2 152 136
Source: Population Reference Bureau, 2003 World Population Data Sheet.
Top ten contributors to world population growth,
1995-2000
15,999,000
11,408,000
4,048,000
2,929,000
2,511,000
2,267,000
2,154,000
2,108,000
1,547,000
0 5,000,000 10,000,000 15,000,000 20,000,000
India
China
Pakistan
Indonesia
Nigeria
United States
Brazil
Bangladesh
Mexico
1
Millions
Annual Increase in World Population
0
10
20
30
40
50
60
70
80
90
100
1951 1956 1961 1966 1971 1976 1981 1986 1991 1996 2001
Source: United Nations, World Population Prospects: The 2002 Revision, 2003.
Population Structures by Age and Sex, 2005
Millions
300 100 100 300
300 200 100 0 100 200 300
Less Developed
Regions
More Developed
Regions
Male Female Male Female
80+
75-79
70-74
65-69
60-64
55-59
50-54
45-49
40-44
35-39
30-34
25-29
20-24
17-19
10-16
5-9
0-4
Age
Source: United Nations, World Population Prospects: The 2002 Revision (medium scenario), 2003.
Age Distribution of the World’s Population
Uncontrolled Growth Rates?
Diverging Trends in Fertility Reduction
Average number of children per woman
6.7
6.0
6.6
7.0
5.5
6.9
6.3
5.8
8.2
3.5
7.0
5.1
3.3
3.0
2.4 2.3 2.4
4.3
Bangla-
desh
Egypt India Indo-
nesia
Iran Nepal Pakistan Turkey Yemen
1950-1955 2000-2005
Source: United Nations, World Population Prospects: The 2002 Revision (medium scenario), 2003.
Millions
Source: United Nations, World Urbanization Prospects: The 2003 Revision (medium scenario), 2004.
1950 2000 2015
Largest Cities, Worldwide
8
11 12
17 18
34
21
23
36
London Tokyo New
York
Sao
Paulo
Mexico
City
Tokyo Dheli Mumbai
(Bombay)
Tokyo
Decline or Growth, 2002-2025
Percent
3
12
-17
-14
-8
6
Bulgaria (1.1)
Russia (1.1)
Italy (1.2)
Trinidad & Tobago (1.6)
South Korea (1.4)
China (1.8)
Country (average number of children per woman)
Source: United Nations, World Population Prospects: The 2002 Revision (medium scenario), 2003.
Population in Countries With Low Fertility
1.10
1.10
1.10
1.00
1.14
1.16
1.15
1.15
1.15
1.14
Czech Republic
Armenia
Ukraine
Spain
Russian Federation
Slovenia
Macao Special Adminstrative Region
Bulgaria
Latvia
Hong Kong Special Administrative Region
10 Places With the Lowest Birth Rates Worldwide
Average number of children per woman, 2000-2005
Source: United Nations, World Population Prospects: The 2002 Revision (medium scenario), 2003.
Trends in Population Growth Worldwide
Population Increase and Growth Rate, Five-Year Periods
79
87
82
79 77 75 73
69
0
10
20
30
40
50
60
70
80
90
1980-
1985
1985-
1990
1990-
1995
1995-
2000
2000-
2005
2005-
2010
2010-
2015
2015-
2020
0
0.2
0.4
0.6
0.8
1
1.2
1.4
1.6
1.8
2
Net population added per year Annual population growth rate
Millions
Percent
increase
per
year
Source: United Nations, World Population Prospects: The 2002 Revision (medium scenario), 2003.
Number of Women 15 to 49
Billions
0.62
0.86
1.31
1.75
1.97
2.05
1950 1970 1990 2010 2030 2050
Source: United Nations, World Population Prospects: The 2002 Revision (medium scenario), 2003.
Women of Childbearing Age
Context
■ Reasons for huge population growth
• Achieved “death control” more effectively then birth control.
• Modern medicine:
• Vastly decreased the number of deaths from many diseases (malaria,
yellow fever, etc.).
• Famine:
• Reduced through better agriculture, distribution, storage and by
international aid mechanisms.
• Infant mortality:
• Decreased in most areas.
• Improvement in the availability and quality of the water supply:
• Improved hygiene conditions.
• Decreased deaths caused by water borne diseases.
1
Context
■ Birth control has been more difficult to achieve
• Religious beliefs.
• Cultural traditions.
• The importance of children as help, labor and security.
• The role of women is very limited in many societies.
1
Impact of Religious Beliefs?
Growth Rates
■ High growth
• 2% and above.
• Characteristic of many Third
World countries.
■ Average growth
• Between 1 and 2%.
• Much of Latin America and parts
of Asia, including China.
■ Low growth
• Between 0 and 1%.
• Europe, the United States and
Canada are currently in this
range.
■ Zero population growth (ZPG)
• Less than 0%.
• Several European countries.
2
High
ZPG
Average
Low
2.0%
1.0%
0.0%
Population Growth Rate, 2000
Not Available
Less than 0%
0% to 0.5%
0.5% to 1.0%
1.0% to 1.5%
1.5% to 2.5%
More than 2.5%
2
Population Change between 2000 and 2050 (%)
-30 -20 -10 0 10 20 30
Ireland
United States
France
Sweden
Britain
Poland
Netherlands
Germany
Russia
Spain
Italy
2
3 Scenarios of Global Population Growth, 2005-2050
0
2,000
4,000
6,000
8,000
10,000
12,000
1
9
5
0
1
9
6
0
1
9
7
0
1
9
8
0
1
9
9
0
2
0
0
0
2
0
1
0
2
0
2
0
2
0
3
0
2
0
4
0
2
0
5
0
High
Low
Medium
2
Population of Russia, Japan Italy, 1950-2050 (in
millions)
0
20
40
60
80
100
120
140
160
1950 1960 1970 1980 1990 2000 2010 2020 2030 2040 2050
Russia
Japan
Italy
2
Doubling Time
■ Definition
• Length of time necessary for an area (usually a nation) to double
its population.
• The mathematics of population work very much like
compounding interest.
• Percentage of increase is applied to an ever-increasing base.
• Simple equation: 72 / Growth rate.
■ Implications
• The faster the growth rate the lower the doubling time:
• 1% growth rate: 72 years.
• 4% growth rate: 19 years.
• Infinite doubling time: no growth or negative growth.
3
Doubling Time as of 2000
More than 250 years
100 to 250 years
50 to 100 years
25 to 50 years
Less than 25 years
ZPG
NA
3
Fertility
■ 1. Crude Birth Rate
■ 2. Total Fertility Rate
■ 3. Factors Influencing Fertility
B
1 Crude Birth Rate
■ Crude Birth Rate (CBR) or
General Fertility Rate (GFR)
• Number of live births per year per
1000 population.
• Both males and females are
considered.
• All the population is considered,
even the non-reproductive segment
(children, elderly).
• Numbers like 10, 20, 40, etc.
25 males of any age
25 females of any age
1,000
10 children born that year
30
CBR = 30
Total Fertility Rate
■ Total Fertility Rate (TFR)
• Number of live births per female of
reproductive age (15-49).
• Numbers such as 2.2, 4.5.
• Indicates population change over a
long period of time.
• Instructive about societal norms in
any given culture.
• A TFR of 2.1 is considered as being
the replacement birth rate.
• Lower than 2.1 yields population
decrease while rates greater than 2.1
yields population increase.
• Improvements in medical conditions
lower the replacement rate (below
2.06 in many countries).
2
25 females between 15-49
10 children born that year
1,000
60
TFR = 2.04
= (60/1,000) * (49-15)
Total Fertility Rate, 1994-2000
0 1 2 3 4 5 6 7 8
Yemen
Niger
Jordan
Mexico
Brazil
US
Russia
Italy
World
1994
2000
2
Replacement rate (2.1)
Total Fertility Rate, 1999
1.14 - 1.50
1.51 - 2.00
2.01 - 2.50
2.51 - 3.00
3.01 - 4.00
4.01 - 7.41
NA
2
Biological
Determinants
Social
Determinants
Economic
Determinants
Factors Influencing Fertility
3
Fertility
Factors Influencing Fertility
■ Biological determinants
• Age:
• Reproductive age of women ranges from 15-44 or from 15-49.
• Men: 13-??
• Health and nutrition:
• Poor health and/or nutrition can reduce fertility.
• Linked with underweight children.
• Linked with child mortality rates.
• Environment:
• Represents an undocumented impacts on fertility.
• Stressed populations tend to have less males than females.
• Possible correlation between sperm count and pollution.
3
Birth Rate per Age Group, United States, 1965, 1999
(per 1,000 women)
0
20
40
60
80
100
120
140
160
180
200
10-14
years
15-19
years
20-24
years
25-29
years
30-34
years
35-39
years
40-44
years
45-54
years
1965
1999
3
Average Sperm Count of Americans, 1938-98 (per ml)
40
50
60
70
80
90
100
110
120
130
1938
1941
1944
1947
1950
1953
1956
1959
1962
1965
1968
1971
1974
1977
1980
1983
1986
1989
1992
1995
1998
3
Factors Influencing Fertility
■ Social determinants
• The social norms and acceptance of practices affecting fertility.
• Differ from society to society.
• Marriage:
• Particularly the average age of marriage.
• The percentage of people never married varies spatially and affects
fertility rates.
• Late marriage age generally involves less children.
• Contraception:
• Used by 30-50% of all married couples.
• Availability of contraceptive devices and social attitudes toward their use
affect fertility rates.
• Sharp differences exist between DCs and LDCs.
• Some notable exceptions, such as China and Cuba.
3
Factors Influencing Fertility
• Abortion:
• Last resort measure when contraception failed (or was not used).
• Its legality is not universal and under challenge in some countries where it
is permitted.
• Global figures (1999):
– 210 million pregnancies.
– 22% of all pregnancies end up in a abortion.
– 46.2 million abortions, of which 20 million procedures are obtained illegally.
• Illegal abortions are common in most societies where it is prohibited.
• Culture plays an important determining role in the impact of abortion.
• United States: 49% all pregnancies unwanted and about half of unwanted
pregnancies ended in abortion (1.4 million abortions per year).
3
Pregnancies and Abortions per Women Aged 15-19
Years, 1998
18
16.4
17.1
17
16.8
18.9
0 20 40 60 80 100 120
Russia
United States
England
Canada
France
Japan Age at first intercourse
Abortion rate (per 100)
Pregnancy rate (per 1000)
3
Factors Influencing Fertility
■ Economic determinants
• The role of children, or their “value” affects fertility.
• Inverse relationships:
• Fertility and income per capita.
• Fertility and urbanization.
• Traditional rural societies:
• Children still play an important economic role and contribute to family
wealth.
• Fertility is likely to remain higher.
• Industrial and post-industrial societies:
• Costs tend to increase with the development level of the society.
• Deflate the fertility rate since parents must consider the direct and
opportunity costs of bearing additional children.
3
Factors Influencing Fertility
• Direct costs lost:
• For the support of children.
• Food, clothing, housing, education, etc.
• Opportunity costs lost:
• Lower standard of living.
• Reduce the ability to save and invest.
• Labor force participation of women is affected by child-bearing.
3
Mortality
■ 1. Crude Death Rate
■ 2. Infant Mortality Rate
■ 3. Life Expectancy
■ 4. Epidemiological Transition
C
1 Crude Death Rate
■ Death rate
• Easiest of the variables to
consider.
• Occurs just once per person and is
the most recorded.
■ Crude Death Rate (CDR)
• Annual number of deaths per 1000
population (all ages included).
25 males of any age
25 females of any age
1,000
10 people who died that year
30
CDR = 30
Crude Death Rate
■ Causes of death
• Throughout most of history famine, epidemics, and wars have
been the leading causes of death.
• Primary causes of death began to shift to degenerative problems
related to aging.
• These include such factors as heart disease and cancer.
■ Death and welfare
• Used to be considered a sign of the health of a population.
• Different age structures among the populations of different
countries.
• Possible for a nation with high living standards to have a higher
death rate than a poorer nation.
• Reason: overall older population.
1
Crude Death Rate, 2000
Less than 5.00
5.01 - 8.00
8.01 - 10.00
10.01 - 12.00
12.01 - 15.00
More than 15.00
NA
1
Fertility and Mortality in the United States, 1950-
2000 (in 1000s)
0
500
1,000
1,500
2,000
2,500
3,000
3,500
4,000
4,500
Births
Deaths
1
Infant Mortality Rate
■ Definition
• Expressed in numbers of deaths of infants under one year per
1000 live births of the same year.
• Also considers the death of children under 5 per 1000 in their
cohort.
• High levels of infant mortality pull down life expectancy rates.
• Reflects the quality of the health system.
• Very strong differences between developed and developing
countries.
2
Infant Mortality Rate, 2000
Less than 6.00
6.01 - 10.00
10.01 - 20.00
20.01 - 50.00
50.01 - 100.00
More than 100.00
NA
2
Causes of Death for Children under 5 in Developing
Countries
28%
25%
16%
5%
3%
17%
1% 5%
Diarrheal diseases
Immunizable diseases
Acute respiratory infections
Malaria
Other infectious/ parasitic diseases
Perinatal causes
Injuries
Other causes
2
Life Expectancy
■ Definition
• Number of years a person is expected to live.
• Based on current death rates.
• May change due to ameliorations in standards of living.
■ Context
• Strong geographical variations in life expectancy.
• Half a century ago, most people died before the age of 50.
• Global average life expectancy reached 65 years in 2000.
• Several achievements and failures:
• Economic development has benefited human health.
• Improvement in diet and sanitation.
• Urbanization may have adverse effects.
3
Life Expectancy at Birth, 1910 and 1998
30 40 50 60 70 80 90
England
Italy
Japan
Sweden
United States
1998 Females
1998 Males
1910 Females
1910 Males
3
World Average Life Expectancy and Life Expectancy
in Industrial and Developing Nations, 1950-2000
30
35
40
45
50
55
60
65
70
75
80
1950-55 1955-60 1960-65 1965-70 1970-75 1975-80 1980-85 1985-90 1990-95 1995-00
World
Developing
Developed
3
% of Men and Women Expected to Survive to Age 80,
by Region (Among people born 1995-2000)
13
25
30
30
41
17
37
53
44
61
0 10 20 30 40 50 60 70
Africa
Asia
Europe
Latin America
North America
Female
Male
3
Yearly Cost of a $1,000,000 Life Insurance Premium,
2001
0
500
1000
1500
2000
2500
3000
35 40 45 50 55 60 65 70
Male
Female
3
Life Expectancy
■ Optimum life expectancy
• Life expectancy is ultimately dictated by human physiology:
• At some points, organs cease to function properly.
• Limit on the lifespan of non-cancerous human cells.
• Nearing life expectancy limits:
• Even if age-related diseases such cancer, heart disease, and stroke were
eradicated, life expectancy would only increase by 15 years.
• Currently around 76 years.
• Expected to reach 85 years in most developed countries by 2030.
3
Epidemiological Transition
■ Definition
• Focuses on changes over time in the causes of mortality
affecting certain populations:
• Health conditions.
• Disease patterns.
• Result in a decline in death rates and an increase of life
expectancy.
• The society goes through a transition from communicative
diseases to degenerative diseases.
4
Epidemiological Transition
■ Stages
• Three identifiable stages in the
transition.
• 1) Age of communicative
diseases.
• 2) Age of receding pandemics.
• 3) Age of degenerative and man-
made diseases.
Communicative Diseases
Receding Pandemics
Degenerative and Man-made Diseases
4
70 years
50 years
30 years
High Fertility
High Mortality
High Fertility
Decreasing Mortality
Low Fertility
Low Mortality
Population Profiles
■ 1. Population Pyramid
■ 2. Dependency Ratio
■ 3. Sex Structure
D
1 Population Pyramid
■ Definition
• Graph showing the breakdown of
each sex by age group (cohort).
• Illustrates a nation’s population
structure.
• Shows the male/female
composition of the population.
• Most of the time, the breakdown
involves 5 years periods.
0-15
15-30
30-45
45-60
60-75
75+
Females
Males
0
10 10
Percentage of the population
Age group
Population Pyramid of Mexico, 2000
-6 -4 -2 0 2 4 6
0-4
10-14
20-24
30-34
40-44
50-54
60-64
70-74
80-84
Millions
Female
Male
1
Population Pyramid of Sweden, 2000
-350 -250 -150 -50 50 150 250 350
0-4
10-14
20-24
30-34
40-44
50-54
60-64
70-74
80-84
Thousands
Female
Male
1
Population Pyramid
■ Mexican pyramid
• Much wider base than the others.
• Beginning of transition.
• Rapidly growing population where the percentage of people
under 15 years of age is high.
■ Sweden’s pyramid
• Does not appear to be a pyramid at all.
• Youngest component is smaller than its middle-aged population
and only slightly larger than its aged population.
• No-growth situation, since some deaths occur from all age
groupings.
• Sweden has a higher death rate than Mexico.
1
Population Pyramid of the United States, 2000
-12 -10 -8 -6 -4 -2 0 2 4 6 8 10 12
0-4
10-14
20-24
30-34
40-44
50-54
60-64
70-74
80-84
Millions
Female
Male
1
Population Pyramid
■ USA pyramid
• Lies in between the two situations mentioned above.
• Would be more like the Swedish pyramid were it not for large
amounts of immigration.
• Bulge in the 30-54 year old component:
• The baby boom generation.
• Small numbers in the 55-65 year old component:
• Low birth rates during the 1930s and during WW II.
• Dip in 20-29 segment of the population:
• Low birth rates during the 1970s and early 1980s.
• Limited immigration.
• Preponderance of women at the top of the pyramid, an indication
of their longer average life span.
1
Population Pyramid, Berlin 1946
-5 -4 -3 -2 -1 0 1 2 3 4 5
0-4
10-14
20-24
30-34
40-44
50-54
60-64
70-74
80-84
Percentage of the population
Female
Male
1
Population Pyramid
■ German pyramid
• Shows the most extreme example of population decline.
• Vast difference between males and females in the upper age
groups.
• Vast number of military casualties among the population which
fought the 2nd World War.
1
Dependency Ratio
■ Definition
• Comparison between the productive and non-productive
population.
• Often expressed in non-productive per 100 productive.
• Non-productive population:
• Refers to the very old (usually >65 years of age) and the very young
(usually <15).
• Considered to be the “non-productive” segments of society because they
are not part of the labor force.
• Productive years:
• Between 15 and 65.
• This portion of the population constitutes the labor force.
• Revised to consider lower than 20 years in developed countries
(increasing time spent for education).
2
Dependency Ratio
■ Implications
• Society incurs costs in supporting its dependent population.
• Old age generates social costs:
• Retirement benefits.
• Increased medical expenditures.
• Greater consumption of other social services.
• Youths:
• Not yet in the work force.
• Some medical costs.
• Great expenditures for education.
• National budgets often reflect these expenditures.
• Linked with the population pyramid:
• Pyramidal distributions have high dependency ratios.
• “Rectangular” distributions have high dependency ratios.
• Transitional pyramids have low dependency ratios.
2
Dependency Ratio of some Countries, 1990-1999 (per
100)
20 30 40 50 60 70 80 90 100 110
USA
Mexico
Germany
Sweden
Kenya
India
China 1999
1990
2
Dependency Ratio
■ Aging
• Major shift in health issues.
• 1995: 380 million people aged 65 years and above.
• 2020: over-65 population is projected to increase globally by
82%, to more than 690 million.
• For every baby born today in an industrialized country, there are
10 people aged 65 or over.
• By the year 2020 there will be 15 such elderly persons for each
newborn.
• In developing countries, the ratio today is 2 people over 65 for
every newborn, and 4 for every newborn by 2020.
2
Population 60 and Over, Industrial and Developing
Countries, 1950-95, With Projections to 2050
0
200
400
600
800
1000
1200
1400
1600
1
9
5
0
1
9
5
5
1
9
6
0
1
9
6
5
1
9
7
0
1
9
7
5
1
9
8
0
1
9
8
5
1
9
9
0
1
9
9
5
2
0
0
0
2
0
0
5
2
0
1
0
2
0
1
5
2
0
2
0
2
0
2
5
2
0
3
0
2
0
4
0
2
0
5
0
Developing countries
Developed countries
2
Percentage of the Population between 15 and 65,
2000
Less than 50.00
50.01 - 55.00
55.01 - 58.00
58.01 - 60.00
60.01 - 65.00
More than 65.00
NA
2
Dependency Ratio
■ Impacts
• Social security costs.
• Medical costs and the medical industry at large.
• Public sector funds such as the federal budget.
• Goods and services used by the elderly experience increasing
demand levels.
• Those used by the young and/or middle aged will decline in
relative importance.
• Local impacts (school districts).
2
Sex Structure
■ Definition
• Gender composition of a population.
• Males / Females * 100.
• Probability:
• Approximately equal probability of male and female births.
• Normally expect sex ratios to remain very close to 100.
• This is often not the case.
■ Factors
• Life expectancy at birth is greater for females (79 years) than for
males (72).
• Gap has increased steadily since 1920, when the difference was
just one year.
3
Sex Ratio (males per 100 females), 2000
Less than 90
90 - 95
95 - 100
100 - 105
105 - 110
More than 110
NA
3
Sex Ratio in the United States, 1820-2000 (males per
100 females)
90
92
94
96
98
100
102
104
106
108
1
8
2
0
1
8
3
0
1
8
4
0
1
8
5
0
1
8
6
0
1
8
7
0
1
8
8
0
1
8
9
0
1
9
0
0
1
9
1
0
1
9
2
0
1
9
3
0
1
9
4
0
1
9
5
0
1
9
6
0
1
9
7
0
1
9
8
0
1
9
9
0
2
0
0
0
3
Civil War
Immigration Boom
WWII
WWI
Life expectancy gap
Immigration Boom
Population Capacity
■ 1. Population Density
■ 2. Population Distribution
■ 3. Population Capacity
E
Population Density
■ Arithmetic density
• Relates the size of a population (P)
to the area which contains it (A).
• Number of people per square mile or
square kilometer.
• Without regard to the productive
quality of the area.
• Distributional imbalances.
■ Physiological density
• Number of people per unit of
productive land.
• Productive is generally equated with
arable land (AL).
• Important figure to measure
sustainability.
1
AD = P / A
PD = P / AL
Arable land
Density Measures for Selected Countries, 1995 (in
people per square mile)
0 1000 2000 3000 4000 5000 6000 7000
Argentina
Australia
Bangladesh
Canada
China
Egypt
India
Iran
Japan
Nigeria
UK
USA
Physiological density
Arithmetic density
1
2 Population Distribution
■ Definition
• Considers the distribution of population densities over the earth’s
surface.
• Informative in assessing a nation’s population.
• Typical concentrations along major river systems.
• Areas of great concentration:
• South Asia.
• East Asia.
• Western Europe.
• Northeastern North America.
• “Empty” areas are attributed to:
• Harsh physical landscapes.
• Harsh temperature.
World Population Density and Distribution, 1995
2
Population Capacity
■ How many people can be
sustained by the Earth?
• Based on human choices and
natural constraints.
• Maximum density.
• Quantity of arable land.
• Agricultural technology.
• Harvesting the ocean.
• Human facilities.
• Availability of resources (energy,
construction materials, etc.).
3
Space
Resources
Technology
Consumption
3 Population Capacity
■ Demographic capacity
• Studies about nature’s capacity to support human life go back
many centuries.
• Leeuwenhoek (1679) extrapolated densities for Holland to the
whole planet (13.4 billion capacity).
• Focus:
• Space.
• Energy requirements.
• Non-renewable resources.
• Photosynthetic potentials.
• All are based on the same principle:
• Tracing resource and energy flows through the human economy.
Population Capacity
■ Ravenstein in 1891
• Concept of carrying capacity.
• Focused on the earth’s cultivable
areas, and their potential productivity
given increases in yields over time:
• Fertile: 200 people / km2.
• Steppe: 10 people / km2.
• Desert: 1 person / km2.
• Figure of 6 billion people as the
number Earth could sustain without
lowering living standards.
• Reached this number in 1999.
3
Arable land
Agricultural
technology
Consumption
per capita
X
/
Population Capacity
■ Contemporary issues
• Events such as the Green Revolution were not foreseen by
Ravenstein.
• Managed to increase agricultural yields in many areas by
quantities far greater than he had anticipated.
• Efforts to calculate carrying capacity have largely failed.
• Too many variables.
• Value ranges between 4 and 16 billion.
3
Population Capacity
0
2
4
6
8
10
12
Americans Indians
Billions
■ Level of consumption
• Alternative perspective.
• The issue is not resource supply, but
resource demand.
• The world is producing only a finite
number of resources for consumption.
• Demographic capacity is linked with level
of resource consumption.
■ American (lifetime)
• 1 million kg of atmospheric waste.
• 10 million kg of liquid waste.
• 1 million kg of solid waste.
• 700,000 kg of minerals.
• 24 billion BTU of energy.
• 25,000 kg of plants.
• 2,000 animals (28,000 kg).
3

253732893-Introduction-to-Population-Geography.ppt

  • 1.
    POPULATION GEOGRAPHY Mdm MasayuMahmud Innova JC Weeks 2-3 ( Human Geography Lecture 1-2) The History of Population Attributes of Populations 1) Demography and Population Geography A – Population Growth B – Fertility C – Mortality D – Population Profiles E – Population Capacity
  • 2.
    What’s different aboutpopulation geography at ‘A’ Levels ■ Facts ■ Focus ■ Explanations F ( socio-cultural, economic, political, environmental, historical) ■ Use of statistics ■ Case Study ■ Critique of policies ■ Use of theories ■ Models in population Geography
  • 3.
  • 4.
    Population Geography ■ 1.Demography and Population Geography • How population issues are investigated? ■ 2. Global Demographic Trends • What are the major global demographic trends? ■ 3. The Agricultural Revolution • What permitted the creation of the first civilizations? ■ 4. The Industrial Revolution • How the modern society emerged? A
  • 5.
    Demography and PopulationGeography ■ Demography • Systematic analysis of population phenomena through empirical, statistical and mathematical methods. • Interested about changes in the population size and composition. ■ Population Geography • Concerned by the spatial aspects of population: • 1- Simple description of the location of the population. • 2- Explanation of its spatial pattern and distribution. • 3- Geographical analysis (processes such as urbanization and migration). • Demography rather emphasizes on time while population geography emphasizes on space. 1
  • 6.
    Diffusion of HomoSapiens Around the World Origins: 7 million BC By 1,000,000 BC By 500,000 BC By 20,000 BC By 12,000 BC By 11,000 BC By 10,000 BC By 2,000 BC 1 By 40,000 BC 33,000 BC AD 1,000 AD 500 1,200 BC
  • 7.
    2 Demography andPopulation Geography ■ Evolution of the world’s population • Long historical process: • Has been very slow up to recently. • 300 million people around year 0. • Remained small until the last 250 years. • A new growth trend: • Has increased almost exponentially. • From 1.6 billion in 1900 to 6 billion in 1999. • To what it can be linked? ■ Population “explosion” • Defines a process of strong demographic growth. • Started after the Second World War. • About 80 million people added each year. • Major concern for the future of humanity.
  • 8.
    World Population 1804-2054(in billions) 1804 1927 1960 1974 1987 1999 2013 2028 2054 0 1 2 3 4 5 6 7 8 9 10 1800 1850 1900 1950 2000 2050 2 127 years 33 years 14 years 13 years 12 years 14 years 15 years 26 years
  • 9.
    10 Largest Countries,2001 and 2050 (in millions) 2 2001 2050 0 500 1000 1500 India China US Pakistan Indonesia Nigeria Bangladesh Brazil Congo Ethiopia 0 500 1000 1500 China India US Indonesia Brazil Russia Pakistan Bangladesh Japan Nigeria
  • 10.
    3 The AgriculturalRevolution ■ Nature • Started around 10,000 BC (12,000 years ago). • First major demographic change in human history. • World’s population was around 5-10 million of mostly nomadic tribes. • Likely occurred around the Fertile Crescent (Mesopotamia): • Tigris and Euphrates rivers in today’s Iraq. • Domestication of crops and animals: • Large-scale agricultural production possible and leading to agrarian societies. • “Dawn of civilization”. • Invention of the plow, the wheel, writing, and numbers.
  • 11.
    Agricultural Hearths 3 Nile (5,000 B.C.) Mesopotamia (6,500B.C.) Indus (4,700 B.C.) Ganges (4,700 B.C.) Huang He (4,500 B.C.)
  • 12.
    3 The AgriculturalRevolution ■ Change of lifestyles • Population went from nomadic to sedentary lifestyle. • Created private property, tools and the accumulation of wealth. • Subsequently the creation of the state. • By 1500, 20% of the world was composed of statehoods. ■ Agricultural surpluses • Farming allowed greater population densities and the generation of an agricultural surplus. • A growing share of the population was able to engage in non- agricultural activities. • Induced all sorts of innovations such as irrigation, craftsmanship, and metallurgy.
  • 13.
    The Agricultural Revolution AgriculturalInnovation Food Surpluses Division of Labor • Urbanization • Sedentary lifestyle • Specialization • Stratification ■ Specialization • Development of trade. • Creation of the first cities. ■ Stratification • An elite gained control of surplus resources and defended their position with arms. • Centralization of power and resources: • Led to the development of the state. • The rich and powerful developed the institutions of the state to further consolidate their gains. 3
  • 14.
    The Agricultural Revolution ■The Feudal society • A system of bonds and obligations: • Royalties from the serf to the lord of a share of the agricultural production. • Highly constraining system: • Administrative/legal (Lord) and religious (Church) control. • Fixation of the productive forces (tools and labor) in agricultural production. • Economy: • Low levels of productivity (subsistence level). • Profits taken away by the lord/church, inhibiting any increases in agricultural productivity. • 80 to 90% of the population was in agriculture while the other share were artisans and landowners. • Different types of feudal societies (China, Japan, Europe). 3
  • 15.
    The Agricultural Revolution ■Demographic consequences • High birth rates: • A feudal society required large families. • Help agricultural activities that were very labor intensive. • No contraceptives. • High death rates: • Wars between competing city-states. • Frequent disruption of food supplies. • Medicine almost non-existent. • Epidemics: One famous plague, the Black Death, reduced European population by 25% between 1346 and 1348. • Life expectancy around 30-35 years. • The population growth rate remained low. • Small cities of at most 25,000 people. 3
  • 16.
    4 The IndustrialRevolution ■ Nature • Started at the end of the eighteenth century (1750-1780). • Transformations first observed in England. • Demographic transition of the population: • Fast growth rate. • This demographic theory is discussed in a subsequent chapter. • Economic and social transformations. ■ Technological innovations • Use of new materials (steel, iron, chemicals). • Usage of thermal energy to produce mechanical energy. • Substitution of machines to human and animal labor. • Production (factory). • Transportation (rail). • Health (medicine).
  • 17.
    The Industrial Revolution ■Agriculture • Less agricultural population. • Growth of the production of food. • Mechanization and fertilizers. • Scientific and commercial agriculture. ■ Social changes • Significant urbanization. • Creation of a labor class. • Migration from the countryside to cities: • By 1870 more of the half of the population of the first industrial nations was no longer in the agricultural sector. • England had reached this stage since 1820. • Towards 1901, 75% of the English population lived in cities. 4
  • 18.
    A.D. 2000 A.D. 1000 A.D. 1 1000 B.C. 2000 B.C. 3000 B.C. 4000 B.C. 5000 B.C. 6000 B.C. 7000 B.C. 1+ million years 8 7 6 5 2 1 4 3 Old Stone Age NewStone Age Bronze Age Iron Age Middle Ages Modern Age Black Death —The Plague 9 10 11 12 A.D. 3000 A.D. 4000 A.D. 5000 1800 1900 1950 1975 2000 2100 Future Billions Source: Population Reference Bureau; and United Nations, World Population Projections to 2100 (1998). World Population Growth Through History
  • 19.
    Billions 0 1 2 3 4 5 6 7 8 9 10 1950 1970 19902010 2030 2050 Less Developed Countries More Developed Countries Source: United Nations, World Population Prospects: The 2002 Revision (medium scenario), 2003. Growth in More, Less Developed Countries
  • 20.
    Share of thePopulation in Agriculture, 1820-1910 0 10 20 30 40 50 60 70 80 90 Great Britain France Germany United States 1820 1850 1870 1910 4
  • 21.
    Major Phases ofDemographic Change ■ Agricultural Revolution • Feudal society. • Wealth from agriculture and land ownership. • Slow demographic growth. ■ Industrial Revolution • Wage labor society. • Wealth from industry and capital ownership. • Fast demographic growth. ■ Post-Industrial Revolution • Information society. • Wealth from technological development. • Slow demographic growth. 4 Agricultural Revolution Industrial Revolution Post-Industrial Revolution 12,000 years 200 years
  • 22.
    Major Phases ofSocioeconomic Change Stone Age Feudalism Industrial Planetary Organization Tribe / Village City-state, Kingdom Nation-state Global governance Economy Hunting and gathering Settled agriculture Industrial system Globalization Communications Language Writing Printing Internet 4
  • 23.
    Fertility ■ 1. Context ■2. Growth Rates ■ 3. Doubling Time A
  • 24.
    Distribution of populationacross regions? http://www.newint.org/issue309/Images/population.gif
  • 25.
    Context ■ Definition • Processduring which the population of an area increases. • Related to a complex economic, cultural and social environment. • Two factors: • (1) Number of births exceeds the number of deaths. • (2) Migration flow is positive. • Expressed in percentages. • Birth rate of 20 per 1000 people. • Death rate of 10 per 1000 people. • Growth rate of 10 people per year per 1000 population, or 1%. 1 Population Growth Society Economy Culture Births minus Deaths Positive migratory balance
  • 26.
    World Population Clock NaturalIncrease per World More Developed Countries Less Developed Countries Less Developed Countries (less China) Year 80,903,481 916,337 79,987,144 71,675,164 Day 221,653 2,511 219,143 196,370 Minute 154 2 152 136 Source: Population Reference Bureau, 2003 World Population Data Sheet.
  • 27.
    Top ten contributorsto world population growth, 1995-2000 15,999,000 11,408,000 4,048,000 2,929,000 2,511,000 2,267,000 2,154,000 2,108,000 1,547,000 0 5,000,000 10,000,000 15,000,000 20,000,000 India China Pakistan Indonesia Nigeria United States Brazil Bangladesh Mexico 1
  • 28.
    Millions Annual Increase inWorld Population 0 10 20 30 40 50 60 70 80 90 100 1951 1956 1961 1966 1971 1976 1981 1986 1991 1996 2001 Source: United Nations, World Population Prospects: The 2002 Revision, 2003.
  • 29.
    Population Structures byAge and Sex, 2005 Millions 300 100 100 300 300 200 100 0 100 200 300 Less Developed Regions More Developed Regions Male Female Male Female 80+ 75-79 70-74 65-69 60-64 55-59 50-54 45-49 40-44 35-39 30-34 25-29 20-24 17-19 10-16 5-9 0-4 Age Source: United Nations, World Population Prospects: The 2002 Revision (medium scenario), 2003. Age Distribution of the World’s Population
  • 30.
  • 31.
    Diverging Trends inFertility Reduction Average number of children per woman 6.7 6.0 6.6 7.0 5.5 6.9 6.3 5.8 8.2 3.5 7.0 5.1 3.3 3.0 2.4 2.3 2.4 4.3 Bangla- desh Egypt India Indo- nesia Iran Nepal Pakistan Turkey Yemen 1950-1955 2000-2005 Source: United Nations, World Population Prospects: The 2002 Revision (medium scenario), 2003.
  • 32.
    Millions Source: United Nations,World Urbanization Prospects: The 2003 Revision (medium scenario), 2004. 1950 2000 2015 Largest Cities, Worldwide 8 11 12 17 18 34 21 23 36 London Tokyo New York Sao Paulo Mexico City Tokyo Dheli Mumbai (Bombay) Tokyo
  • 33.
    Decline or Growth,2002-2025 Percent 3 12 -17 -14 -8 6 Bulgaria (1.1) Russia (1.1) Italy (1.2) Trinidad & Tobago (1.6) South Korea (1.4) China (1.8) Country (average number of children per woman) Source: United Nations, World Population Prospects: The 2002 Revision (medium scenario), 2003. Population in Countries With Low Fertility
  • 34.
    1.10 1.10 1.10 1.00 1.14 1.16 1.15 1.15 1.15 1.14 Czech Republic Armenia Ukraine Spain Russian Federation Slovenia MacaoSpecial Adminstrative Region Bulgaria Latvia Hong Kong Special Administrative Region 10 Places With the Lowest Birth Rates Worldwide Average number of children per woman, 2000-2005 Source: United Nations, World Population Prospects: The 2002 Revision (medium scenario), 2003.
  • 35.
    Trends in PopulationGrowth Worldwide Population Increase and Growth Rate, Five-Year Periods 79 87 82 79 77 75 73 69 0 10 20 30 40 50 60 70 80 90 1980- 1985 1985- 1990 1990- 1995 1995- 2000 2000- 2005 2005- 2010 2010- 2015 2015- 2020 0 0.2 0.4 0.6 0.8 1 1.2 1.4 1.6 1.8 2 Net population added per year Annual population growth rate Millions Percent increase per year Source: United Nations, World Population Prospects: The 2002 Revision (medium scenario), 2003.
  • 36.
    Number of Women15 to 49 Billions 0.62 0.86 1.31 1.75 1.97 2.05 1950 1970 1990 2010 2030 2050 Source: United Nations, World Population Prospects: The 2002 Revision (medium scenario), 2003. Women of Childbearing Age
  • 37.
    Context ■ Reasons forhuge population growth • Achieved “death control” more effectively then birth control. • Modern medicine: • Vastly decreased the number of deaths from many diseases (malaria, yellow fever, etc.). • Famine: • Reduced through better agriculture, distribution, storage and by international aid mechanisms. • Infant mortality: • Decreased in most areas. • Improvement in the availability and quality of the water supply: • Improved hygiene conditions. • Decreased deaths caused by water borne diseases. 1
  • 38.
    Context ■ Birth controlhas been more difficult to achieve • Religious beliefs. • Cultural traditions. • The importance of children as help, labor and security. • The role of women is very limited in many societies. 1
  • 39.
  • 40.
    Growth Rates ■ Highgrowth • 2% and above. • Characteristic of many Third World countries. ■ Average growth • Between 1 and 2%. • Much of Latin America and parts of Asia, including China. ■ Low growth • Between 0 and 1%. • Europe, the United States and Canada are currently in this range. ■ Zero population growth (ZPG) • Less than 0%. • Several European countries. 2 High ZPG Average Low 2.0% 1.0% 0.0%
  • 41.
    Population Growth Rate,2000 Not Available Less than 0% 0% to 0.5% 0.5% to 1.0% 1.0% to 1.5% 1.5% to 2.5% More than 2.5% 2
  • 42.
    Population Change between2000 and 2050 (%) -30 -20 -10 0 10 20 30 Ireland United States France Sweden Britain Poland Netherlands Germany Russia Spain Italy 2
  • 43.
    3 Scenarios ofGlobal Population Growth, 2005-2050 0 2,000 4,000 6,000 8,000 10,000 12,000 1 9 5 0 1 9 6 0 1 9 7 0 1 9 8 0 1 9 9 0 2 0 0 0 2 0 1 0 2 0 2 0 2 0 3 0 2 0 4 0 2 0 5 0 High Low Medium 2
  • 44.
    Population of Russia,Japan Italy, 1950-2050 (in millions) 0 20 40 60 80 100 120 140 160 1950 1960 1970 1980 1990 2000 2010 2020 2030 2040 2050 Russia Japan Italy 2
  • 45.
    Doubling Time ■ Definition •Length of time necessary for an area (usually a nation) to double its population. • The mathematics of population work very much like compounding interest. • Percentage of increase is applied to an ever-increasing base. • Simple equation: 72 / Growth rate. ■ Implications • The faster the growth rate the lower the doubling time: • 1% growth rate: 72 years. • 4% growth rate: 19 years. • Infinite doubling time: no growth or negative growth. 3
  • 46.
    Doubling Time asof 2000 More than 250 years 100 to 250 years 50 to 100 years 25 to 50 years Less than 25 years ZPG NA 3
  • 47.
    Fertility ■ 1. CrudeBirth Rate ■ 2. Total Fertility Rate ■ 3. Factors Influencing Fertility B
  • 48.
    1 Crude BirthRate ■ Crude Birth Rate (CBR) or General Fertility Rate (GFR) • Number of live births per year per 1000 population. • Both males and females are considered. • All the population is considered, even the non-reproductive segment (children, elderly). • Numbers like 10, 20, 40, etc. 25 males of any age 25 females of any age 1,000 10 children born that year 30 CBR = 30
  • 49.
    Total Fertility Rate ■Total Fertility Rate (TFR) • Number of live births per female of reproductive age (15-49). • Numbers such as 2.2, 4.5. • Indicates population change over a long period of time. • Instructive about societal norms in any given culture. • A TFR of 2.1 is considered as being the replacement birth rate. • Lower than 2.1 yields population decrease while rates greater than 2.1 yields population increase. • Improvements in medical conditions lower the replacement rate (below 2.06 in many countries). 2 25 females between 15-49 10 children born that year 1,000 60 TFR = 2.04 = (60/1,000) * (49-15)
  • 50.
    Total Fertility Rate,1994-2000 0 1 2 3 4 5 6 7 8 Yemen Niger Jordan Mexico Brazil US Russia Italy World 1994 2000 2 Replacement rate (2.1)
  • 51.
    Total Fertility Rate,1999 1.14 - 1.50 1.51 - 2.00 2.01 - 2.50 2.51 - 3.00 3.01 - 4.00 4.01 - 7.41 NA 2
  • 52.
  • 53.
    Factors Influencing Fertility ■Biological determinants • Age: • Reproductive age of women ranges from 15-44 or from 15-49. • Men: 13-?? • Health and nutrition: • Poor health and/or nutrition can reduce fertility. • Linked with underweight children. • Linked with child mortality rates. • Environment: • Represents an undocumented impacts on fertility. • Stressed populations tend to have less males than females. • Possible correlation between sperm count and pollution. 3
  • 54.
    Birth Rate perAge Group, United States, 1965, 1999 (per 1,000 women) 0 20 40 60 80 100 120 140 160 180 200 10-14 years 15-19 years 20-24 years 25-29 years 30-34 years 35-39 years 40-44 years 45-54 years 1965 1999 3
  • 55.
    Average Sperm Countof Americans, 1938-98 (per ml) 40 50 60 70 80 90 100 110 120 130 1938 1941 1944 1947 1950 1953 1956 1959 1962 1965 1968 1971 1974 1977 1980 1983 1986 1989 1992 1995 1998 3
  • 56.
    Factors Influencing Fertility ■Social determinants • The social norms and acceptance of practices affecting fertility. • Differ from society to society. • Marriage: • Particularly the average age of marriage. • The percentage of people never married varies spatially and affects fertility rates. • Late marriage age generally involves less children. • Contraception: • Used by 30-50% of all married couples. • Availability of contraceptive devices and social attitudes toward their use affect fertility rates. • Sharp differences exist between DCs and LDCs. • Some notable exceptions, such as China and Cuba. 3
  • 57.
    Factors Influencing Fertility •Abortion: • Last resort measure when contraception failed (or was not used). • Its legality is not universal and under challenge in some countries where it is permitted. • Global figures (1999): – 210 million pregnancies. – 22% of all pregnancies end up in a abortion. – 46.2 million abortions, of which 20 million procedures are obtained illegally. • Illegal abortions are common in most societies where it is prohibited. • Culture plays an important determining role in the impact of abortion. • United States: 49% all pregnancies unwanted and about half of unwanted pregnancies ended in abortion (1.4 million abortions per year). 3
  • 58.
    Pregnancies and Abortionsper Women Aged 15-19 Years, 1998 18 16.4 17.1 17 16.8 18.9 0 20 40 60 80 100 120 Russia United States England Canada France Japan Age at first intercourse Abortion rate (per 100) Pregnancy rate (per 1000) 3
  • 59.
    Factors Influencing Fertility ■Economic determinants • The role of children, or their “value” affects fertility. • Inverse relationships: • Fertility and income per capita. • Fertility and urbanization. • Traditional rural societies: • Children still play an important economic role and contribute to family wealth. • Fertility is likely to remain higher. • Industrial and post-industrial societies: • Costs tend to increase with the development level of the society. • Deflate the fertility rate since parents must consider the direct and opportunity costs of bearing additional children. 3
  • 60.
    Factors Influencing Fertility •Direct costs lost: • For the support of children. • Food, clothing, housing, education, etc. • Opportunity costs lost: • Lower standard of living. • Reduce the ability to save and invest. • Labor force participation of women is affected by child-bearing. 3
  • 61.
    Mortality ■ 1. CrudeDeath Rate ■ 2. Infant Mortality Rate ■ 3. Life Expectancy ■ 4. Epidemiological Transition C
  • 62.
    1 Crude DeathRate ■ Death rate • Easiest of the variables to consider. • Occurs just once per person and is the most recorded. ■ Crude Death Rate (CDR) • Annual number of deaths per 1000 population (all ages included). 25 males of any age 25 females of any age 1,000 10 people who died that year 30 CDR = 30
  • 63.
    Crude Death Rate ■Causes of death • Throughout most of history famine, epidemics, and wars have been the leading causes of death. • Primary causes of death began to shift to degenerative problems related to aging. • These include such factors as heart disease and cancer. ■ Death and welfare • Used to be considered a sign of the health of a population. • Different age structures among the populations of different countries. • Possible for a nation with high living standards to have a higher death rate than a poorer nation. • Reason: overall older population. 1
  • 64.
    Crude Death Rate,2000 Less than 5.00 5.01 - 8.00 8.01 - 10.00 10.01 - 12.00 12.01 - 15.00 More than 15.00 NA 1
  • 65.
    Fertility and Mortalityin the United States, 1950- 2000 (in 1000s) 0 500 1,000 1,500 2,000 2,500 3,000 3,500 4,000 4,500 Births Deaths 1
  • 66.
    Infant Mortality Rate ■Definition • Expressed in numbers of deaths of infants under one year per 1000 live births of the same year. • Also considers the death of children under 5 per 1000 in their cohort. • High levels of infant mortality pull down life expectancy rates. • Reflects the quality of the health system. • Very strong differences between developed and developing countries. 2
  • 67.
    Infant Mortality Rate,2000 Less than 6.00 6.01 - 10.00 10.01 - 20.00 20.01 - 50.00 50.01 - 100.00 More than 100.00 NA 2
  • 68.
    Causes of Deathfor Children under 5 in Developing Countries 28% 25% 16% 5% 3% 17% 1% 5% Diarrheal diseases Immunizable diseases Acute respiratory infections Malaria Other infectious/ parasitic diseases Perinatal causes Injuries Other causes 2
  • 69.
    Life Expectancy ■ Definition •Number of years a person is expected to live. • Based on current death rates. • May change due to ameliorations in standards of living. ■ Context • Strong geographical variations in life expectancy. • Half a century ago, most people died before the age of 50. • Global average life expectancy reached 65 years in 2000. • Several achievements and failures: • Economic development has benefited human health. • Improvement in diet and sanitation. • Urbanization may have adverse effects. 3
  • 70.
    Life Expectancy atBirth, 1910 and 1998 30 40 50 60 70 80 90 England Italy Japan Sweden United States 1998 Females 1998 Males 1910 Females 1910 Males 3
  • 71.
    World Average LifeExpectancy and Life Expectancy in Industrial and Developing Nations, 1950-2000 30 35 40 45 50 55 60 65 70 75 80 1950-55 1955-60 1960-65 1965-70 1970-75 1975-80 1980-85 1985-90 1990-95 1995-00 World Developing Developed 3
  • 72.
    % of Menand Women Expected to Survive to Age 80, by Region (Among people born 1995-2000) 13 25 30 30 41 17 37 53 44 61 0 10 20 30 40 50 60 70 Africa Asia Europe Latin America North America Female Male 3
  • 73.
    Yearly Cost ofa $1,000,000 Life Insurance Premium, 2001 0 500 1000 1500 2000 2500 3000 35 40 45 50 55 60 65 70 Male Female 3
  • 74.
    Life Expectancy ■ Optimumlife expectancy • Life expectancy is ultimately dictated by human physiology: • At some points, organs cease to function properly. • Limit on the lifespan of non-cancerous human cells. • Nearing life expectancy limits: • Even if age-related diseases such cancer, heart disease, and stroke were eradicated, life expectancy would only increase by 15 years. • Currently around 76 years. • Expected to reach 85 years in most developed countries by 2030. 3
  • 75.
    Epidemiological Transition ■ Definition •Focuses on changes over time in the causes of mortality affecting certain populations: • Health conditions. • Disease patterns. • Result in a decline in death rates and an increase of life expectancy. • The society goes through a transition from communicative diseases to degenerative diseases. 4
  • 76.
    Epidemiological Transition ■ Stages •Three identifiable stages in the transition. • 1) Age of communicative diseases. • 2) Age of receding pandemics. • 3) Age of degenerative and man- made diseases. Communicative Diseases Receding Pandemics Degenerative and Man-made Diseases 4 70 years 50 years 30 years High Fertility High Mortality High Fertility Decreasing Mortality Low Fertility Low Mortality
  • 77.
    Population Profiles ■ 1.Population Pyramid ■ 2. Dependency Ratio ■ 3. Sex Structure D
  • 78.
    1 Population Pyramid ■Definition • Graph showing the breakdown of each sex by age group (cohort). • Illustrates a nation’s population structure. • Shows the male/female composition of the population. • Most of the time, the breakdown involves 5 years periods. 0-15 15-30 30-45 45-60 60-75 75+ Females Males 0 10 10 Percentage of the population Age group
  • 79.
    Population Pyramid ofMexico, 2000 -6 -4 -2 0 2 4 6 0-4 10-14 20-24 30-34 40-44 50-54 60-64 70-74 80-84 Millions Female Male 1
  • 80.
    Population Pyramid ofSweden, 2000 -350 -250 -150 -50 50 150 250 350 0-4 10-14 20-24 30-34 40-44 50-54 60-64 70-74 80-84 Thousands Female Male 1
  • 81.
    Population Pyramid ■ Mexicanpyramid • Much wider base than the others. • Beginning of transition. • Rapidly growing population where the percentage of people under 15 years of age is high. ■ Sweden’s pyramid • Does not appear to be a pyramid at all. • Youngest component is smaller than its middle-aged population and only slightly larger than its aged population. • No-growth situation, since some deaths occur from all age groupings. • Sweden has a higher death rate than Mexico. 1
  • 82.
    Population Pyramid ofthe United States, 2000 -12 -10 -8 -6 -4 -2 0 2 4 6 8 10 12 0-4 10-14 20-24 30-34 40-44 50-54 60-64 70-74 80-84 Millions Female Male 1
  • 83.
    Population Pyramid ■ USApyramid • Lies in between the two situations mentioned above. • Would be more like the Swedish pyramid were it not for large amounts of immigration. • Bulge in the 30-54 year old component: • The baby boom generation. • Small numbers in the 55-65 year old component: • Low birth rates during the 1930s and during WW II. • Dip in 20-29 segment of the population: • Low birth rates during the 1970s and early 1980s. • Limited immigration. • Preponderance of women at the top of the pyramid, an indication of their longer average life span. 1
  • 84.
    Population Pyramid, Berlin1946 -5 -4 -3 -2 -1 0 1 2 3 4 5 0-4 10-14 20-24 30-34 40-44 50-54 60-64 70-74 80-84 Percentage of the population Female Male 1
  • 85.
    Population Pyramid ■ Germanpyramid • Shows the most extreme example of population decline. • Vast difference between males and females in the upper age groups. • Vast number of military casualties among the population which fought the 2nd World War. 1
  • 86.
    Dependency Ratio ■ Definition •Comparison between the productive and non-productive population. • Often expressed in non-productive per 100 productive. • Non-productive population: • Refers to the very old (usually >65 years of age) and the very young (usually <15). • Considered to be the “non-productive” segments of society because they are not part of the labor force. • Productive years: • Between 15 and 65. • This portion of the population constitutes the labor force. • Revised to consider lower than 20 years in developed countries (increasing time spent for education). 2
  • 87.
    Dependency Ratio ■ Implications •Society incurs costs in supporting its dependent population. • Old age generates social costs: • Retirement benefits. • Increased medical expenditures. • Greater consumption of other social services. • Youths: • Not yet in the work force. • Some medical costs. • Great expenditures for education. • National budgets often reflect these expenditures. • Linked with the population pyramid: • Pyramidal distributions have high dependency ratios. • “Rectangular” distributions have high dependency ratios. • Transitional pyramids have low dependency ratios. 2
  • 88.
    Dependency Ratio ofsome Countries, 1990-1999 (per 100) 20 30 40 50 60 70 80 90 100 110 USA Mexico Germany Sweden Kenya India China 1999 1990 2
  • 89.
    Dependency Ratio ■ Aging •Major shift in health issues. • 1995: 380 million people aged 65 years and above. • 2020: over-65 population is projected to increase globally by 82%, to more than 690 million. • For every baby born today in an industrialized country, there are 10 people aged 65 or over. • By the year 2020 there will be 15 such elderly persons for each newborn. • In developing countries, the ratio today is 2 people over 65 for every newborn, and 4 for every newborn by 2020. 2
  • 90.
    Population 60 andOver, Industrial and Developing Countries, 1950-95, With Projections to 2050 0 200 400 600 800 1000 1200 1400 1600 1 9 5 0 1 9 5 5 1 9 6 0 1 9 6 5 1 9 7 0 1 9 7 5 1 9 8 0 1 9 8 5 1 9 9 0 1 9 9 5 2 0 0 0 2 0 0 5 2 0 1 0 2 0 1 5 2 0 2 0 2 0 2 5 2 0 3 0 2 0 4 0 2 0 5 0 Developing countries Developed countries 2
  • 91.
    Percentage of thePopulation between 15 and 65, 2000 Less than 50.00 50.01 - 55.00 55.01 - 58.00 58.01 - 60.00 60.01 - 65.00 More than 65.00 NA 2
  • 92.
    Dependency Ratio ■ Impacts •Social security costs. • Medical costs and the medical industry at large. • Public sector funds such as the federal budget. • Goods and services used by the elderly experience increasing demand levels. • Those used by the young and/or middle aged will decline in relative importance. • Local impacts (school districts). 2
  • 93.
    Sex Structure ■ Definition •Gender composition of a population. • Males / Females * 100. • Probability: • Approximately equal probability of male and female births. • Normally expect sex ratios to remain very close to 100. • This is often not the case. ■ Factors • Life expectancy at birth is greater for females (79 years) than for males (72). • Gap has increased steadily since 1920, when the difference was just one year. 3
  • 94.
    Sex Ratio (malesper 100 females), 2000 Less than 90 90 - 95 95 - 100 100 - 105 105 - 110 More than 110 NA 3
  • 95.
    Sex Ratio inthe United States, 1820-2000 (males per 100 females) 90 92 94 96 98 100 102 104 106 108 1 8 2 0 1 8 3 0 1 8 4 0 1 8 5 0 1 8 6 0 1 8 7 0 1 8 8 0 1 8 9 0 1 9 0 0 1 9 1 0 1 9 2 0 1 9 3 0 1 9 4 0 1 9 5 0 1 9 6 0 1 9 7 0 1 9 8 0 1 9 9 0 2 0 0 0 3 Civil War Immigration Boom WWII WWI Life expectancy gap Immigration Boom
  • 96.
    Population Capacity ■ 1.Population Density ■ 2. Population Distribution ■ 3. Population Capacity E
  • 97.
    Population Density ■ Arithmeticdensity • Relates the size of a population (P) to the area which contains it (A). • Number of people per square mile or square kilometer. • Without regard to the productive quality of the area. • Distributional imbalances. ■ Physiological density • Number of people per unit of productive land. • Productive is generally equated with arable land (AL). • Important figure to measure sustainability. 1 AD = P / A PD = P / AL Arable land
  • 98.
    Density Measures forSelected Countries, 1995 (in people per square mile) 0 1000 2000 3000 4000 5000 6000 7000 Argentina Australia Bangladesh Canada China Egypt India Iran Japan Nigeria UK USA Physiological density Arithmetic density 1
  • 99.
    2 Population Distribution ■Definition • Considers the distribution of population densities over the earth’s surface. • Informative in assessing a nation’s population. • Typical concentrations along major river systems. • Areas of great concentration: • South Asia. • East Asia. • Western Europe. • Northeastern North America. • “Empty” areas are attributed to: • Harsh physical landscapes. • Harsh temperature.
  • 101.
    World Population Densityand Distribution, 1995 2
  • 102.
    Population Capacity ■ Howmany people can be sustained by the Earth? • Based on human choices and natural constraints. • Maximum density. • Quantity of arable land. • Agricultural technology. • Harvesting the ocean. • Human facilities. • Availability of resources (energy, construction materials, etc.). 3 Space Resources Technology Consumption
  • 103.
    3 Population Capacity ■Demographic capacity • Studies about nature’s capacity to support human life go back many centuries. • Leeuwenhoek (1679) extrapolated densities for Holland to the whole planet (13.4 billion capacity). • Focus: • Space. • Energy requirements. • Non-renewable resources. • Photosynthetic potentials. • All are based on the same principle: • Tracing resource and energy flows through the human economy.
  • 104.
    Population Capacity ■ Ravensteinin 1891 • Concept of carrying capacity. • Focused on the earth’s cultivable areas, and their potential productivity given increases in yields over time: • Fertile: 200 people / km2. • Steppe: 10 people / km2. • Desert: 1 person / km2. • Figure of 6 billion people as the number Earth could sustain without lowering living standards. • Reached this number in 1999. 3 Arable land Agricultural technology Consumption per capita X /
  • 105.
    Population Capacity ■ Contemporaryissues • Events such as the Green Revolution were not foreseen by Ravenstein. • Managed to increase agricultural yields in many areas by quantities far greater than he had anticipated. • Efforts to calculate carrying capacity have largely failed. • Too many variables. • Value ranges between 4 and 16 billion. 3
  • 106.
    Population Capacity 0 2 4 6 8 10 12 Americans Indians Billions ■Level of consumption • Alternative perspective. • The issue is not resource supply, but resource demand. • The world is producing only a finite number of resources for consumption. • Demographic capacity is linked with level of resource consumption. ■ American (lifetime) • 1 million kg of atmospheric waste. • 10 million kg of liquid waste. • 1 million kg of solid waste. • 700,000 kg of minerals. • 24 billion BTU of energy. • 25,000 kg of plants. • 2,000 animals (28,000 kg). 3

Editor's Notes

  • #6 Source: J. Diamond (1999) Guns, Germs, and Steel, p. 37.
  • #9 Source: United Nations, State of the World Population, 2001.
  • #22 Source: Raskin, P. et al (2002) Great Transition: The Promise and Lure of the Times Ahead, Boston: Stockholm Environment Institute, p. 3. http://www.tellus.org/seib/publications/Great_Transitions.pdf
  • #27 10 countries contributed to 59.8% of the annual growth of 77.7 millions between 1995 and 2000. Source: United Nations Population Division, World Population Prospects: The 1998 Revision, forthcoming
  • #29 Sex and age distributions show that less developed countries have significantly younger populations than more developed countries. Roughly one-third of the population in less developed countries is under age 15. In many sub-Saharan African countries, this proportion rises to nearly one-half of the population. In contrast, less than one-fifth of the population in more developed countries is under 15. Today there are more than 2 billion young people below age 20 in less developed regions—the age cohort that will soon become the world’s newest group of parents. Young age structures in the less developed countries are due mainly to higher levels of childbearing in recent decades.
  • #32 The largest cities in the world are growing rapidly in size and they are shifting from the more developed regions to the less developed regions. In 1960 the three largest cities were in more developed countries; by 2000, only Tokyo remained in the top three. In 1960, New York was the largest city in the world, with a population of about 14 million. By 2015, the largest city worldwide is projected to be Tokyo, with nearly double this population size: 27 million.
  • #33 All countries shown here have below “replacement level” childbearing —the level required for population to ultimately stop growing or declining. Yet, half will continue to grow and half are projected to decline by 2025. Although women in both Russia and Bulgaria have on average 1.1 children each (among the lowest rates in the world), Russia, with a slightly younger population, will lose a smaller proportion of its population (14 percent, compared with 17 percent for Bulgaria) between 2002 and 2025. Still, Russia, having a much bigger population, is projected to lose nearly 20 million people, whereas Bulgaria will probably shrink by just 1.5 million.
  • #35 This figure illustrates the lag between changes in the rate of growth and the net increase in population per year. Over the period 1985-1995, the population growth rate declined (a reflection of declining fertility), yet millions of people were added to the world’s population (which peaked around 1985, when 87 million people were added each year). From 2000 on, the growth rate will continue to decline. Between 2015 and 2020, we will still be adding 69 million people each year. Why? Because the generation of women now having their children is very large as the result of high fertility in their mothers’ and grandmothers’ generations.
  • #36 The number of women of childbearing ages 15 to 49 more than doubled between 1950 and 1990: from 620 million to over 1.3 billion. Their numbers are expected to reach over 2 billion by the middle of this century, according to the UN’s medium projections. The growing population of women in their childbearing years and their male partners will contribute to future world population growth, even if levels of childbearing continue to decline.
  • #43 Source: United Nations, World Population Prospects: The 2000 Revision (New York: February 2001)
  • #44 Source: United Nations Population Division
  • #50 Source: UNFPA, 2000.
  • #54 Source: Center for Disease Control. http://www.cdc.gov/nchs/datawh/statab/unpubd/natality/natab99.htm
  • #55 “Another sign of deteriorating human health is a fall in sperm counts. Among men in the United States, average sperm counts per milliliter of semen have dropped from 120 million in 1940 to just under 50 million in 1998. Counts in the European countries indicate a similar decline. The principal explanation for this is the so-called endocrine disruption hypothesis, namely that chemicals in the environment act as "environmental estrogens." These imitators of this basic female hormone-found in plastics, pesticides, and industrial pollutants-may adversely affect male reproductive functioning, among other things.” Quoted from a Saturday, May 29, 1999 press release. Source: Worldwatch Institute.
  • #58 Source: Durex Global Survey. Source: The Alan Guttmacher Institute. Nearly 1.4 million abortions in a year, with nearly half of all pregnancies unwanted.
  • #65 Source: Center for Disease Control, 2000.
  • #68 About 80% of the deaths are from diseases that could have been treated.
  • #71 Source: Worldwatch Institute.
  • #72 Source: United Nations Population Division, 2000
  • #73 Source: TIAA-CREF.
  • #79 Source: US Census Bureau, International Database
  • #80 Source: US Census Bureau, International Database
  • #82 Source: US Census Bureau, International Database
  • #88 Source: WHO, 2000.
  • #90 Source: Worldwatch Institute.
  • #95 Source: US census bureau
  • #98 Source: Fellman, Getis, & Getis 1999.