
Downloaded 41 times
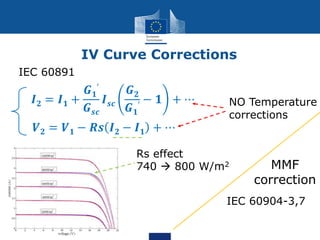
![𝑼 =
𝒈,𝒌
𝑷 𝒈, 𝒌 ∆𝒕 𝒈, 𝒌
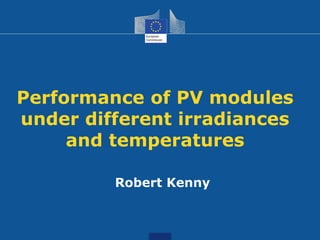
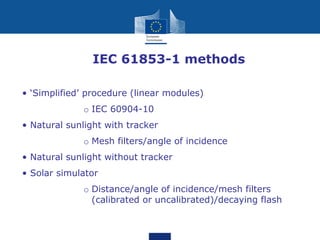
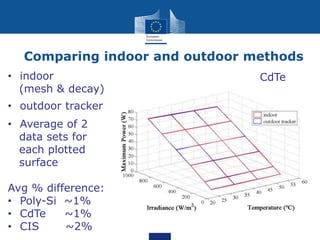
Energy Rating requires Power
Rating at different conditions
• STC measurement:
• 25°C
• 1000W/m2
• AM1.5G
𝐔 = 𝑷 𝒕 𝒅𝒕
= 𝑷 𝑮 𝒕 , 𝑻 𝒕 , . . . 𝒅𝒕
Where:
g=[100,200,400,600,800,1000,1100]W/m2
k=[15,25,50,75]°C
POWER RATING
IEC 61853-1](https://image.slidesharecdn.com/23presentationkennysupsimar17-170404211730/85/23-presentation-kenny-supsi-mar17-3-320.jpg)
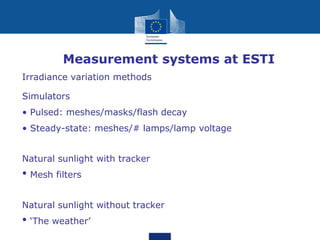
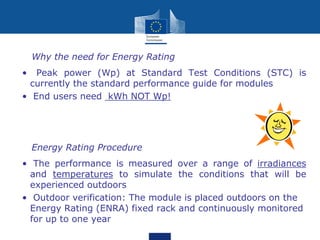
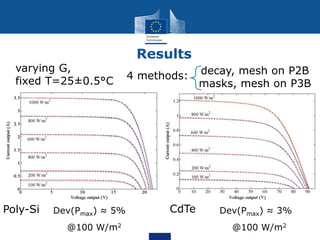
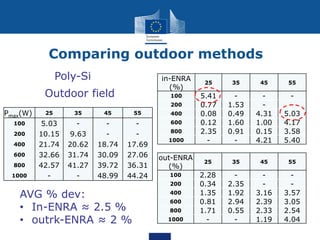
![IEC 61853-1 Indoor method
g=[100,200,400,600,800,1000]W/m2
k=[25,35,45,55,65]°C
<<Procedure with solar simulator>>
decay masks
P3B
heated box
P2B
varying G
varying T none
Time (ms)
Irradiance
P2B LAPSS pulse
characteristic
200](https://image.slidesharecdn.com/23presentationkennysupsimar17-170404211730/85/23-presentation-kenny-supsi-mar17-8-320.jpg)
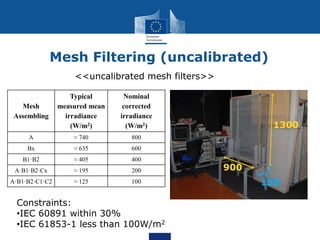
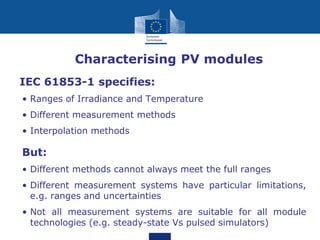
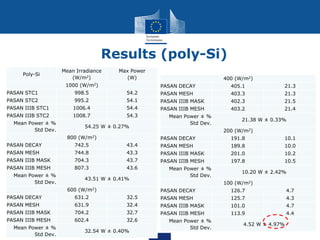
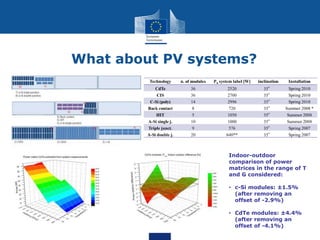
![Outdoor with tracker
g=[100,200,400,600,800,1000]W/m2
k=[25,35,45,55]°C
<<under natural sunlight with tracker>>
Temperature:
•Heated up by sun
•Cooled down with water
•Fine control using an
opaque lid
Irradiance:
•Mesh Filters
Mesh filters
D.U.T.
Aluminum
structure
RefCell
Wooden
box](https://image.slidesharecdn.com/23presentationkennysupsimar17-170404211730/85/23-presentation-kenny-supsi-mar17-10-320.jpg)
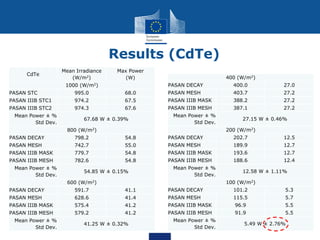

![• References
• [1] Robert P. Kenny, Davide Viganó, Elena Salis, Matthew Norton,
Harald Müllejans, Willem Zaaiman, ‘Power rating of photovoltaic
modules including validation of procedures to implement IEC 61853-1
on solar simulators and under natural sunlight’, Prog. Photovolt: Res.
Appl. 2013; 21:1384–1399
• [2] Adrián A. Santamaría Lancia, Giorgio Bardizza, Harald Müllejans,
‘Assessment of uncalibrated light attenuation filters constructed from
industrial woven wire meshes for use in photovoltaic research’,
presented at EUPVSEC conference](https://image.slidesharecdn.com/23presentationkennysupsimar17-170404211730/85/23-presentation-kenny-supsi-mar17-25-320.jpg)
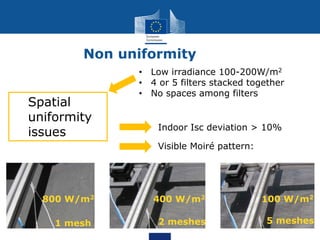
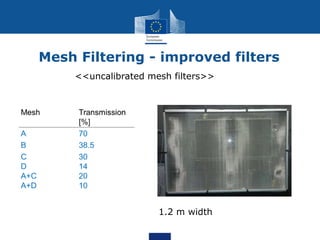
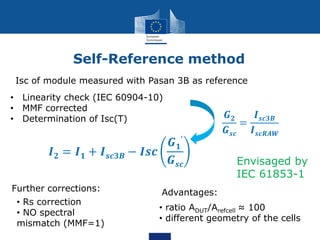
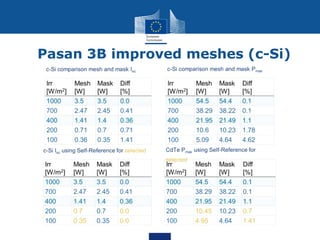
The document discusses methods for characterizing PV module performance under different light intensities (irradiances) and temperatures according to IEC 61853-1 standards. It describes indoor testing methods using solar simulators with mesh filters or masks to vary irradiance levels, as well as outdoor methods using a tracker with mesh filters or fixed installation. Results showed agreement within 3% between indoor and outdoor measurements and less than 5% deviation for fixed outdoor installation. Mesh filtering techniques showed promise but have limitations at low irradiances.


