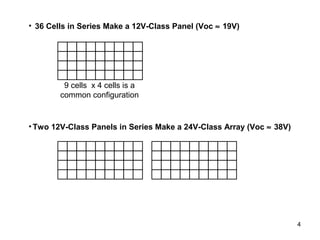
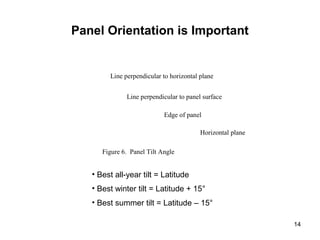
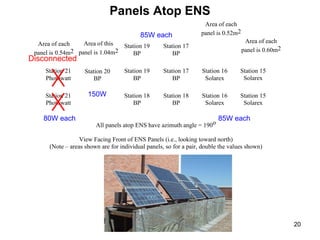
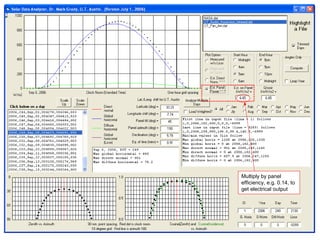
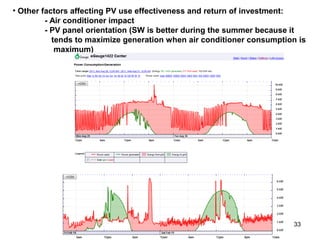
1. The document discusses photovoltaic (solar) panels, including their electrical properties, I-V curves, how multiple cells are connected in series or parallel arrays, and factors that affect panel output like orientation, tilt angle, and solar insolation.
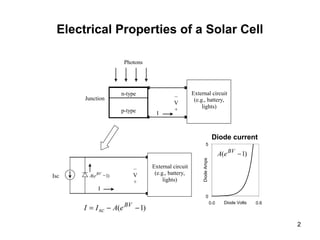
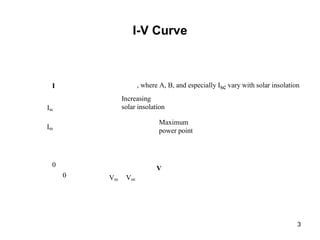
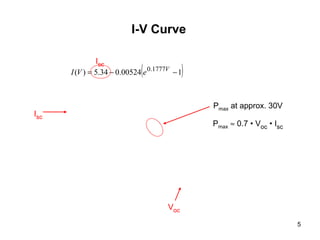
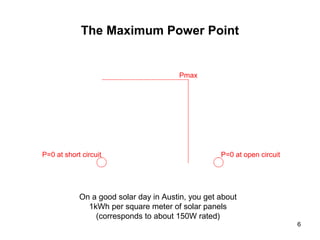
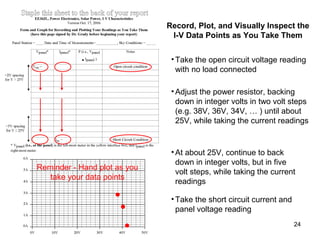
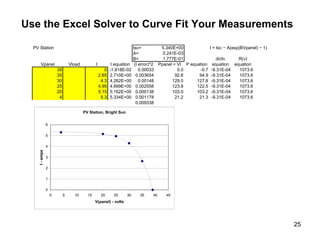
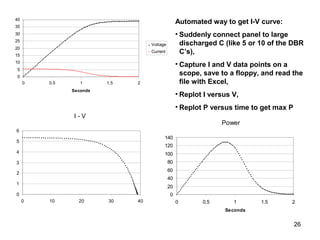
2. Key specifications of solar panels like open circuit voltage (Voc) and short circuit current (Isc) are defined, and equations are provided to calculate the maximum power point based on the I-V curve.
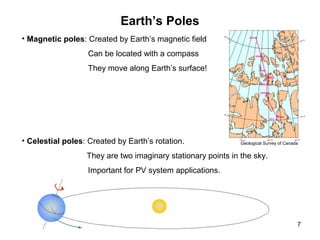
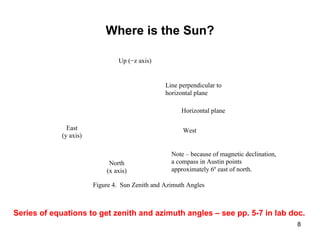
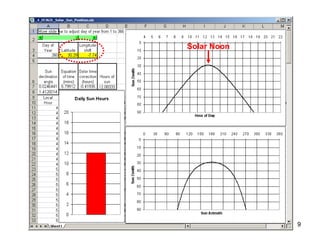
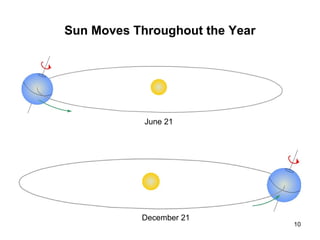
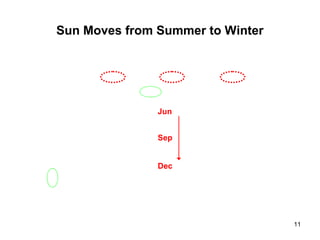
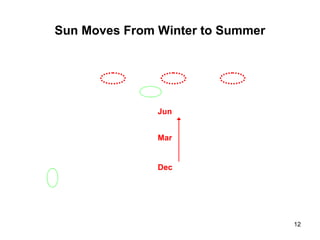
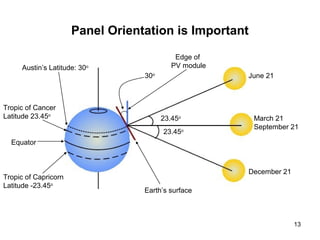
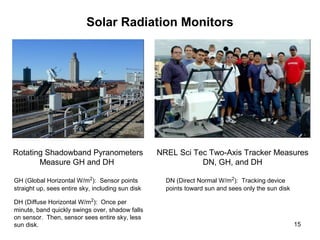
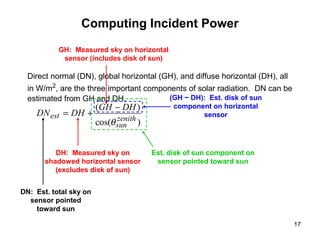
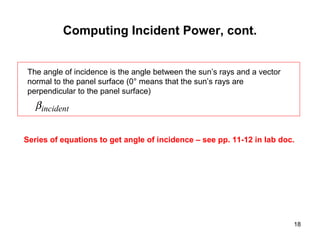
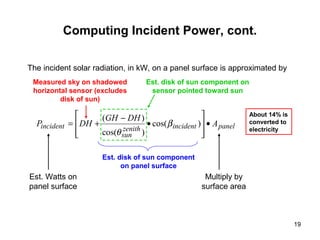
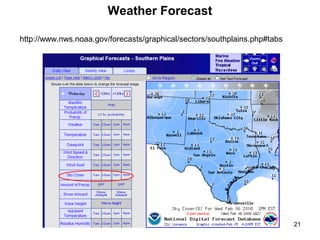
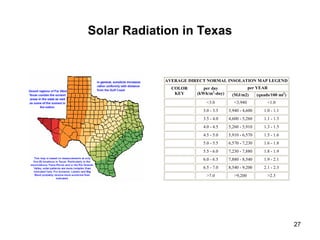
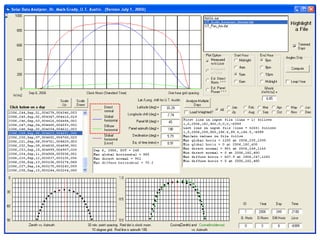
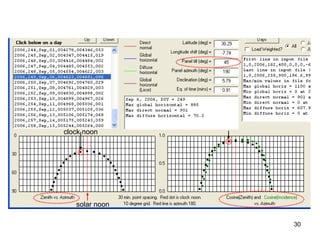
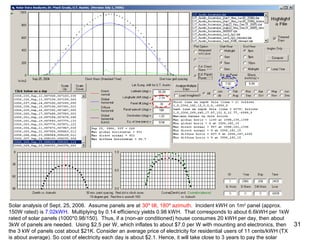
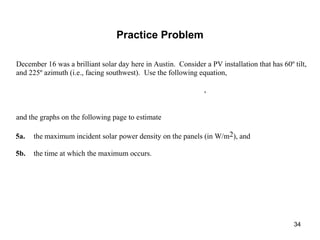
3. Important variables for solar energy production are discussed, including direct normal irradiance, global horizontal irradiance, diffuse horizontal irradiance, zenith angle, and angle of incidence on the panel surface.