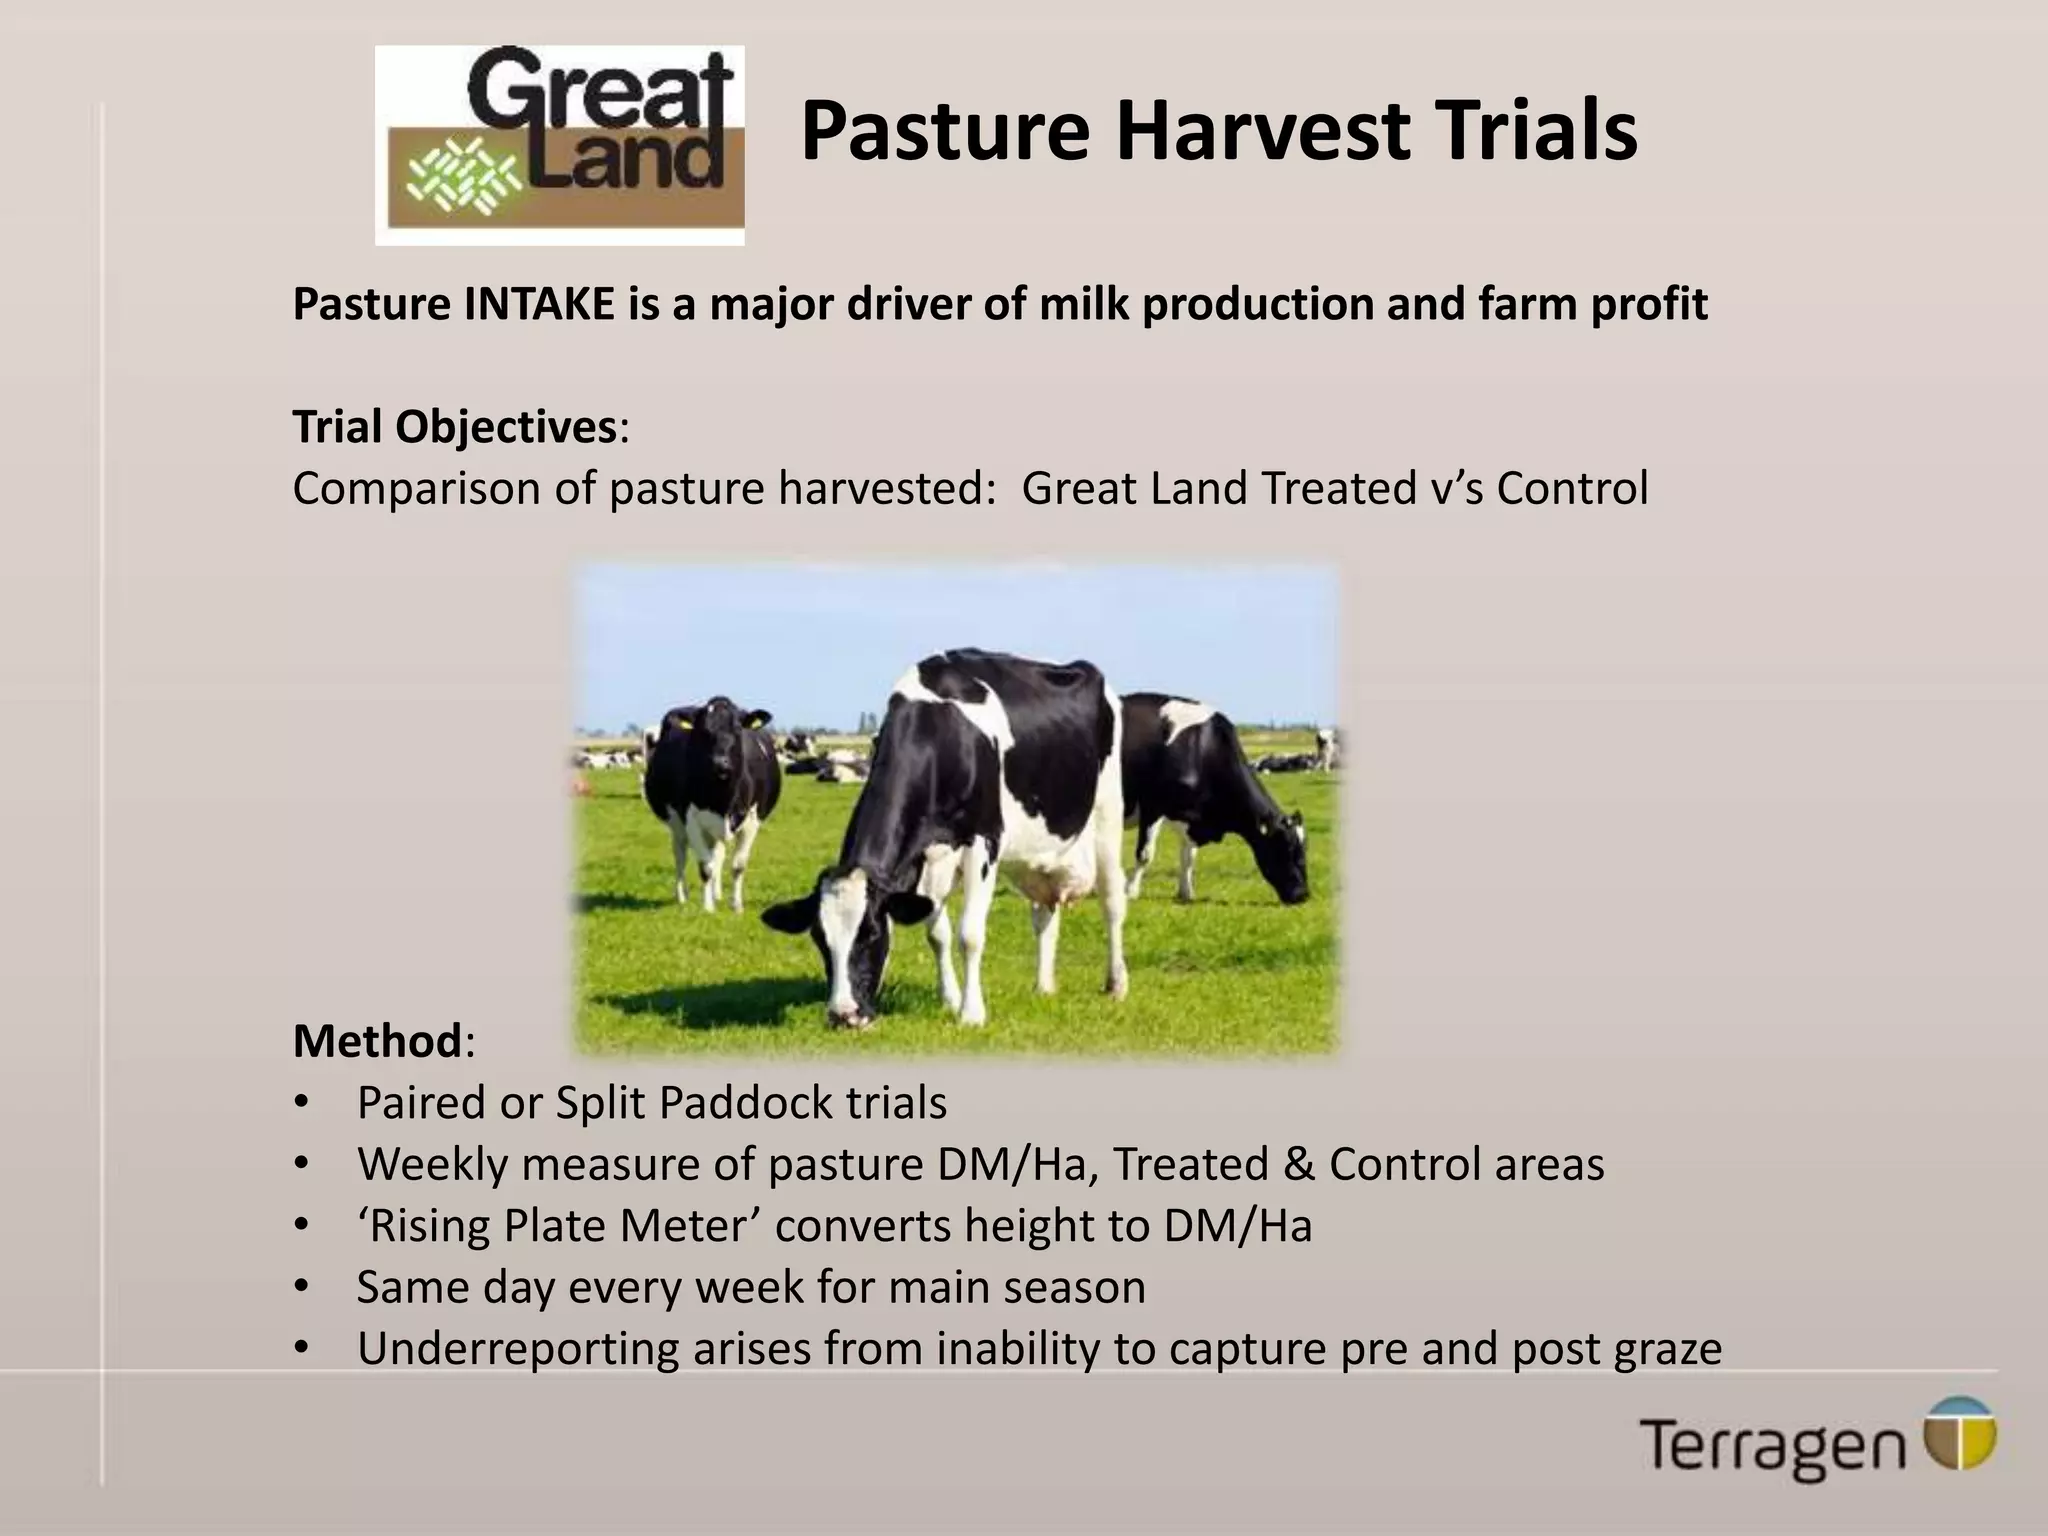
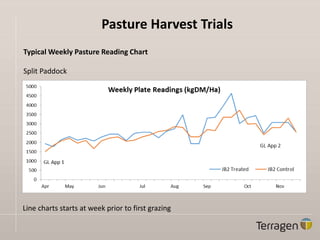
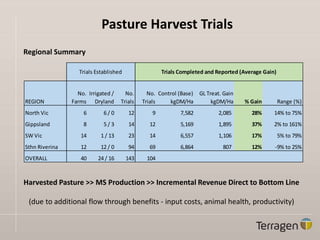
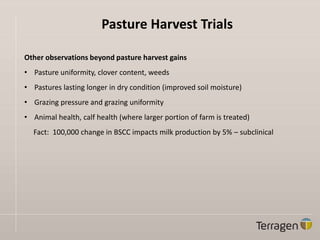
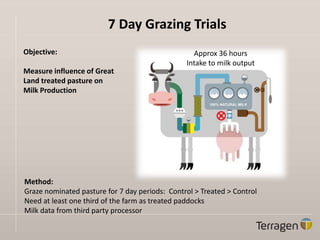
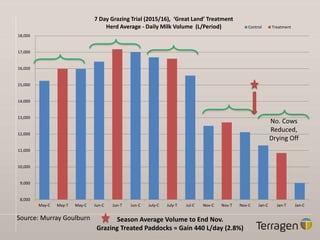
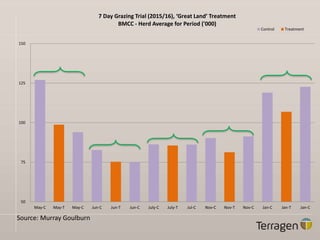
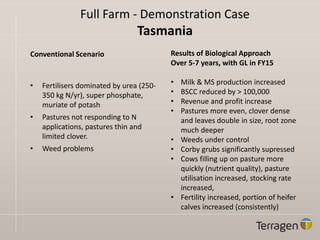
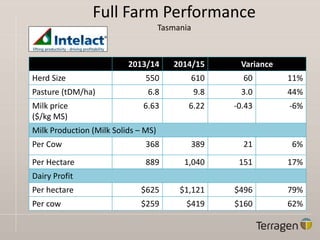
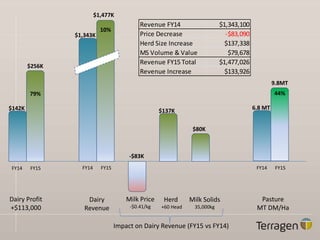
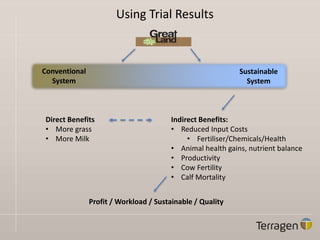
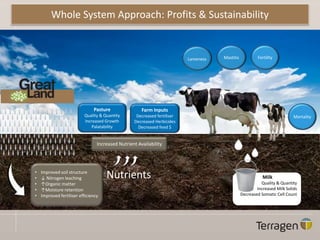
Pasture Harvest Trials
Pasture INTAKE is a major driver of milk production and farm profit
Trial Objectives:
Comparison of pasture harvested: Great Land Treated v’s Control
Method:
• Paired or Split Paddock trials
• Weekly measure of pasture DM/Ha, Treated & Control areas
• ‘Rising Plate Meter’ converts height to DM/Ha
• Same day every week for main season
• Underreporting arises from inability to capture pre and post graze
2015 Dairy Trial Farm Locations
Western Victoria
Gippsland
Southern Riverina
Northern Victoria
Pasture Harvest Trials
Typical Weekly Pasture Reading Chart
Split Paddock
Line charts starts at week prior to first grazing
Pasture Harvest Trials
Regional Summary
Harvested Pasture >> MS Production >> Incremental Revenue Direct to Bottom Line
(due to additional flow through benefits - input costs, animal health, productivity)
REGION
No.
Farms
Irrigated /
Dryland
No.
Trials
No.
Trials
Control (Base)
kgDM/Ha
GL Treat. Gain
kgDM/Ha % Gain Range (%)
North Vic 6 6 / 0 12 9 7,582 2,085 28% 14% to 75%
Gippsland 8 5 / 3 14 12 5,169 1,895 37% 2% to 161%
SW Vic 14 1 / 13 23 14 6,557 1,106 17% 5% to 79%
Sthn Riverina 12 12 / 0 94 69 6,864 807 12% -9% to 25%
OVERALL 40 24 / 16 143 104
Trials Completed and Reported (Average Gain)Trials Established
Pasture Harvest Trials
Other observations beyond pasture harvest gains
• Pasture uniformity, clover content, weeds
• Pastures lasting longer in dry condition (improved soil moisture)
• Grazing pressure and grazing uniformity
• Animal health, calf health (where larger portion of farm is treated)
Fact: 100,000 change in BSCC impacts milk production by 5% – subclinical
7 Day Grazing Trials
Objective:
Measure influence of Great
Land treated pasture on
Milk Production
Method:
Graze nominated pasture for 7 day periods: Control > Treated > Control
Need at least one third of the farm as treated paddocks
Milk data from third party processor
Approx 36 hours
Intake to milk output
8,000
9,000
10,000
11,000
12,000
13,000
14,000
15,000
16,000
17,000
18,000
May-C May-T May-C Jun-C Jun-T Jun-C July-C July-T Jul-C Nov-C Nov-T Nov-C Jan-C Jan-T Jan-C
7 Day Grazing Trial (2015/16), ‘Great Land’ Treatment
Herd Average - Daily Milk Volume (L/Period) Control Treatment
Season Average Volume to End Nov.
Grazing Treated Paddocks = Gain 440 L/day (2.8%)
No. Cows
Reduced,
Drying Off
Source: Murray Goulburn
50
75
100
125
150
May-C May-T May-C Jun-C Jun-T Jun-C July-C July-T Jul-C Nov-C Nov-T Nov-C Jan-C Jan-T Jan-C
7 Day Grazing Trial (2015/16), ‘Great Land’ Treatment
BMCC - Herd Average for Period ('000)
Control Treatment
Source: Murray Goulburn
Full Farm - Demonstration Case
Tasmania
Conventional Scenario
• Fertilisers dominated by urea (250-
350 kg N/yr), super phosphate,
muriate of potash
• Pastures not responding to N
applications, pastures thin and
limited clover.
• Weed problems
Results of Biological Approach
Over 5-7 years, with GL in FY15
• Milk & MS production increased
• BSCC reduced by > 100,000
• Revenue and profit increase
• Pastures more even, clover dense
and leaves double in size, root zone
much deeper
• Weeds under control
• Corby grubs significantly supressed
• Cows filling up on pasture more
quickly (nutrient quality), pasture
utilisation increased, stocking rate
increased,
• Fertility increased, portion of heifer
calves increased (consistently)
Full Farm Performance
Tasmania
2013/14 2014/15 Variance
Herd Size 550 610 60 11%
Pasture (tDM/ha) 6.8 9.8 3.0 44%
Milk price
($/kg MS)
6.63 6.22 -0.43 -6%
Milk Production (Milk Solids – MS)
Per Cow 368 389 21 6%
Per Hectare 889 1,040 151 17%
Dairy Profit
Per hectare $625 $1,121 $496 79%
Per cow $259 $419 $160 62%
Pasture
MT DM/Ha
Dairy Profit
+$113,000
Dairy
Revenue
Herd
+60 Head
Milk Solids
35,000kg
$142K
$256K
79%
Milk Price
-$0.41/kg
$1,343K
$1,477K
10%
$137K
Impact on Dairy Revenue (FY15 vs FY14)
-$83K
$80K
6.8 MT
9.8MT
44%
Revenue FY14 $1,343,100
Price Decrease -$83,090
Herd Size Increase $137,338
MS Volume & Value $79,678
Revenue FY15 Total $1,477,026
Revenue Increase $133,926
FY14 FY15 FY14 FY15 FY14 FY15
Using Trial Results
Profit / Workload / Sustainable / Quality
Conventional
System
Sustainable
System
Indirect Benefits:
• Reduced Input Costs
• Fertiliser/Chemicals/Health
• Animal health gains, nutrient balance
• Productivity
• Cow Fertility
• Calf Mortality
Direct Benefits
• More grass
• More Milk
Nutrients
Pasture
Quality & Quantity
Increased Growth
Palatability
Mastitis
Mortality
Fertility
Milk
Quality & Quantity
Increased Milk Solids
Decreased Somatic Cell Count
Farm Inputs
Decreased fertiliser
Decreased Herbicides
Decreased feed $
Increased Nutrient Availability
• Improved soil structure
• ↓ Nitrogen leaching
• ↑Organic matter
• ↑Moisture retention
• Improved fertiliser efficiency
Lameness
Whole System Approach: Profits & Sustainability

2202 GL Trials Summary

  • 1.
    Pasture Harvest Trials PastureINTAKE is a major driver of milk production and farm profit Trial Objectives: Comparison of pasture harvested: Great Land Treated v’s Control Method: • Paired or Split Paddock trials • Weekly measure of pasture DM/Ha, Treated & Control areas • ‘Rising Plate Meter’ converts height to DM/Ha • Same day every week for main season • Underreporting arises from inability to capture pre and post graze
  • 2.
    2015 Dairy TrialFarm Locations Western Victoria Gippsland Southern Riverina Northern Victoria
  • 3.
    Pasture Harvest Trials TypicalWeekly Pasture Reading Chart Split Paddock Line charts starts at week prior to first grazing
  • 4.
    Pasture Harvest Trials RegionalSummary Harvested Pasture >> MS Production >> Incremental Revenue Direct to Bottom Line (due to additional flow through benefits - input costs, animal health, productivity) REGION No. Farms Irrigated / Dryland No. Trials No. Trials Control (Base) kgDM/Ha GL Treat. Gain kgDM/Ha % Gain Range (%) North Vic 6 6 / 0 12 9 7,582 2,085 28% 14% to 75% Gippsland 8 5 / 3 14 12 5,169 1,895 37% 2% to 161% SW Vic 14 1 / 13 23 14 6,557 1,106 17% 5% to 79% Sthn Riverina 12 12 / 0 94 69 6,864 807 12% -9% to 25% OVERALL 40 24 / 16 143 104 Trials Completed and Reported (Average Gain)Trials Established
  • 5.
    Pasture Harvest Trials Otherobservations beyond pasture harvest gains • Pasture uniformity, clover content, weeds • Pastures lasting longer in dry condition (improved soil moisture) • Grazing pressure and grazing uniformity • Animal health, calf health (where larger portion of farm is treated) Fact: 100,000 change in BSCC impacts milk production by 5% – subclinical
  • 6.
    7 Day GrazingTrials Objective: Measure influence of Great Land treated pasture on Milk Production Method: Graze nominated pasture for 7 day periods: Control > Treated > Control Need at least one third of the farm as treated paddocks Milk data from third party processor Approx 36 hours Intake to milk output
  • 7.
    8,000 9,000 10,000 11,000 12,000 13,000 14,000 15,000 16,000 17,000 18,000 May-C May-T May-CJun-C Jun-T Jun-C July-C July-T Jul-C Nov-C Nov-T Nov-C Jan-C Jan-T Jan-C 7 Day Grazing Trial (2015/16), ‘Great Land’ Treatment Herd Average - Daily Milk Volume (L/Period) Control Treatment Season Average Volume to End Nov. Grazing Treated Paddocks = Gain 440 L/day (2.8%) No. Cows Reduced, Drying Off Source: Murray Goulburn
  • 8.
    50 75 100 125 150 May-C May-T May-CJun-C Jun-T Jun-C July-C July-T Jul-C Nov-C Nov-T Nov-C Jan-C Jan-T Jan-C 7 Day Grazing Trial (2015/16), ‘Great Land’ Treatment BMCC - Herd Average for Period ('000) Control Treatment Source: Murray Goulburn
  • 9.
    Full Farm -Demonstration Case Tasmania Conventional Scenario • Fertilisers dominated by urea (250- 350 kg N/yr), super phosphate, muriate of potash • Pastures not responding to N applications, pastures thin and limited clover. • Weed problems Results of Biological Approach Over 5-7 years, with GL in FY15 • Milk & MS production increased • BSCC reduced by > 100,000 • Revenue and profit increase • Pastures more even, clover dense and leaves double in size, root zone much deeper • Weeds under control • Corby grubs significantly supressed • Cows filling up on pasture more quickly (nutrient quality), pasture utilisation increased, stocking rate increased, • Fertility increased, portion of heifer calves increased (consistently)
  • 10.
    Full Farm Performance Tasmania 2013/142014/15 Variance Herd Size 550 610 60 11% Pasture (tDM/ha) 6.8 9.8 3.0 44% Milk price ($/kg MS) 6.63 6.22 -0.43 -6% Milk Production (Milk Solids – MS) Per Cow 368 389 21 6% Per Hectare 889 1,040 151 17% Dairy Profit Per hectare $625 $1,121 $496 79% Per cow $259 $419 $160 62%
  • 11.
    Pasture MT DM/Ha Dairy Profit +$113,000 Dairy Revenue Herd +60Head Milk Solids 35,000kg $142K $256K 79% Milk Price -$0.41/kg $1,343K $1,477K 10% $137K Impact on Dairy Revenue (FY15 vs FY14) -$83K $80K 6.8 MT 9.8MT 44% Revenue FY14 $1,343,100 Price Decrease -$83,090 Herd Size Increase $137,338 MS Volume & Value $79,678 Revenue FY15 Total $1,477,026 Revenue Increase $133,926 FY14 FY15 FY14 FY15 FY14 FY15
  • 12.
    Using Trial Results Profit/ Workload / Sustainable / Quality Conventional System Sustainable System Indirect Benefits: • Reduced Input Costs • Fertiliser/Chemicals/Health • Animal health gains, nutrient balance • Productivity • Cow Fertility • Calf Mortality Direct Benefits • More grass • More Milk
  • 13.
    Nutrients Pasture Quality & Quantity IncreasedGrowth Palatability Mastitis Mortality Fertility Milk Quality & Quantity Increased Milk Solids Decreased Somatic Cell Count Farm Inputs Decreased fertiliser Decreased Herbicides Decreased feed $ Increased Nutrient Availability • Improved soil structure • ↓ Nitrogen leaching • ↑Organic matter • ↑Moisture retention • Improved fertiliser efficiency Lameness Whole System Approach: Profits & Sustainability