FITT Report 13FT11 Grass factory New Zealand- weekly pasture dry matter measurement .pdf FINAL REPORT
•
1 like•305 views


Recommended
Recommended
More Related Content
What's hot
What's hot (19)
Viewers also liked
Viewers also liked (20)
Similar to FITT Report 13FT11 Grass factory New Zealand- weekly pasture dry matter measurement .pdf FINAL REPORT
Similar to FITT Report 13FT11 Grass factory New Zealand- weekly pasture dry matter measurement .pdf FINAL REPORT (20)
FITT Report 13FT11 Grass factory New Zealand- weekly pasture dry matter measurement .pdf FINAL REPORT
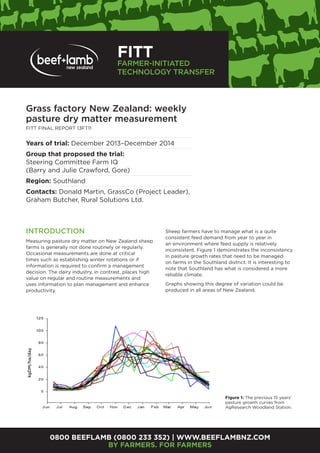
- 1. 0800 BEEFLAMB (0800 233 352) | WWW.BEEFLAMBNZ.COM BY FARMERS. FOR FARMERS Grass factory New Zealand: weekly pasture dry matter measurement FITT FINAL REPORT 13FT11 FITT FARMER-INITIATED TECHNOLOGY TRANSFER Years of trial: December 2013–December 2014 Group that proposed the trial: Steering Committee Farm IQ (Barry and Julie Crawford, Gore) Region: Southland Contacts: Donald Martin, GrassCo (Project Leader), Graham Butcher, Rural Solutions Ltd. INTRODUCTION Measuring pasture dry matter on New Zealand sheep farms is generally not done routinely or regularly. Occasional measurements are done at critical times such as establishing winter rotations or if information is required to confirm a management decision. The dairy industry, in contrast, places high value on regular and routine measurements and uses information to plan management and enhance productivity. Sheep farmers have to manage what is a quite consistent feed demand from year to year in an environment where feed supply is relatively inconsistent. Figure 1 demonstrates the inconsistency in pasture growth rates that need to be managed on farms in the Southland district. It is interesting to note that Southland has what is considered a more reliable climate. Graphs showing this degree of variation could be produced in all areas of New Zealand. Figure 1: The previous 15 years’ pasture growth curves from AgResearch Woodland Station. kgDM/ha/day
- 2. 0800 BEEFLAMB (0800 233 352) | WWW.BEEFLAMBNZ.COM BY FARMERS. FOR FARMERS This project was established to investigate the feasibility of intensive weekly whole farm pasture cover measures to assist with management decisions on one of Barry and Julie Crawford’s farms near Gore (Rosebank), a Farm IQ farm. There is a second property, also near Gore, which is effectively leased, and a third farm adjacent to Rosebank, purchased (165ha effective) with possession 30 May 2014, but grazed from 1 April 2014. This has upset the “normal” program and introduced complicating factors with regards to the benefits from weekly measuring. This FITT program is a little different as we are measuring the effects of using weekly grass measures, over the entire farm, without a control as such. The measures, in themselves, do nothing. The critical element is how you interpret and use the data. BASIC DETAILS OF ROSEBANK The effective area is 300ha, carrying 2770 commercial Highlander ewes, 750 Primera recorded ewes and 330 Primera ewe hoggets. Stock replacement policy is to purchase Highlander ewe lambs to allow all commercial ewes to be mated with Primera rams. Recorded ram lambs are sold off the farm in March. The Te Tipua farm has 1200 commercial Highlander ewes and 950 bought in Highlander ewe lambs. Ewe numbers have increased to 4,000 at Rosebank (including the new block) and 1,550 at Te Tipua. Lambing percentage at Rosebank is consistently above 150% with 18.5kg CW in lambs. Normally 800 to 1000 store lambs are bought in for finishing. Spreading date for lambing is 1st September for a planned 7 September start Conventional stocking rate at Rosebank is 12su/ha. There are 66 paddocks averaging 4.6ha, all troughed. Rainfall is 960mm. Cold, wet winters are a limitation. Up to 15ha brassica is grown, but in 2014 only 4.5ha was grown. Pastures are predominently ryegrass/ white clover. Investigation into ryegrass varieties and alternative varieties (plantain and red clover) are being carried out as part of the Farm IQ program. This is an intensive sheep operation with an overall objective of producing 450kg lamb carcass weight/ ha (they have achieved 373kg/ha and 370kg/ha lamb carcass weight for the previous two years). TECHNOLOGY USED TO MEASURE GRASS GrassCo has developed a highly modified “sledge” towed behind a quad. Whole farm measurement takes 1.3 hours with a person opening and closing gates. Consistent paddock tracks are taken, guided by GPS, and information is immediately available with details summarised as a pasture wedge graph. Paddocks that have had no grazing since the previous measurement are labelled as such. These “no graze” periods are being investigated as a means to identify non performing paddocks. Cost per whole farm measurement is $130.00 plus GST (46 weeks, $5,980 plus GST per annum). The six weeks over lambing were not measured. Also, a gate opener was provided, reducing the rate. While a lot of work went into the sledge design, no calibration was available initially. A decision was made by GrassCo to fund the calibration. AGMARDT was asked to help fund this calibration which they did. Public release of the calibration was not required. AgResearch was contracted to develop the calibration and this was completed as the weekly measuring began. Figure 2: Summary of of pasture covers recorded weekly.
- 3. 0800 BEEFLAMB (0800 233 352) | WWW.BEEFLAMBNZ.COM BY FARMERS. FOR FARMERS Figure 3: Weekly feed wedge for mid winter, spring, mid summer and autumn. KEY DECISIONS TAKEN WITH AID OF WEEKLY GRASS MEASUREMENT • Decision was made not to purchase any store lambs in January 2014. Normally, 800 to 1000 lambs have been purchased. • In mid February 2014, MA ewes averaged 63.7kg with 50% under their assigned weight and hence condition. The “Assigned Weight” progam is under investigation at Rosebank to improve summer management of ewes. Half of the MA ewes were below target mating condition. Priority feeding of low condition ewes was instigated at Rosebank. • Decision made mid February to accelerate lambs to slaughter. 31/4/14 102hd 18.2kg $104.75 24/2/14 294hd 18.9kgCW $103.61 25/2/14 565hd 18.3kgCW $103.09 Overall season performance 5,098hd 18.7kg $103.33 These three sheets were estimated to have a reduced CW of 1kg at $5.48/kg over 961hd. Value of reduction $5,266 plus GST.
- 4. 0800 BEEFLAMB (0800 233 352) | WWW.BEEFLAMBNZ.COM BY FARMERS. FOR FARMERS • Mid March 2014, estimated required 1 May covers for successful winter program. Start May cover needed to be 2,300kgDM/ha to set up a spreading cover, early September, of just under 1,400kgDM. As at mid March, covers were tracking along at about 1,700kgDM. The 5 May cover was 1,902kg, followed by a recovery the next week to 2,026kg. The 28 May actual cover was 2,068kg. The low 5 May measurement showed a sharp decline from the previous measurement and a subsequent sharp increase in the following week. Smoothing out the line could indicate a cover of 2,050kgDM. The 4.5ha brassica had an additional 2tDM/ha yield over budget, adding the equivalent of 30kg/ha to the feed cover. The purchase of the third adjacent farm, and being able to short term graze the farm before possession helped overcome the issue. The cost of this two month short term lease (April and May), prior to possession was $15,000 plus GST. • Nitrogen applied: 18.7ha at 35kgN/ha. Urea applied: 1.4t at $800/t. Total cost $1,120 plus GST. • Freezer ewes away start of December. • 10/12/14: ewes to grazing at Te Tipua property. • From mid October 2014, all ewes and lambs rotated until weaning (weaning began beginning of December and was finalised 15 January). • Weaning draft 180—normally 500. • Winter allocation of feed to ewes improved with access to accurate paddock covers every week. Grazing days for each paddock were determined with the use of a Landcorp program. The aim is to feed ewes accurately and consistently during pregnancy to maintain condition and avoid sharp changes in level of ME intake. • Ewe and lamb rotations began mid October 2014 and continued to weaning. • Lamb drenching began mid November. • Feed covers improved by late November, no store lambs purchased as wanted to improve pastures with grass to grass direct drilling. ANALYSIS A YEARS’ WEEKLY RECORDING A confounding issue with the timing of this FITT program is that the 12 month period was spread over two production cycles, the last half of the 2013 cycle and the first half of the 2014 cycle. However, five key periods were chosen: Ewes Weaning 2013 to mating 2014 Mating 2014 to tailing 2014 Tailing 2014 to weaning 2014 Lambs Weaning 2013 to slaughter Lambs born 2014 to weaning These periods cover the December to December period of the program. COSTS 46 weekly measurements reported for 66 individual paddocks. Pasture growth rate reported for ungrazed paddocks, feed wedge graph provided each week together with graph recording average farm cover changes. = $5,980 + GST BENEFITS Period 1: Ewes, weaning 2013 (start of the program) to mating 2014 The primary objective on this farm is to present all ewes to the ram as CS 3.5. Average live weight and average condition score targets are irrelevant in the context of wanting every ewe to achieve a score of 3.5. Each ewe is assigned a target weight for her to achieve 3.5 CS. Electronic tags and auto drafting on the basis of proximity to assigned weight were used for this period. Ewes were drafted on the basis of those needed to increase CS, those close to target CS and those over target CS. Note that all this was done with auto drafting on live weight. Mobs were fed according to requirements. Key objectives for this period: All ewes going to the ram at 3.5CS. 1 May pasture average pasture cover 2,300kgDM/ha Results: Table 1 details results for ewe condition and live weight. Average pasture cover on 28 April was 2,068kgDM/ha. A week later it had dropped to 1,902kg and a week after that it recovered to 2,026kg. There is no immediate explanation of these large short term shifts other than 5 May may have been compromised—probable cover was 2,050kg. CS/LW at mating 2012 3.19/64.1kg 2013 3.44/66.2 2014 3.63*/67.7kg Table 1: Condition score data at mating 2014. *CS estimated from assigned weight algorithm.
- 5. 0800 BEEFLAMB (0800 233 352) | WWW.BEEFLAMBNZ.COM BY FARMERS. FOR FARMERS Period 2: Ewe mating 2014 to tailing 2014 This is the period where the results of ewe summer and winter management is put under the test with scanning and tailing results. The feeding objective over this period was to maintain ewes at mating condition by providing a correct and consistent level of feeding for ewes. For triplet ewes post scanning, the Landcorp feed calculator was used and to use this it is essential to have paddock covers. Year Scan% Dry Deaths mate to scan Deaths mate to lamb Bearings Loss of lambs scan to tail Tail % Wet/dry Lamb tailing weight 2012 205% 1.9% 10 4.7% 48 25.4% 155%* 150 11.9kg 2013 194% 2.2% N/A 78hd 17.5% 160%* 41 11.0kg 2014 203% 2.2% 8 150hd 19.8%* 160.0%* 90 10.98kg 2014** 300% 20.6% 238% 17 *Includes all ewes and lambs over all farms. 2012 and 2013 include Rosebank only. Mobs were shifted between farms **Triplets only from scanning Lamb weaning LW Average kill date Av. lamb CW Kg Lamb CW for season Kg CW/ha 2012 19 Feb 19.4kg 103,325kg 373kg 2013 33.3kg 23 Feb 19.5kg 111,856kg 370kg 2014 29.4kg This, together with mob and paddock sizes, was used to determine grazing days per paddock. Results are shown in Table 2. The 2014 results were achieved with the additional data from weekly grass measures. The 2014 mating to tailing period showed a recovery in scanning percentage but a higher ewe deaths resulted in 160% lambing, the same as the previous year. Lamb tailing weights were on par. Table 2: Production data mating to tailing Period 3: Ewes, tailing 2014 to weaning 2014 Weekly grass measuring was suspended over lambing for six weeks. Weaning results in terms of lamb weaning weight and lamb numbers is the final test of ewe management from the previous weaning. The most important aspect of this management is the nutrition management of the flock. This period saw soil moisture at saturation for long periods (Figure 4). From an average cover of 1,751kg at set stocking on 1 September, cover fell to 1,430kg on 17 October, when measurements began again, and did not begin to recover until mid November. This has raised a question about target covers at set stocking and lambing dates. Given the soil moisture conditions over the period, careful interpretation is needed. But, important questions are highlighted. Figure 4: Soil moisture for FITT period Period 4: Lambs weaned 2013 to slaughter This period was characterised by a sharp decline in pasture cover in mid January. No store lambs were purchased and some nitrogen was used. Table 3 details results and comparisons to 2012. The 2013 lambs shown in Table 3 were included in the FITT program from weaning to slaughter. Clover root weevil was a significant factor over this period with minimal clover present. Table 3: 2013 born lambs, data from weaning to slaughter
- 6. 0800 BEEFLAMB (0800 233 352) | WWW.BEEFLAMBNZ.COM BY FARMERS. FOR FARMERS Period 5: Lambs born 2014 to weaning Lamb performance during this period is governed by ewe lactation (governed by ewe condition at lambing and pasture cover during early lactation), pasture cover to weaning and pasture cover and pasture quality. Table 4 shows details of 2014 born lambs. Lamb weaning LW Average kill date Av. lamb CW Kg Lamb CW for season Kg CW/ha 2014 29.4kg to date * * * * *Not yet available Table 4: 2014 born lambs, data to weaning. PADDOCK ASSESSSMENT As part of the weekly measurement, all paddocks that were not grazed during the previous week are noted. The year’s information on paddocks 63 and 14 are shown in Tables 5 and 6. Table 5: Paddock 63 Table 6: Paddock 14
- 7. 0800 BEEFLAMB (0800 233 352) | WWW.BEEFLAMBNZ.COM BY FARMERS. FOR FARMERS This information allows us to rank paddocks with the development of two indices. The growth index tells us how the paddock performed over the no grazing periods using average results from all the non grazed paddocks. The speed of grass growth depends on how much grass there is to begin with. The opening cover index allows us to judge the impact of any differences in opening cover at the start of the non grazing periods. For example, paddock 14 grew 14% more over the measurement periods. This paddock had slightly higher opening covers. Paddock 63, on the other hand, grew 19% less and had 14% less cover at the start of each grazing period. Poorly performing paddocks are easily identified. Taking “snapshots” of paddocks during the year provides a reasonable paddock assessment with the only cost being programming a computer to analyse the data and marking paddocks during the weekly measure as not grazed. By the end of 52 weeks we should be able to rank all paddocks at Rosebank for productivity. The current data handling to do this comparison is quite cumbersome, being manual. GrassCo is investigating adding a module into their own program system that will provide this information. This has been an unexpected outcome from the weekly measurement. Of course, as the period between measurements increases, the chances of getting “graze free periods” reduces. KEY FINDINGS The cost of the one-year program was $5,980 plus GST. A large amount of data was recorded for individual paddocks and the key summary was average pasture cover. The trends in pasture covers and actual paddock covers drove management decisions relating to: • Target liveweights for works’ lambs. • Decisions on store lamb purchases. • Priority summer management of ewes to target mating all ewes at CS 3.5. • The achievement of calculated 1 May covers to ensure a viable winter feed budget. • Use of nitrogen. • Decisions to graze ewes off the Rosebank block. • Ensuring consistent and accurate feeding of ewes mating to lambing. • Developing a paddock assessment program. This FITT program covered one year. The year included the last half of a production period and the first half of the next production period. Clover root weevil was a significant factor not seen before and the last six months of the period saw saturated soils for long periods (Figure 4). The ewes showed improved scanning (203%) following decisions being made in the first half of the program. Lamb losses from scanning were higher at 19.8% with tailing at 160%, the same as the previous year. Lamb tailing weights were on par at 11kg, but weaning weights were down about 3kg as result of a very wet spring in 2014. VERY IMPORTANT QUESTIONS/OBSERVATIONS Lambing dates and planned spreading cover needs to be reviewed. The spreading cover in the spring of 2014 was 1,750kg and quickly fell to 1,400kg with a recovery beginning about mid November. In this high performing flock, the result was a 3kg reduced weaning weight in lambs. Is the current commonly used target of 1,400kg spreading cover sufficient for high performing flocks? Is it sufficient for average flocks? While this is highlighted, is this likely to be a consistent feature of future growth patterns? One year’s data is probably insufficient to justify changes in dates and planned covers. The power of this information will increase as more years are collected. The winter feeding for triplet ewes’ program using Landcorp’s feed calculator resulted in higher feeding levels than have been used in the past. The keys to this calculator are accurate feeding and consistent feeding i.e. avoiding large swings in levels of energy intake. Knowing pasture covers are critical to achieving this. Lamb loss in the triplet mob from scanning to tailing was 20.6%. There are many flocks where this would be considered an average result across the whole flock. Differences in paddock performance are highlighted. The two paddocks selected out of only four manually analysed show a difference of 33% in production. It will be instructive to see the full list relative to paddock performance when they become available. This represents a large opportunity.
- 8. 0800 BEEFLAMB (0800 233 352) | WWW.BEEFLAMBNZ.COM BY FARMERS. FOR FARMERS Figure 3 shows a high performance sheep farm pasture wedges for autumn, winter, spring and summer. They are surprisingly consistent. Weekly measurement, in itself, does not lift productivity. It is how you use the data that counts. As well, the more production data is collected on sheep performance, then the more useful the weekly pasture cover data will become. Patterns will develop and issues will be highlighted. Each year’s growth pattern is different and regular measures will provide an early warning of problems and opportunities. Weekly measures represent the ultimate system. Reduced frequency of measurement, but at critical times, for example pre winter for feed budgeting, will be useful. There are other measurement systems in use that could provide this information, but these can be time consuming for the farmer and calibration is an issue that you need to be confident about. ECONOMICS OF WEEKLY MEASURES Because there were no controls as such within this FITT program and because we are looking at the whole farm management system, we cannot definitely calculate gains made. We are not comparing one system against another to define a clear result. However, justification of the annual $5,980 + GST cost could be made because of improved post scan triplet management of 759 ewes resulting in a triplet lambing of 238%. Industry averages for triplet lambings vary between 170% (extensive farms) and 220% (intensive farms). If we attribute an 18% increase in lambs over 759 ewes at $90/ lamb, this generates 136 lambs with a total gross value of $12,240. To achieve this result, we need a significant proportion of triplet ewes which means good genetics and good summer ewe management to mate ewes in the right condition. The achievement of this result with the triplet mob is a year round management issue. While this is simplistic, this item alone generates $2 for every $1 spent. “Measuring our grass weekly has given us an accurate measurement of the grass covers available over our Rosebank property. This has been particularly useful when setting up our winter feed budget and also over the winter and pre lamb period where we were wanting to feed our triplet bearing ewes at a consistent, correct level. During the summer we were looking for trend lines—too many downward measures gave us the indication to off- load lambs slightly earlier than we would have normally. It is all about being pro-active, not re-active” Barry and Julie Crawford CONTACTS Barry and Julie Crawford (03) 207 1818, bjcrawf@ispnz.co.nz Graham Butcher (03) 208 9956. gbutcher@esi.co.nz Donald Martin, GrassCo (03) 206 4668, info@grassco.co.nz A modified sledge used to measure pasture cover This publication is made possible by sheep and beef farmer investment in the industry. Beef + Lamb New Zealand is not liable for any damage suffered as a result of reliance on the information contained in this document. Any reproduction is welcome as long as you acknowledge Beef + Lamb New Zealand as the source.