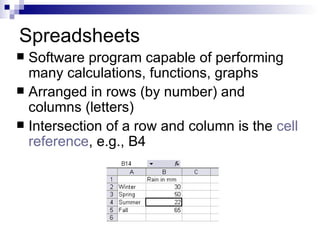
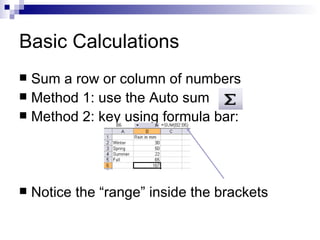
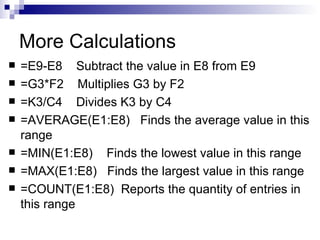
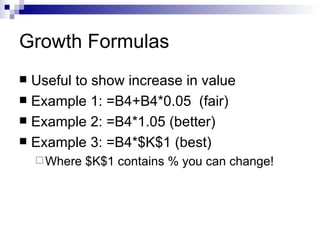
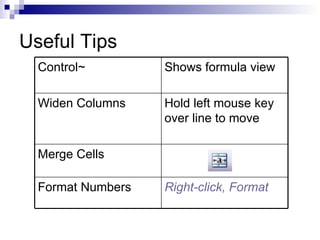
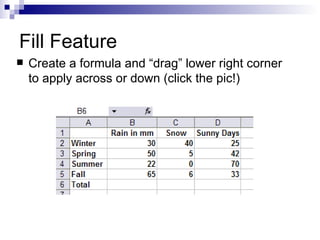
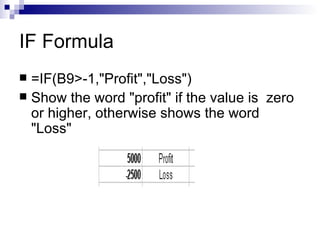
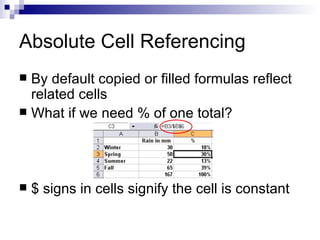
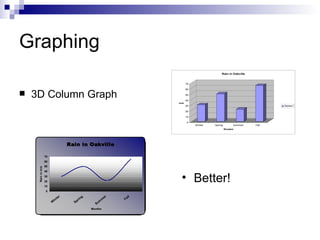
Spreadsheets
Spreadsheets Software program capable of performing many calculations, functions, graphs Arranged in rows (by number) and columns (letters) Intersection of a row and column is the  cell reference , e.g., B4
Basic Calculations Sum a row or column of numbers Method 1: use the Auto sum Method 2: key using formula bar: Notice the “range” inside the brackets
More Calculations =E9-E8  Subtract the value in E8 from E9 =G3*F2  Multiplies G3 by F2  =K3/C4  Divides K3 by C4 =AVERAGE(E1:E8)  Finds the average value in this range =MIN(E1:E8)  Finds the lowest value in this range =MAX(E1:E8)  Finds the largest value in this range =COUNT(E1:E8)  Reports the quantity of entries in this range
Growth Formulas Useful to show increase in value Example 1: =B4+B4*0.05  (fair) Example 2: =B4*1.05 (better) Example 3: =B4*$K$1 (best) Where $K$1 contains % you can change!
Useful Tips Right-click, Format Format Numbers Merge Cells Hold left mouse key over line to move Widen Columns  Shows formula view Control~
Fill Feature Create a formula and “drag” lower right corner to apply across or down (click the pic!)
IF Formula =IF(B9>-1,"Profit","Loss")  Show the word "profit" if the value is  zero or higher, otherwise shows the word "Loss"
Absolute Cell Referencing By default copied or filled formulas reflect related cells What if we need % of one total? $ signs in cells signify the cell is constant
Graphing By default column A is the x-axis and B, C, D, etc. are for values (Y-axes) Use the graph icon  Name the  series  to create proper legends Excel graphs are drab … spice them up!
Graphing 3D Column Graph Better!

2.20 Spreadsheets

  • 1.
  • 2.
    Spreadsheets Software programcapable of performing many calculations, functions, graphs Arranged in rows (by number) and columns (letters) Intersection of a row and column is the cell reference , e.g., B4
  • 3.
    Basic Calculations Suma row or column of numbers Method 1: use the Auto sum Method 2: key using formula bar: Notice the “range” inside the brackets
  • 4.
    More Calculations =E9-E8 Subtract the value in E8 from E9 =G3*F2 Multiplies G3 by F2 =K3/C4 Divides K3 by C4 =AVERAGE(E1:E8) Finds the average value in this range =MIN(E1:E8) Finds the lowest value in this range =MAX(E1:E8) Finds the largest value in this range =COUNT(E1:E8) Reports the quantity of entries in this range
  • 5.
    Growth Formulas Usefulto show increase in value Example 1: =B4+B4*0.05 (fair) Example 2: =B4*1.05 (better) Example 3: =B4*$K$1 (best) Where $K$1 contains % you can change!
  • 6.
    Useful Tips Right-click,Format Format Numbers Merge Cells Hold left mouse key over line to move Widen Columns Shows formula view Control~
  • 7.
    Fill Feature Createa formula and “drag” lower right corner to apply across or down (click the pic!)
  • 8.
    IF Formula =IF(B9>-1,"Profit","Loss") Show the word "profit" if the value is zero or higher, otherwise shows the word "Loss"
  • 9.
    Absolute Cell ReferencingBy default copied or filled formulas reflect related cells What if we need % of one total? $ signs in cells signify the cell is constant
  • 10.
    Graphing By defaultcolumn A is the x-axis and B, C, D, etc. are for values (Y-axes) Use the graph icon Name the series to create proper legends Excel graphs are drab … spice them up!
  • 11.
    Graphing 3D ColumnGraph Better!